TrendEnvelopes_v1
Download script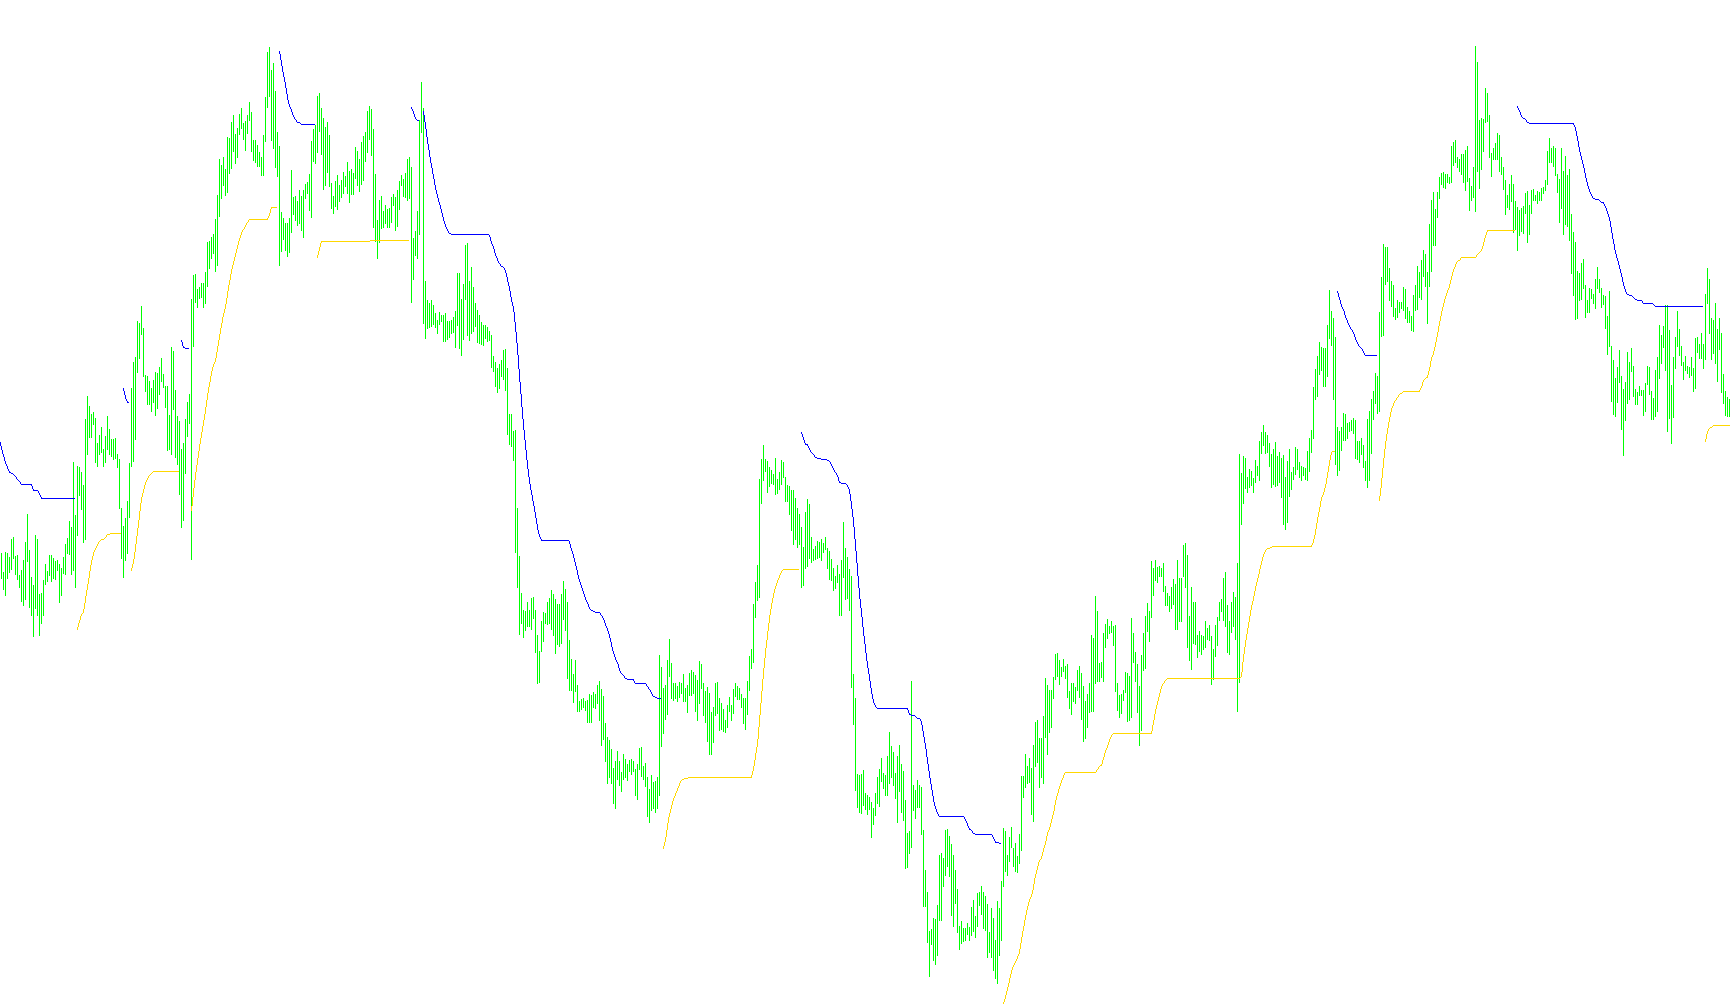
The TrendEnvelopes script is a technical analysis tool designed to help traders identify and visualize the current direction of a market trend. Instead of just looking at simple price movements, it creates dynamic "envelopes" or boundaries that react to price action, helping to filter out market noise and highlight significant shifts in momentum.
How the Logic Works
The tool operates based on three primary layers of logic:
1. Establishing the Baseline The script begins by calculating a Moving Average (MA), which serves as the "heart" of the indicator. This represents the smoothed average price over a specific period. From this baseline, it creates an upper and lower boundary (the envelopes) based on a user-defined percentage of deviation. Think of this as creating a "corridor" around the average price; if the price stays within this corridor, the trend is relatively stable.
2. Trend Detection and Switching The core intelligence of the script lies in how it identifies a change in trend direction:
- Bullish Trend: If the current closing price breaks above the previous upper boundary, the script recognizes an upward trend. It then locks onto the lower boundary to track the "floor" of this movement.
- Bearish Trend: If the current closing price falls below the previous lower boundary, the script recognizes a downward trend and locks onto the upper boundary to track the "ceiling" of the movement.
This logic ensures that once a trend is established, the indicator stays committed to that direction until a significant price breakout forces a reversal.
3. Dynamic Support and Resistance Tracking A unique feature of this script is how it manages these boundaries. In an uptrend, the lower boundary (the support) will only move up if the market reaches a new "lowest high" relative to the previous trend step. Conversely, in a downtrend, the upper boundary (the resistance) only moves down as new lows are established. This prevents the lines from fluctuating erratically and ensures they represent meaningful price levels.
4. Visual Signaling (Optional) The script includes an optional signaling feature. When a trend reversal is officially confirmed (e.g., switching from bearish to bullish), the tool can place specific visual markers (arrows) on the chart. These signals are calculated based on market volatility, helping to pinpoint the exact moment the "breakout" occurred relative to recent price history.
Summary for the User
In practical terms, this script acts as a trend-following guide. It provides you with:
- Visual Boundaries: Clear lines showing where the current trend's support and resistance lie.
- Trend Filtering: It helps distinguish between minor price fluctuations and actual structural shifts in the market.
- Dynamic Adaptation: The envelopes "stretch" and "contract" automatically based on how aggressively the price moves, providing a more organic view of market sentiment than static lines.
//+------------------------------------------------------------------+
//|                                            TrendEnvelopes_v1.mq4 |
//|                           Copyright © 2006, TrendLaboratory Ltd. |
//|            http://finance.groups.yahoo.com/group/TrendLaboratory |
//|                                   E-mail: igorad2003@yahoo.co.uk |
//+------------------------------------------------------------------+
#property copyright "Copyright © 2006, TrendLaboratory Ltd."
#property link      "http://finance.groups.yahoo.com/group/TrendLaboratory"
//---- indicator settings
#property indicator_chart_window
#property indicator_buffers 4
#property indicator_color1 LightBlue
#property indicator_color2 Orange
#property indicator_width1 2
#property indicator_width2 2
#property indicator_color3 LightBlue
#property indicator_color4 Orange
#property indicator_width3 2
#property indicator_width4 2
//---- indicator parameters
extern int     MA_Period      = 14;
extern int     MA_Shift       =  0;
extern int     MA_Method      =  3;
extern int     Applied_Price  =  0;
extern double  Deviation      =0.2;
extern int     UseSignal      =  0;
//---- indicator buffers
double UpBuffer[];
double DnBuffer[];
double UpSignal[];
double DnSignal[];
double smax[];
double smin[];
double trend[];

//----
int ExtCountedBars=0;
//+------------------------------------------------------------------+
//| Custom indicator initialization function                         |
//+------------------------------------------------------------------+
int init()
  {
   int    draw_begin;
   string short_name;
//---- drawing settings
   IndicatorBuffers(7);
   SetIndexStyle(0,DRAW_LINE);
   SetIndexShift(0,MA_Shift);
   SetIndexStyle(1,DRAW_LINE);
   SetIndexShift(1,MA_Shift);

   SetIndexStyle(2,DRAW_ARROW);
   SetIndexShift(2,MA_Shift);
   SetIndexArrow(2,233);
   SetIndexStyle(3,DRAW_ARROW);
   SetIndexShift(3,MA_Shift);
   SetIndexArrow(3,234);

   IndicatorDigits(MarketInfo(Symbol(),MODE_DIGITS));
   if(MA_Period<2) MA_Period=14;
   draw_begin=MA_Period-1;
//---- indicator short name
   IndicatorShortName("Env("+MA_Period+")");
   SetIndexLabel(0,"UpTrendEnv");
   SetIndexLabel(1,"DnTrendEnv");
   SetIndexLabel(2,"UpSignal");
   SetIndexLabel(3,"DnSignal");
   SetIndexDrawBegin(0,draw_begin);
   SetIndexDrawBegin(1,draw_begin);
   SetIndexDrawBegin(2,draw_begin);
   SetIndexDrawBegin(3,draw_begin);
   //---- indicator buffers mapping
   SetIndexBuffer(0,UpBuffer);
   SetIndexBuffer(1,DnBuffer);
   SetIndexBuffer(2,UpSignal);
   SetIndexBuffer(3,DnSignal);
   SetIndexBuffer(4,smax);
   SetIndexBuffer(5,smin);
   SetIndexBuffer(6,trend);
   if(Deviation<0.1) Deviation=0.1;
   if(Deviation>100.0) Deviation=100.0;
//---- initialization done
   return(0);
  }
//+------------------------------------------------------------------+
//| Custom indicator iteration function                              |
//+------------------------------------------------------------------+
int start()
  {
   int limit;
   if(Bars<=MA_Period) return(0);
   ExtCountedBars=IndicatorCounted();
//---- check for possible errors
   if (ExtCountedBars<0) return(-1);
//---- last counted bar will be recounted
   if (ExtCountedBars>0) ExtCountedBars--;
   limit=Bars-ExtCountedBars;
//---- EnvelopesM counted in the buffers
   for(int i=limit; i>=0; i--)
     {
      smax[i] = (1+Deviation/100)*iMA(NULL,0,MA_Period,0,MA_Method,Applied_Price,i);
      smin[i] = (1-Deviation/100)*iMA(NULL,0,MA_Period,0,MA_Method,Applied_Price,i);

      trend[i]=trend[i+1];

	   if (Close[i]>smax[i+1])  trend[i]=1;
	   if (Close[i]<smin[i+1])  trend[i]=-1;

	   if(trend[i]>0)
	   {
	   if (smin[i]<smin[i+1]) smin[i]=smin[i+1];
	   UpBuffer[i]=smin[i];
	   if (UseSignal>0)
	   if (trend[i+1]<0) UpSignal[i] = Low[i]-0.5*iATR(NULL,0,MA_Period,i);
	   DnBuffer[i]=EMPTY_VALUE;
	   }
	   else
	   {
	   if(smax[i]>smax[i+1]) smax[i]=smax[i+1];
	   DnBuffer[i]=smax[i];
	   if (UseSignal>0)
	   if (trend[i+1]>0) DnSignal[i] = High[i]+0.5*iATR(NULL,0,MA_Period,i);
	   UpBuffer[i]=EMPTY_VALUE;
	   }
   }
//---- done
   return(0);
  }
//+------------------------------------------------------------------+
Comments