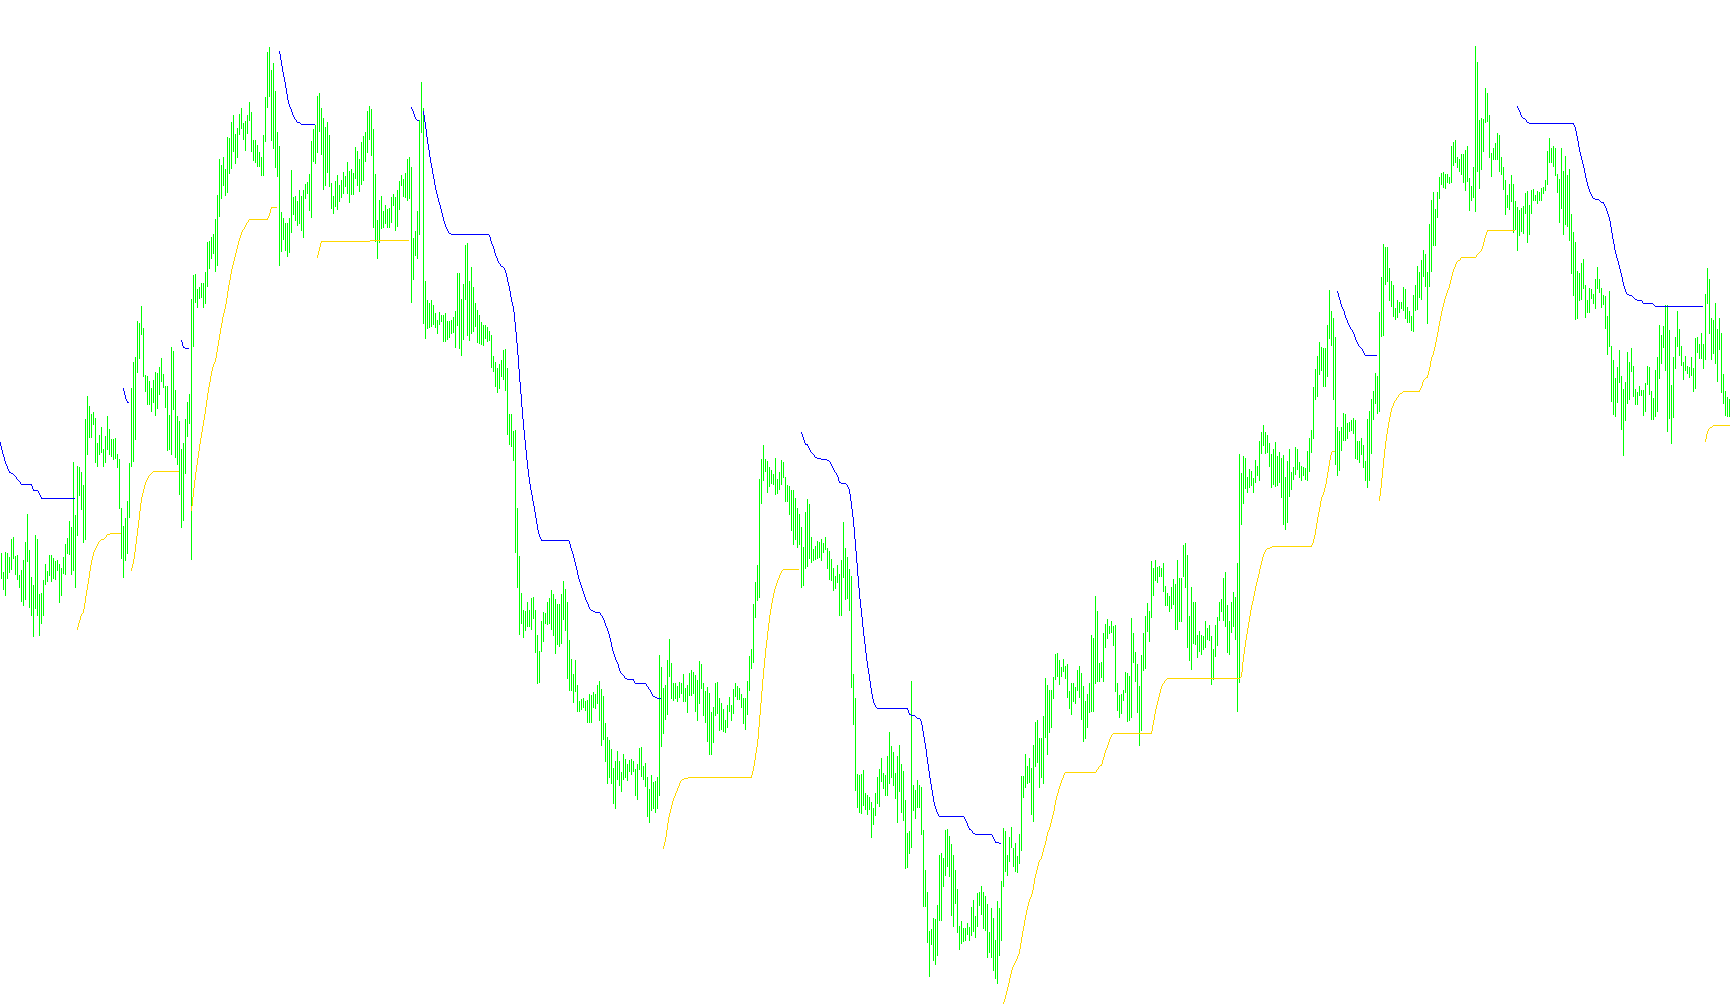
The TrendEnvelopes indicator is designed to help traders identify the current direction of the market and visualize potential support and resistance boundaries based on moving averages. Instead of just showing a single line, it creates dynamic "envelopes" that react to price action over time.
Core Logic Overview
The tool operates by calculating a baseline moving average and then creating two outer boundaries (an upper and a lower limit) based on a user-defined percentage of deviation. These boundaries act as a "channel" around the market's average price.
How it Identifies Trends
The script constantly monitors the relationship between the current market price and these calculated boundaries:
- Trend Detection: It determines the direction of the market by checking if the closing price has broken above the upper boundary or below the lower boundary.
- Persistence: Once a trend is established (upward or downward), the indicator "locks" into that state until a significant break in the opposite direction occurs.
Visualizing the Envelopes
The primary purpose of the visual lines is to show the "floor" and "ceiling" of the current move:
- In an Uptrend: The indicator focuses on the lower boundary. It tracks the lowest point reached during the move, creating a trailing support line. This helps traders see where a potential pullback might find a base before moving higher again.
- In a Downtrend: The indicator focuses on the upper boundary. It tracks the highest point reached during the decline, creating a trailing resistance line. This helps visualize how far the price has "stretched" and identifies where it might face pressure to reverse.
Signal Alerts
The script includes an optional signaling feature. When the trend flips (for example, switching from an uptrend to a downtrend), the tool can place specific markers on the chart:
- Buy Signals: These appear when the price shifts into an upward trend, positioned slightly below the recent low.
- Sell Signals: These appear when the price shifts into a downward trend, positioned slightly above the recent high.
Summary for the User
Essentially, this script filters out market "noise" by identifying the overarching trend. It provides a visual map of where the market is currently heading and draws a line representing the safest "support" or "resistance" levels during that move, making it easier to spot potential entry points or areas where the current momentum might be exhausted.
//+------------------------------------------------------------------+
//|                                            TrendEnvelopes_v1.mq4 |
//|                           Copyright © 2006, TrendLaboratory Ltd. |
//|            http://finance.groups.yahoo.com/group/TrendLaboratory |
//|                                   E-mail: igorad2003@yahoo.co.uk |
//+------------------------------------------------------------------+
#property copyright "Copyright © 2006, TrendLaboratory Ltd."
#property link      "http://finance.groups.yahoo.com/group/TrendLaboratory"
//---- indicator settings
#property indicator_chart_window
#property indicator_buffers 4
#property indicator_color1 LightBlue
#property indicator_color2 Orange
#property indicator_width1 2
#property indicator_width2 2
#property indicator_color3 LightBlue
#property indicator_color4 Orange
#property indicator_width3 2
#property indicator_width4 2
//---- indicator parameters
extern int     MA_Period     =14;
extern int     MA_Shift     =0;
extern int     MA_Method    =3;
extern int     Applied_Price=0;
extern double  Deviation      =0.2;
extern int     UseSignal    =0;
//---- indicator buffers
double UpBuffer[];
double DnBuffer[];
double UpSignal[];
double DnSignal[];
double smax[];
double smin[];
double trend[];
//----
int ExtCountedBars=0;
//+------------------------------------------------------------------+
//| Custom indicator initialization function                         |
//+------------------------------------------------------------------+
int init()
  {
   int    draw_begin;
   string short_name;
//---- drawing settings
   IndicatorBuffers(7);
   SetIndexStyle(0,DRAW_LINE);
   SetIndexShift(0,MA_Shift);
   SetIndexStyle(1,DRAW_LINE);
   SetIndexShift(1,MA_Shift);
   //
   SetIndexStyle(2,DRAW_ARROW);
   SetIndexShift(2,MA_Shift);
   SetIndexArrow(2,233);
   SetIndexStyle(3,DRAW_ARROW);
   SetIndexShift(3,MA_Shift);
   SetIndexArrow(3,234);
   //
   IndicatorDigits(MarketInfo(Symbol(),MODE_DIGITS));
   if(MA_Period<2) MA_Period=14;
   draw_begin=MA_Period-1;
//---- indicator short name
   IndicatorShortName("Env("+MA_Period+")");
   SetIndexLabel(0,"UpTrendEnv");
   SetIndexLabel(1,"DnTrendEnv");
   SetIndexLabel(2,"UpSignal");
   SetIndexLabel(3,"DnSignal");
   SetIndexDrawBegin(0,draw_begin);
   SetIndexDrawBegin(1,draw_begin);
   SetIndexDrawBegin(2,draw_begin);
   SetIndexDrawBegin(3,draw_begin);
//---- indicator buffers mapping
   SetIndexBuffer(0,UpBuffer);
   SetIndexBuffer(1,DnBuffer);
   SetIndexBuffer(2,UpSignal);
   SetIndexBuffer(3,DnSignal);
   SetIndexBuffer(4,smax);
   SetIndexBuffer(5,smin);
   SetIndexBuffer(6,trend);
   if(Deviation<0.1) Deviation=0.1;
   if(Deviation>100.0) Deviation=100.0;
//---- initialization done
   return(0);
  }
//+------------------------------------------------------------------+
//| Custom indicator iteration function                              |
//+------------------------------------------------------------------+
int start()
  {
   int limit;
   if(Bars<=MA_Period) return(0);
   ExtCountedBars=IndicatorCounted();
//---- check for possible errors
   if (ExtCountedBars<0) return(-1);
//---- last counted bar will be recounted
   if (ExtCountedBars>0) ExtCountedBars--;
   limit=Bars-ExtCountedBars;
//---- EnvelopesM counted in the buffers
   for(int i=limit; i>=0; i--)
     {
      smax[i]=(1+Deviation/100)*iMA(NULL,0,MA_Period,0,MA_Method,Applied_Price,i);
      smin[i]=(1-Deviation/100)*iMA(NULL,0,MA_Period,0,MA_Method,Applied_Price,i);
      trend[i]=trend[i+1];
      if (Close[i]>smax[i+1])  trend[i]=1;
      if (Close[i]<smin[i+1])  trend[i]=-1;
      if(trend[i]>0)
        {
         if (smin[i]<smin[i+1]) smin[i]=smin[i+1];
         UpBuffer[i]=smin[i];
         if (UseSignal>0)
            if (trend[i+1]<0) UpSignal[i]=Low[i]-0.5*iATR(NULL,0,MA_Period,i);
         DnBuffer[i]=EMPTY_VALUE;
        }
      else
        {
         if(smax[i]>smax[i+1]) smax[i]=smax[i+1];
         DnBuffer[i]=smax[i];
         if (UseSignal>0)
            if (trend[i+1]>0) DnSignal[i]=High[i]+0.5*iATR(NULL,0,MA_Period,i);
         UpBuffer[i]=EMPTY_VALUE;
        }
     }
//---- done
   return(0);
  }
//+------------------------------------------------------------------+
Comments