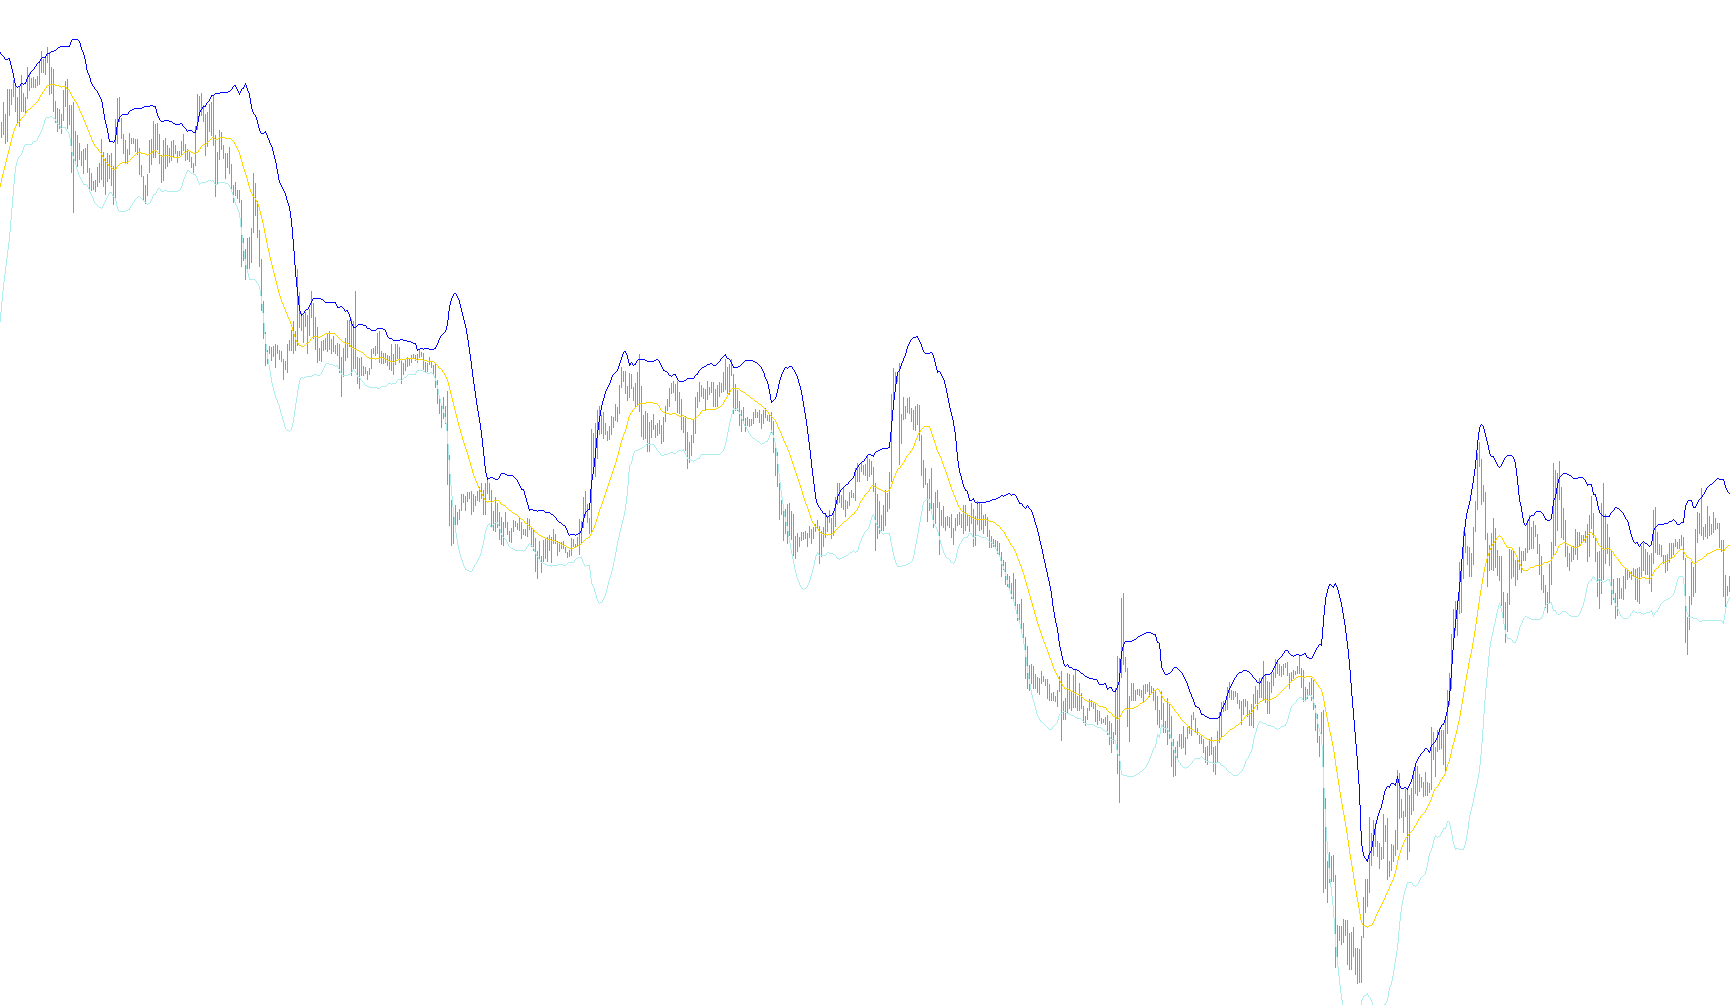
This script is designed to create a visual technical analysis tool known as Bollinger Bands on your trading charts. Its primary purpose is to help traders visualize price volatility and identify potential overbought or oversold conditions by establishing a "normal" range for the market.
How the Logic Works
The script processes historical price data to generate three distinct lines that move across your chart in real-time. Here is the step-by-step breakdown of how it calculates these values:
1. Establishing the Baseline (The Moving Average) First, the script looks at a specific number of previous price points (defined by the "Period" setting). It calculates the Simple Moving Average (SMA) of the closing prices over this timeframe. This creates a central baseline on your chart that represents the average trend of the market.
2. Measuring Price Variance (Volatility) Once the baseline is established, the script looks at how much the price has fluctuated away from that average over the same period. It calculates the "Standard Deviation"—a mathematical way to measure how much the price is swinging. If the price stays very close to the average, the variance is low; if the price swings wildly up and down, the variance is high.
3. Creating the Boundary Bands The script then uses that variance to draw two outer boundaries (the Upper and Lower Bands) around the central moving average:
- Upper Band: Calculated by adding a specific number of standard deviations to the moving average.
- Lower Band: Calculated by subtracting that same number of standard deviations from the moving average.
How it Appears on Your Chart
As new price data arrives, the script constantly recalculates these three lines. This creates a "channel" or "envelope":
- When the market is stable, the bands will tighten closer to the middle line.
- When the market becomes highly volatile, the bands will expand outward.
By observing where the current price sits in relation to these bands, traders use this logic to gauge whether the current price movement is an extreme outlier compared to recent history.
//+------------------------------------------------------------------+
//|                                                        Bands.mq4 |
//|                      Copyright © 2005, MetaQuotes Software Corp. |
//|                                       http://www.metaquotes.net/ |
//+------------------------------------------------------------------+
#property copyright "Copyright © 2005, MetaQuotes Software Corp."
#property link      "http://www.metaquotes.net/"

#property indicator_chart_window
#property indicator_buffers 3
#property indicator_color1 LightSeaGreen
#property indicator_color2 LightSeaGreen
#property indicator_color3 LightSeaGreen
//---- indicator parameters
extern int    BandsPeriod=20;
extern int    BandsShift=0;
extern double BandsDeviations=2.0;
//---- buffers
double MovingBuffer[];
double UpperBuffer[];
double LowerBuffer[];
//+------------------------------------------------------------------+
//| Custom indicator initialization function                         |
//+------------------------------------------------------------------+
int init()
  {
//---- indicators
   SetIndexStyle(0,DRAW_LINE);
   SetIndexBuffer(0,MovingBuffer);
   SetIndexStyle(1,DRAW_LINE);
   SetIndexBuffer(1,UpperBuffer);
   SetIndexStyle(2,DRAW_LINE);
   SetIndexBuffer(2,LowerBuffer);
//----
   SetIndexDrawBegin(0,BandsPeriod+BandsShift);
   SetIndexDrawBegin(1,BandsPeriod+BandsShift);
   SetIndexDrawBegin(2,BandsPeriod+BandsShift);
//----
   return(0);
  }
//+------------------------------------------------------------------+
//| Bollinger Bands                                                  |
//+------------------------------------------------------------------+
int start()
  {
   int    i,k,counted_bars=IndicatorCounted();
   double deviation;
   double sum,oldval,newres;
//----
   if(Bars<=BandsPeriod) return(0);
//---- initial zero
   if(counted_bars<1)
      for(i=1;i<=BandsPeriod;i++)
        {
         MovingBuffer[Bars-i]=EMPTY_VALUE;
         UpperBuffer[Bars-i]=EMPTY_VALUE;
         LowerBuffer[Bars-i]=EMPTY_VALUE;
        }
//----
   int limit=Bars-counted_bars;
   if(counted_bars>0) limit++;
   for(i=0; i<limit; i++)
      MovingBuffer[i]=iMA(NULL,0,BandsPeriod,BandsShift,MODE_SMA,PRICE_CLOSE,i);
//----
   i=Bars-BandsPeriod+1;
   if(counted_bars>BandsPeriod-1) i=Bars-counted_bars-1;
   while(i>=0)
     {
      sum=0.0;
      k=i+BandsPeriod-1;
      oldval=MovingBuffer[i];
      while(k>=i)
        {
         newres=Close[k]-oldval;
         sum+=newres*newres;
         k--;
        }
      deviation=BandsDeviations*MathSqrt(sum/BandsPeriod);
      UpperBuffer[i]=oldval+deviation;
      LowerBuffer[i]=oldval-deviation;
      i--;
     }
//----
   return(0);
  }
//+------------------------------------------------------------------+
Comments