Bands_v2
Download script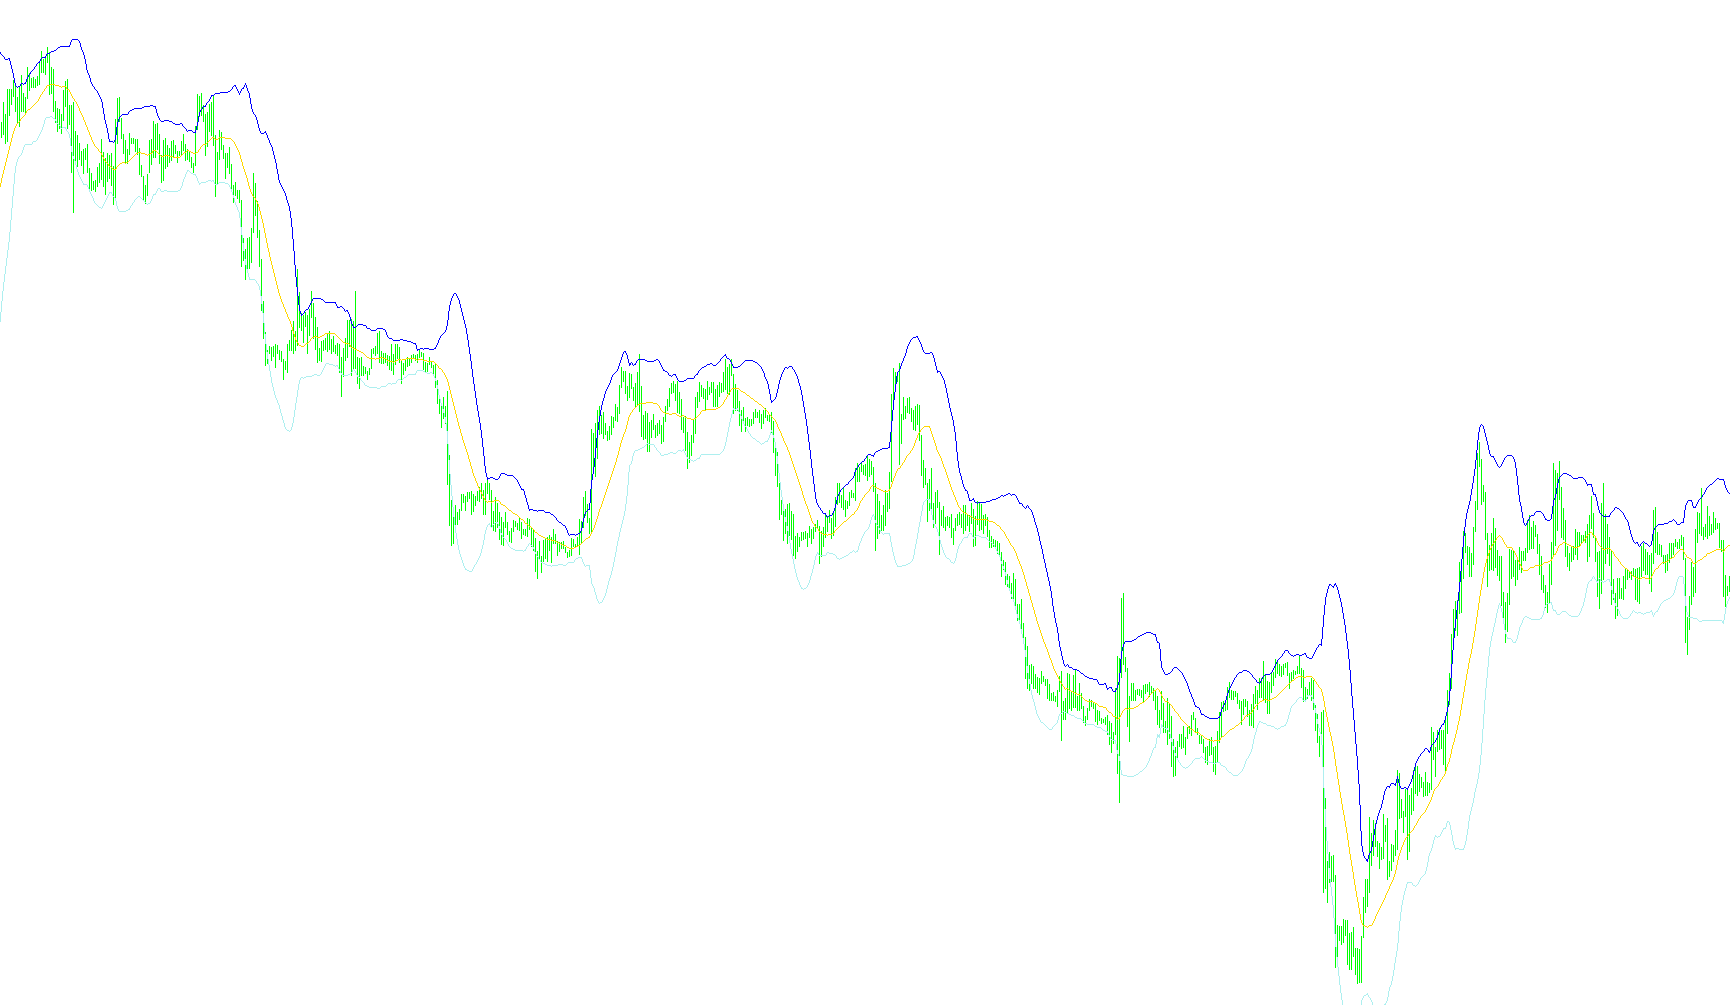
This script is a financial analysis tool designed to help traders visualize price movement trends and volatility on a trading chart. It identifies three distinct visual components: a central trend line and two outer boundaries, collectively known as "Bollinger Bands."
Core Logic Overview
The tool operates by calculating the relationship between current market prices and historical averages. Here is how it processes that data into visual information:
1. The Central Trend Line (Moving Average) The primary foundation of the indicator is a moving average. Instead of looking at a single price point, the script looks back at a specific number of previous candles (the "Period"). It calculates the average closing price over this timeframe to determine the general direction of the market. This serves as the "baseline" for the tool.
2. Measuring Volatility (Standard Deviation) To understand how much the price is "swinging" or fluctuating, the script performs a mathematical calculation based on the difference between the actual closing prices and the central trend line. It squares these differences to ensure all values are positive, averages them, and then takes the square root. This result represents the standard deviation—essentially a measurement of how erratic or calm the market is currently behaving.
3. Establishing the Boundaries Finally, the script uses the "Deviation" setting to multiply that volatility measure. It then adds this figure to the central trend line to create an Upper Band and subtracts it to create a Lower Band.
How a User Interprets the Results
By plotting these three lines simultaneously, the tool provides a visual "envelope" for the price:
- The Center Line: Represents the "fair value" or average price of the asset over the chosen period.
- The Outer Bands: Represent the expected range of price movement. When the price stays within these bands, it is considered to be behaving normally relative to its recent history.
- Market Extremes: If the price pushes outside of these bands, it suggests that the market is experiencing unusually high volatility or a significant price move that deviates from the norm, which traders often use to identify potential overbought or oversold conditions.
//+------------------------------------------------------------------+
//|                                                        Bands.mq4 |
//|                      Copyright © 2005, MetaQuotes Software Corp. |
//|                                       http://www.metaquotes.net/ |
//+------------------------------------------------------------------+
#property copyright "Copyright © 2005, MetaQuotes Software Corp."
#property link      "http://www.metaquotes.net/"

#property indicator_chart_window
#property indicator_buffers 3
#property indicator_color1 LightSeaGreen
#property indicator_color2 LightSeaGreen
#property indicator_color3 LightSeaGreen
//---- indicator parameters
extern int    BandsPeriod=20;
extern int    BandsShift=0;
extern double BandsDeviations=2.0;
//---- buffers
double MovingBuffer[];
double UpperBuffer[];
double LowerBuffer[];
//+------------------------------------------------------------------+
//| Custom indicator initialization function                         |
//+------------------------------------------------------------------+
int init()
  {
//---- indicators
   SetIndexStyle(0,DRAW_LINE);
   SetIndexBuffer(0,MovingBuffer);
   SetIndexStyle(1,DRAW_LINE);
   SetIndexBuffer(1,UpperBuffer);
   SetIndexStyle(2,DRAW_LINE);
   SetIndexBuffer(2,LowerBuffer);
//----
   SetIndexDrawBegin(0,BandsPeriod+BandsShift);
   SetIndexDrawBegin(1,BandsPeriod+BandsShift);
   SetIndexDrawBegin(2,BandsPeriod+BandsShift);
//----
   return(0);
  }
//+------------------------------------------------------------------+
//| Bollinger Bands                                                  |
//+------------------------------------------------------------------+
int start()
  {
   int    i,k,counted_bars=IndicatorCounted();
   double deviation;
   double sum,oldval,newres;
//----
   if(Bars<=BandsPeriod) return(0);
//---- initial zero
   if(counted_bars<1)
      for(i=1;i<=BandsPeriod;i++)
        {
         MovingBuffer[Bars-i]=EMPTY_VALUE;
         UpperBuffer[Bars-i]=EMPTY_VALUE;
         LowerBuffer[Bars-i]=EMPTY_VALUE;
        }
//----
   int limit=Bars-counted_bars;
   if(counted_bars>0) limit++;
   for(i=0; i<limit; i++)
      MovingBuffer[i]=iMA(NULL,0,BandsPeriod,BandsShift,MODE_SMA,PRICE_CLOSE,i);
//----
   i=Bars-BandsPeriod+1;
   if(counted_bars>BandsPeriod-1) i=Bars-counted_bars-1;
   while(i>=0)
     {
      sum=0.0;
      k=i+BandsPeriod-1;
      oldval=MovingBuffer[i];
      while(k>=i)
        {
         newres=Close[k]-oldval;
         sum+=newres*newres;
         k--;
        }
      deviation=BandsDeviations*MathSqrt(sum/BandsPeriod);;
      UpperBuffer[i]=oldval+deviation;
      LowerBuffer[i]=oldval-deviation;
      i--;
     }
//----
   return(0);
  }
//+------------------------------------------------------------------+
Comments