Bollinger Bands_v2
Download script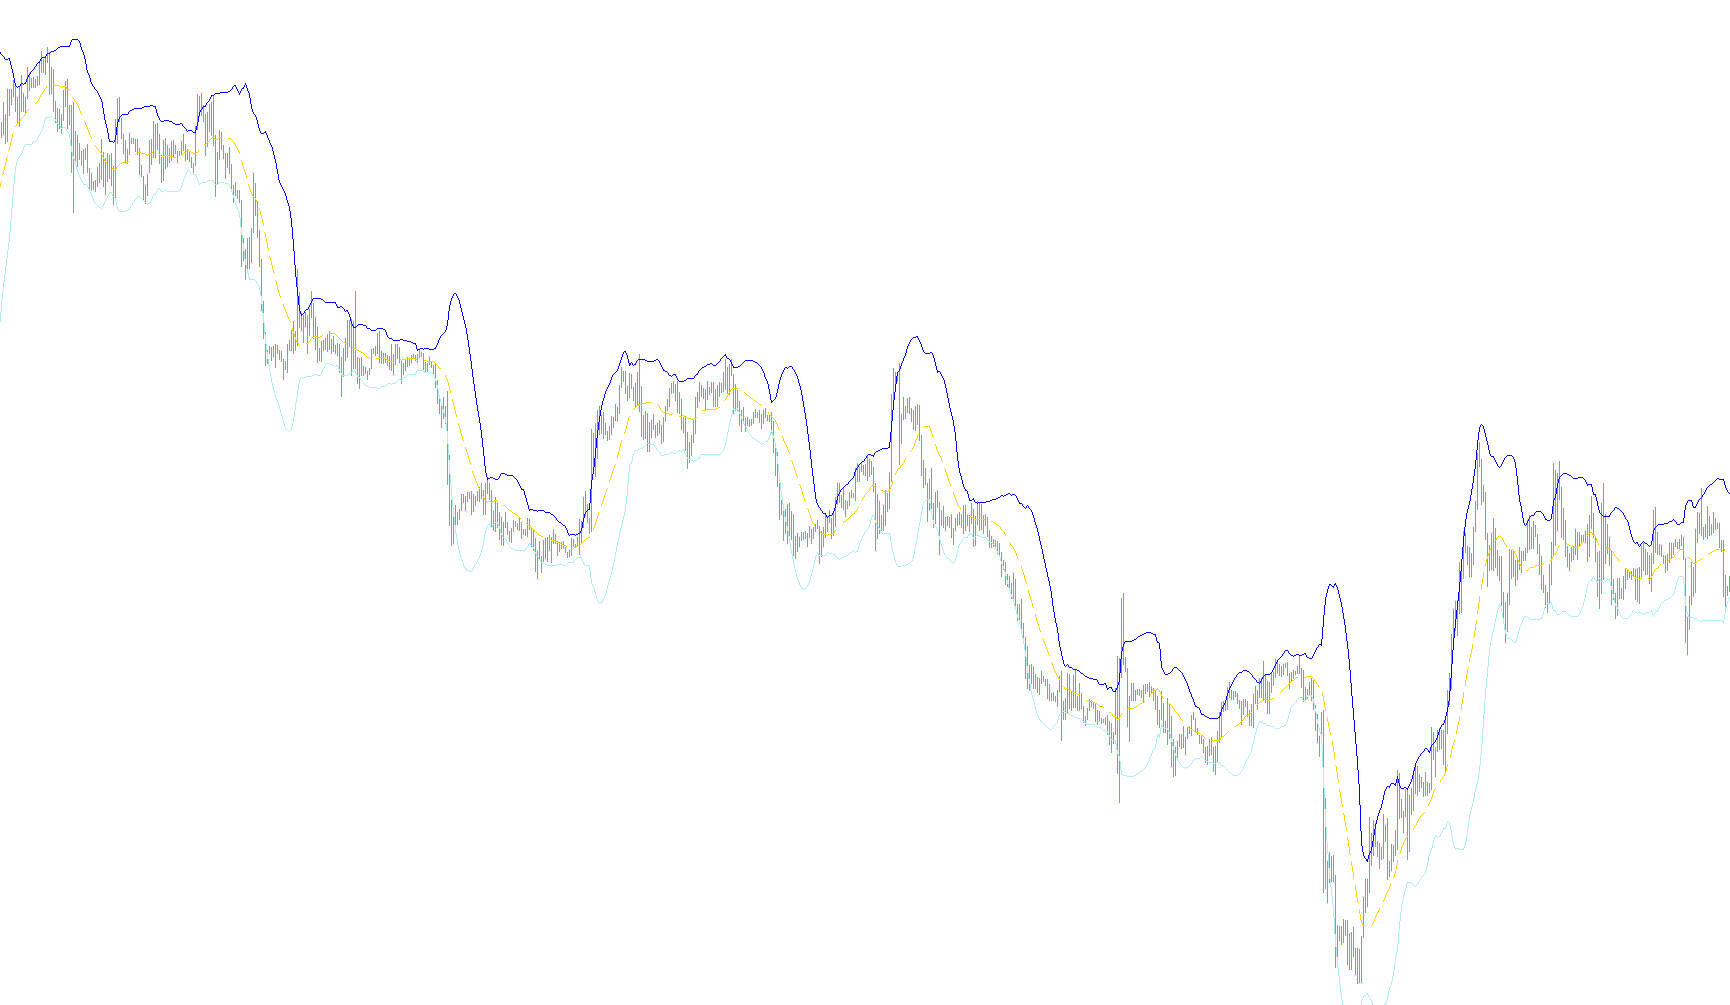
This script is designed to generate a visual technical analysis tool known as Bollinger Bands on your trading charts. It helps traders identify price trends and measure market volatility by creating three distinct lines that react to price movements in real-time.
How the Logic Works
The core logic of this tool functions in three primary stages:
1. Establishing the Baseline (The Moving Average) First, the script looks back at a specific number of previous price points (defined by the "Period" setting) to calculate an average price. This creates a smooth middle line on your chart. By using this average instead of just the raw current price, the tool helps filter out minor market "noise" so you can see the broader trend more clearly.
2. Measuring Volatility (Standard Deviation) Once the middle line is established, the script analyzes how much the actual market prices have fluctuated away from that average over the same period. It calculates the "spread" of these price movements. If the market is calm, the spread is small; if the market is volatile and swinging wildly, the spread becomes larger.
3. Drawing the Boundaries (Upper and Lower Bands) Finally, the script uses that volatility measurement to project two outer boundaries—the Upper and Lower Bands—around the middle line.
- The Upper Band is set at a specific distance above the average based on your chosen "Deviation" setting.
- The Lower Band is set at that same distance below the average.
What this means for your trading
As the market price moves, these bands expand and contract automatically. When the price moves significantly far from the middle line toward one of the outer bands, it often suggests that the market is overextended in that direction. Conversely, when the bands are narrow, it indicates a period of low volatility. This provides a visual map of where the price currently sits in relation to its recent historical behavior.
/*-----------------------------+
|			       |
| Shared by www.Aptrafx.com    |
|			       |
+------------------------------*/

//+------------------------------------------------------------------+
//|                                                        Bands.mq4 |
//|                      Copyright © 2005, MetaQuotes Software Corp. |
//|                                       http://www.metaquotes.net/ |
//+------------------------------------------------------------------+
#property copyright "Copyright © 2005, MetaQuotes Software Corp."
#property link      "http://www.metaquotes.net/"

#property indicator_chart_window
#property indicator_buffers 3
#property indicator_color1 White
#property indicator_color2 White
#property indicator_color3 White
//---- indicator parameters
extern int    BandsPeriod=20;
extern int    BandsShift=0;
extern double BandsDeviations=2.0;
//---- buffers
double MovingBuffer[];
double UpperBuffer[];
double LowerBuffer[];
//+------------------------------------------------------------------+
//| Custom indicator initialization function                         |
//+------------------------------------------------------------------+
int init()
  {
//---- indicators
   SetIndexStyle(0,DRAW_LINE,1);
   SetIndexBuffer(0,MovingBuffer);
   SetIndexStyle(1,DRAW_LINE);
   SetIndexBuffer(1,UpperBuffer);
   SetIndexStyle(2,DRAW_LINE);
   SetIndexBuffer(2,LowerBuffer);
//----
   SetIndexDrawBegin(0,BandsPeriod+BandsShift);
   SetIndexDrawBegin(1,BandsPeriod+BandsShift);
   SetIndexDrawBegin(2,BandsPeriod+BandsShift);
//----
   return(0);
  }
//+------------------------------------------------------------------+
//| Bollinger Bands                                                  |
//+------------------------------------------------------------------+
int start()
  {
   int    i,k,counted_bars=IndicatorCounted();
   double deviation;
   double sum,oldval,newres;
//----
   if(Bars<=BandsPeriod) return(0);
//---- initial zero
   if(counted_bars<1)
      for(i=1;i<=BandsPeriod;i++)
        {
         MovingBuffer[Bars-i]=EMPTY_VALUE;
         UpperBuffer[Bars-i]=EMPTY_VALUE;
         LowerBuffer[Bars-i]=EMPTY_VALUE;
        }
//----
   int limit=Bars-counted_bars;
   if(counted_bars>0) limit++;
   for(i=0; i<limit; i++)
      MovingBuffer[i]=iMA(NULL,0,BandsPeriod,BandsShift,MODE_SMA,PRICE_CLOSE,i);
//----
   i=Bars-BandsPeriod+1;
   if(counted_bars>BandsPeriod-1) i=Bars-counted_bars-1;
   while(i>=0)
     {
      sum=0.0;
      k=i+BandsPeriod-1;
      oldval=MovingBuffer[i];
      while(k>=i)
        {
         newres=Close[k]-oldval;
         sum+=newres*newres;
         k--;
        }
      deviation=BandsDeviations*MathSqrt(sum/BandsPeriod);
      UpperBuffer[i]=oldval+deviation;
      LowerBuffer[i]=oldval-deviation;
      i--;
     }
//----
   return(0);
  }
//+------------------------------------------------------------------+
Comments