Bollinger Bands_v1
Download script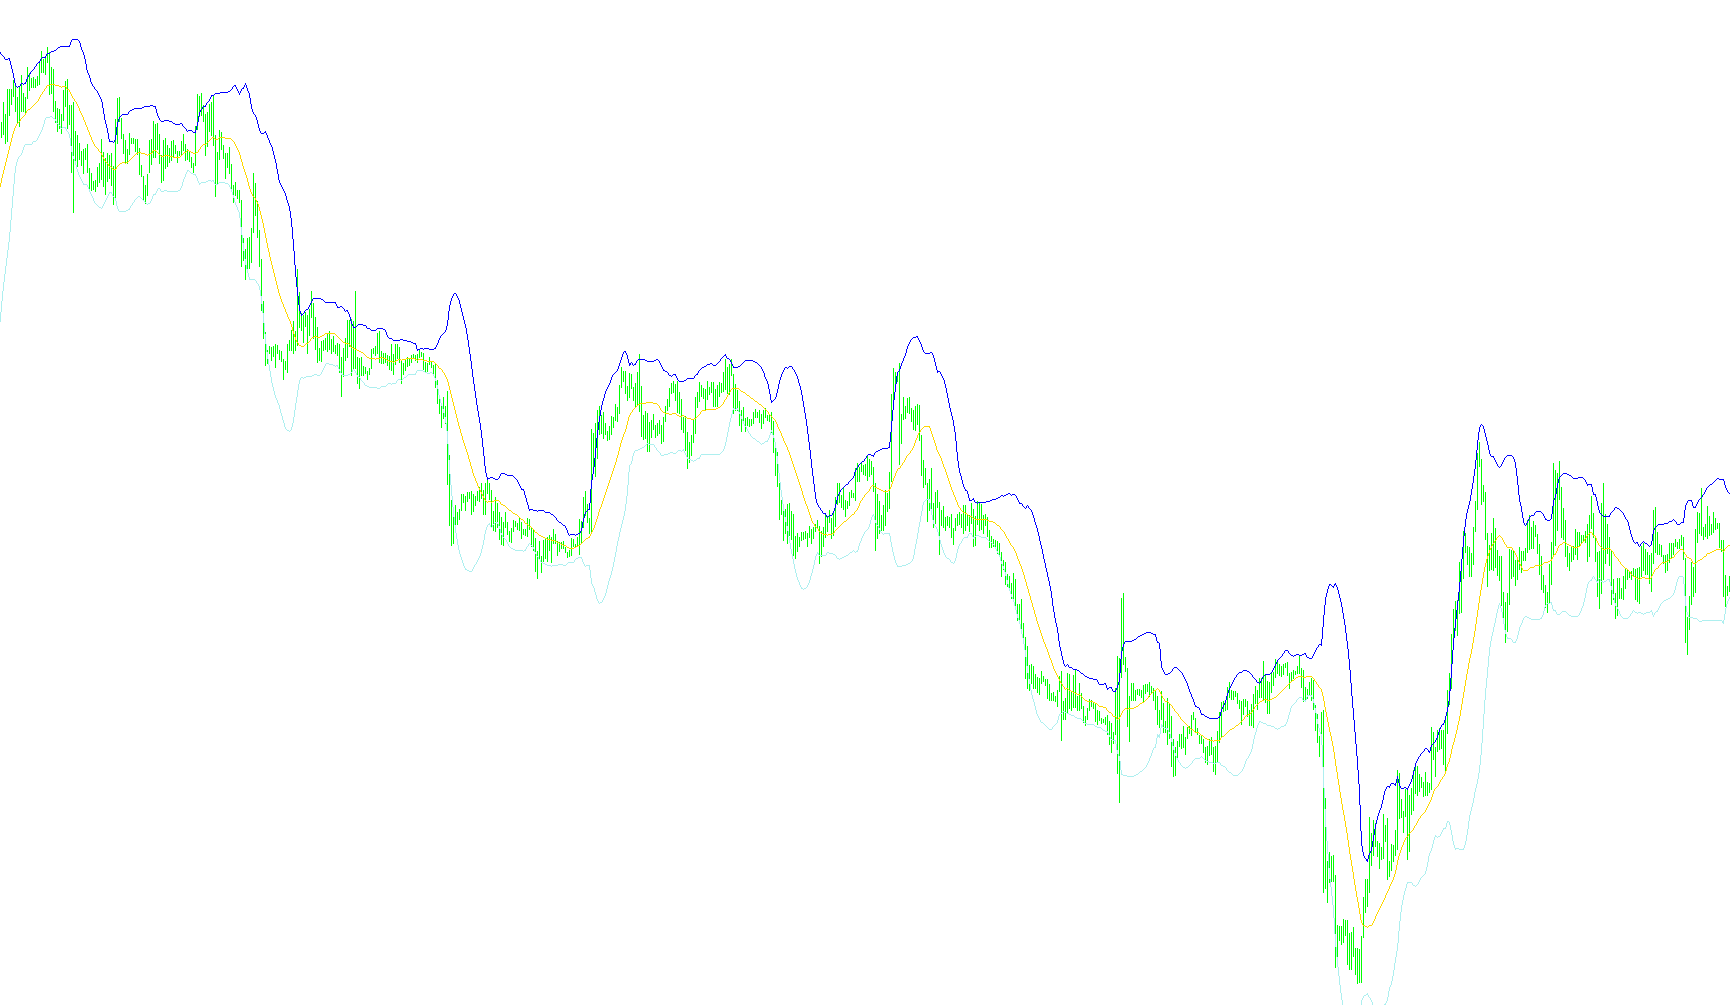
This script is designed to function as a visual financial analysis tool, specifically creating a set of three moving lines on your trading chart. These lines help traders visualize market trends and identify potential price extremes by calculating volatility in real-time.
Core Functionality
The primary purpose of this logic is to create Bollinger Bands. Instead of just showing you the current price, it provides a "corridor" that fluctuates based on how much the price moves over a specific period. It consists of three distinct components:
- The Center Line (Moving Average): This acts as the baseline for the asset's current trend. It calculates the average closing price over a user-defined number of past data points.
- The Upper Band: This represents an upper threshold. It is calculated by taking the center line and adding a specific amount of "deviation" to it.
- The Lower Band: This represents a lower threshold, calculated by subtracting that same amount of deviation from the center line.
How the Logic Works
The script processes your price data using a three-step mathematical sequence:
- Trend Identification: First, the script looks at a set period (for example, the last 20 candles) to calculate a simple average. This tells the tool where the "middle" of the current price action is located.
- Volatility Measurement: The script then measures how much the actual closing prices have drifted away from that middle average. It looks at the difference between each individual price and the average, squares those differences to ensure they are all positive numbers, and then calculates a standard deviation.
- Band Construction: Finally, it takes that volatility measurement and multiplies it by a "Deviation" factor (set by the user). It then adds this value to the top of the center line to create the Upper Band and subtracts it from the bottom to create the Lower Band.
Practical Application
By plotting these three lines together, the script creates a visual channel. When the price stays within the bands, it suggests the market is moving within its normal range. When the price touches or breaks outside of the upper or lower bands, it signals to the user that the asset may be experiencing unusual activity—either an overbought condition (at the top) or an oversold condition (at the bottom).
Users can customize the sensitivity of this tool by adjusting three main settings:
- Period: How far back into history the script looks to calculate averages.
- Shift: Whether to move the lines forward or backward on the chart.
- Deviations: How wide or narrow the "corridor" should be based on market volatility.
//+------------------------------------------------------------------+
//|                                                        Bands.mq4 |
//|                      Copyright © 2005, MetaQuotes Software Corp. |
//|                                       http://www.metaquotes.net/ |
//+------------------------------------------------------------------+
#property copyright "Copyright © 2005, MetaQuotes Software Corp."
#property link      "http://www.metaquotes.net/"

#property indicator_chart_window
#property indicator_buffers 3
#property indicator_color1 Coral
#property indicator_color2 DimGray
#property indicator_color3 DimGray
//---- indicator parameters
extern int    BandsPeriod=20;
extern int    BandsShift=0;
extern double BandsDeviations=2.0;
//---- buffers
double MovingBuffer[];
double UpperBuffer[];
double LowerBuffer[];
//+------------------------------------------------------------------+
//| Custom indicator initialization function                         |
//+------------------------------------------------------------------+
int init()
  {
//---- indicators
   SetIndexStyle(0,DRAW_LINE);
   SetIndexBuffer(0,MovingBuffer);
   SetIndexStyle(1,DRAW_LINE);
   SetIndexBuffer(1,UpperBuffer);
   SetIndexStyle(2,DRAW_LINE);
   SetIndexBuffer(2,LowerBuffer);
//----
   SetIndexDrawBegin(0,BandsPeriod+BandsShift);
   SetIndexDrawBegin(1,BandsPeriod+BandsShift);
   SetIndexDrawBegin(2,BandsPeriod+BandsShift);
//----
   return(0);
  }
//+------------------------------------------------------------------+
//| Bollinger Bands                                                  |
//+------------------------------------------------------------------+
int start()
  {
   int    i,k,counted_bars=IndicatorCounted();
   double deviation;
   double sum,oldval,newres;
//----
   if(Bars<=BandsPeriod) return(0);
//---- initial zero
   if(counted_bars<1)
      for(i=1;i<=BandsPeriod;i++)
        {
         MovingBuffer[Bars-i]=EMPTY_VALUE;
         UpperBuffer[Bars-i]=EMPTY_VALUE;
         LowerBuffer[Bars-i]=EMPTY_VALUE;
        }
//----
   int limit=Bars-counted_bars;
   if(counted_bars>0) limit++;
   for(i=0; i<limit; i++)
      MovingBuffer[i]=iMA(NULL,0,BandsPeriod,BandsShift,MODE_SMA,PRICE_CLOSE,i);
//----
   i=Bars-BandsPeriod+1;
   if(counted_bars>BandsPeriod-1) i=Bars-counted_bars-1;
   while(i>=0)
     {
      sum=0.0;
      k=i+BandsPeriod-1;
      oldval=MovingBuffer[i];
      while(k>=i)
        {
         newres=Close[k]-oldval;
         sum+=newres*newres;
         k--;
        }
      deviation=BandsDeviations*MathSqrt(sum/BandsPeriod);
      UpperBuffer[i]=oldval+deviation;
      LowerBuffer[i]=oldval-deviation;
      i--;
     }
//----
   return(0);
  }
//+------------------------------------------------------------------+
Comments