MiBollingerBand
Download script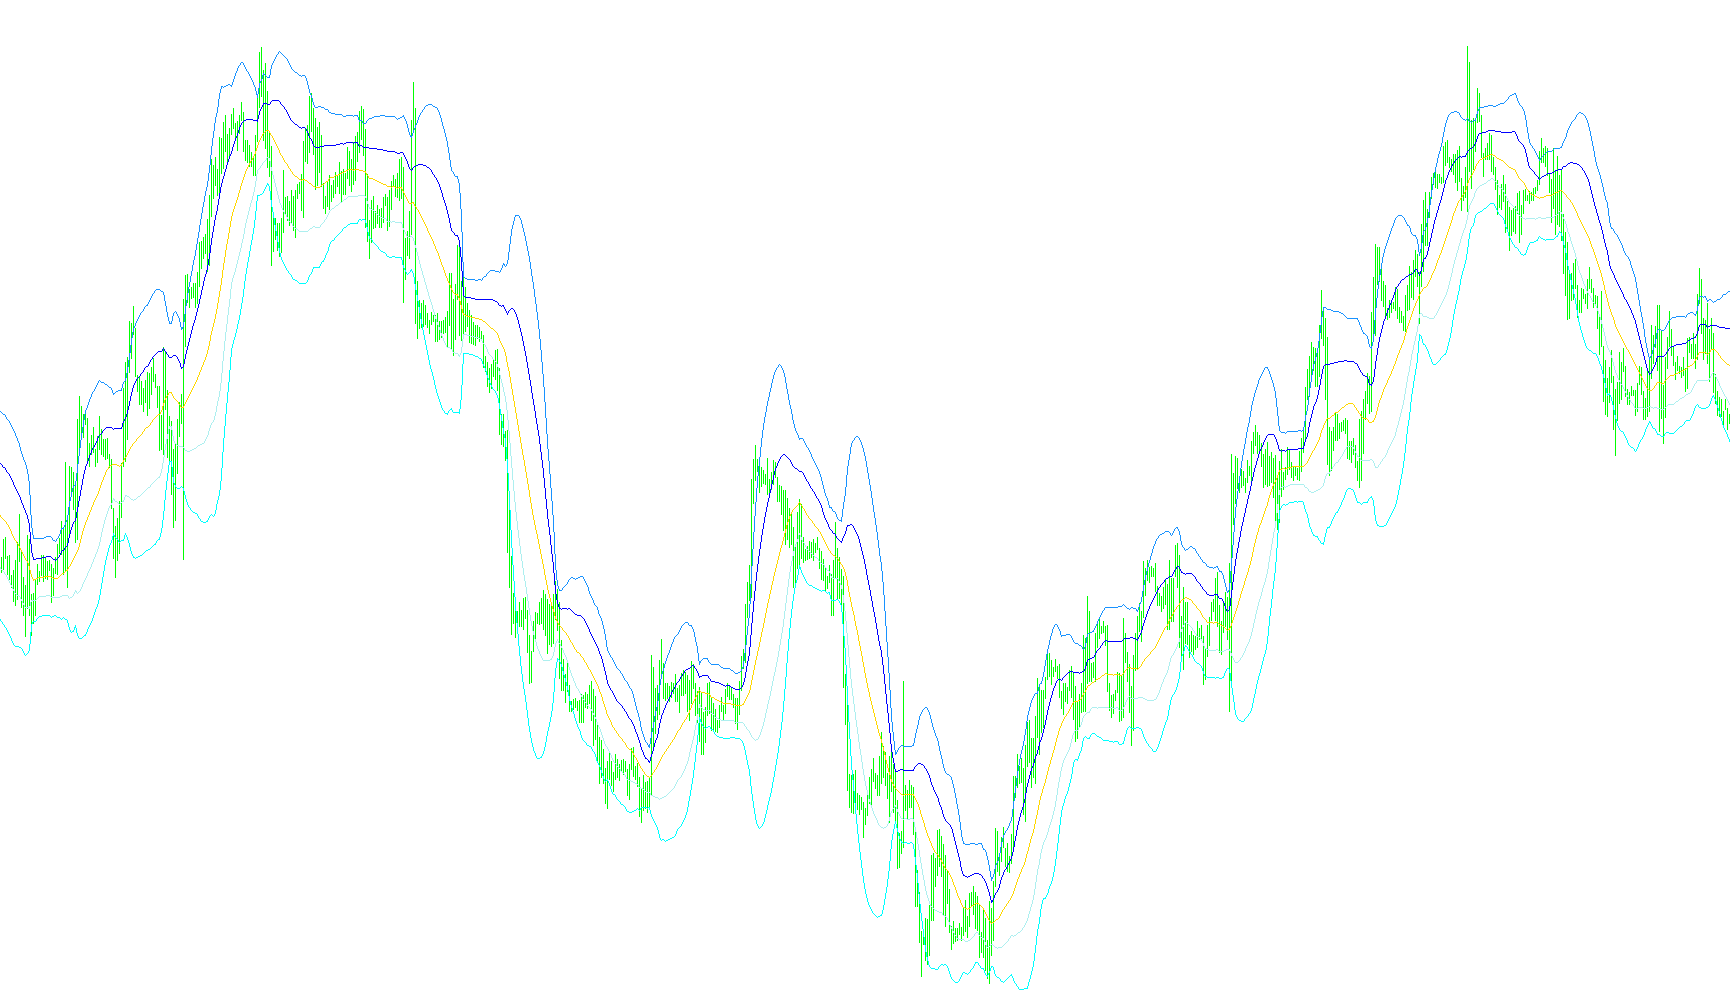
This script is a specialized technical analysis tool designed to help traders visualize price momentum and volatility on a trading chart. It functions by creating a series of dynamic boundaries around the current market price, providing a visual map of where the price typically fluctuates and identifying potential areas of overextension.
Core Logic and Functionality
The tool operates based on three primary mathematical layers:
1. The Baseline (Moving Average) At its core, the script calculates a "Moving Average." Instead of looking at just one single price point, it looks back at a specific number of past candles (the "Period") to determine the average closing price. This acts as the central equilibrium line, smoothing out minor market "noise" to show you the overall trend of the asset.
2. Standard Deviation and Volatility The script then measures how much the price is currently swinging away from that central average. By calculating the mathematical difference between the current prices and the average over time, it determines the "volatility." In simple terms, it asks: "Is the price moving normally, or is it making an unusually large jump?"
3. The Multi-Layered Bands The script uses these volatility measurements to project four distinct boundary lines above and below the central moving average:
- Inner Bands: These are calculated using a tighter measurement of deviation. They represent the "normal" range of price movement. When the price stays within these bands, it suggests the market is behaving predictably.
- Outer Bands: These use a wider measurement of deviation. They represent extreme price movements. When the price pushes toward or beyond these outer lines, it often signals that the market is becoming overextended (either overbought or oversold), which may indicate a potential reversal or a period of high instability.
How to Interpret the Visuals
By displaying these five lines simultaneously, the script provides a comprehensive "channel" for the price:
- The Center Line shows you the current trend direction.
- The Inner Boundaries show you the standard operating zone of the asset.
- The Outer Boundaries act as warning zones, highlighting moments where price action is reaching extreme limits relative to its recent history.
Essentially, this tool transforms complex historical price data into a visual corridor, allowing traders to see at a glance whether the current market price is behaving normally or if it is reaching an extreme point that might require caution.
//+------------------------------------------------------------------+
//|                                              MiBollingerBand.mq4 |
//|                      Copyright © 2010, MetaQuotes Software Corp. |
//|                                        http://www.metaquotes.net |
//+------------------------------------------------------------------+
#property copyright "Copyright © 2010, MetaQuotes Software Corp."
#property link      "http://www.metaquotes.net"

#property indicator_chart_window
#property indicator_buffers 5
#property indicator_color1 LightSeaGreen
#property indicator_color2 LightSeaGreen
#property indicator_color3 LightSeaGreen
#property indicator_color4 LightSeaGreen
#property indicator_color5 LightSeaGreen

//---- indicator parameters
int    BandsPeriod=25;
int    BandsShift=0;
double BandsDeviations=1.0;
double BandsDeviation =2.0;

//---- buffers
double MovingBuffer[];
double UpperBuffer[];
double UupperBuffer[];
double LowerBuffer[];
double LlowerBuffer[];
//+------------------------------------------------------------------+
//| Custom indicator initialization function                         |
//+------------------------------------------------------------------+
int init()
  {
//---- indicators
   SetIndexStyle(0,DRAW_LINE);
   SetIndexBuffer(0,MovingBuffer);
   SetIndexStyle(1,DRAW_LINE);
   SetIndexBuffer(1,UpperBuffer);
   SetIndexStyle(2,DRAW_LINE);
   SetIndexBuffer(2,LowerBuffer);
   SetIndexStyle(3,DRAW_LINE);
   SetIndexBuffer(3,UupperBuffer);
   SetIndexStyle(4,DRAW_LINE);
   SetIndexBuffer(4,LlowerBuffer);
//----
   SetIndexDrawBegin(0,BandsPeriod+BandsShift);
   SetIndexDrawBegin(1,BandsPeriod+BandsShift);
   SetIndexDrawBegin(2,BandsPeriod+BandsShift);
//----
   return(0);
  }
//+------------------------------------------------------------------+
//| Bollinger Bands                                                  |
//+------------------------------------------------------------------+
int start()
  {
   int    i,k,counted_bars=IndicatorCounted();
   double deviation;
   double deviations;
   double sum,oldval,newres;
//----
   if(Bars<=BandsPeriod) return(0);
//---- initial zero
   if(counted_bars<1)
      for(i=1;i<=BandsPeriod;i++)
        {
         MovingBuffer[Bars-i]=EMPTY_VALUE;
         UpperBuffer[Bars-i]=EMPTY_VALUE;
         UupperBuffer[Bars-i]=EMPTY_VALUE;
         LowerBuffer[Bars-i]=EMPTY_VALUE;
         LlowerBuffer[Bars-i]=EMPTY_VALUE;
        }
//----
   int limit=Bars-counted_bars;
   if(counted_bars>0) limit++;
   for(i=0; i<limit; i++)
      MovingBuffer[i]=iMA(NULL,0,BandsPeriod,BandsShift,MODE_SMA,PRICE_CLOSE,i);
//----
   i=Bars-BandsPeriod+1;
   if(counted_bars>BandsPeriod-1) i=Bars-counted_bars-1;
   while(i>=0)
     {
      sum=0.0;
      k=i+BandsPeriod-1;
      oldval=MovingBuffer[i];
      while(k>=i)
        {
         newres=Close[k]-oldval;
         sum+=newres*newres;
         k--;
        }
      deviation=BandsDeviations*MathSqrt(sum/BandsPeriod);
      deviations=BandsDeviation*MathSqrt(sum/BandsPeriod);
      UpperBuffer[i]=oldval+deviation;
      UupperBuffer[i]=oldval+deviations;
      LowerBuffer[i]=oldval-deviation;
      LlowerBuffer[i]=oldval-deviations;
      i--;
     }
//----
   return(0);
  }
//+------------------------------------------------------------------+
Comments