Bollinger Bands
Download script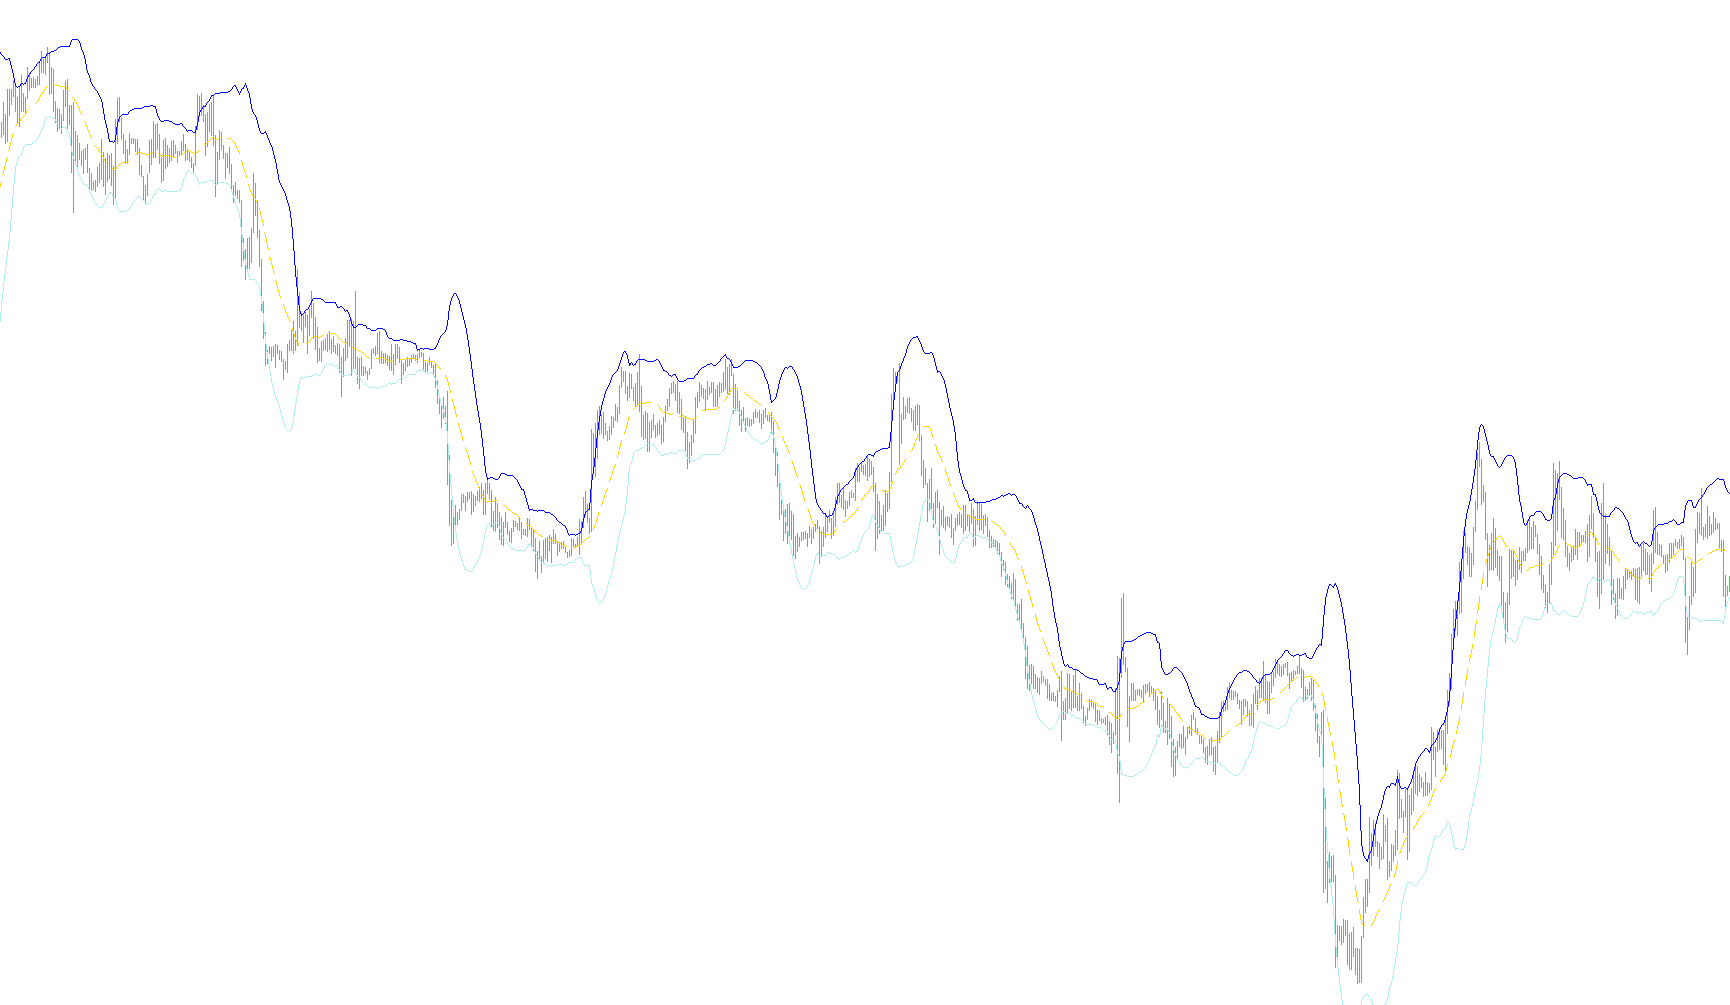
This script is designed to create a visual technical analysis tool on your trading charts known as Bollinger Bands. It provides a way to visualize market volatility and identify potential price extremes by plotting three distinct lines based on historical price data.
Core Functionality
The logic operates by analyzing the closing prices of an asset over a specific window of time (the "Period"). It calculates three primary components:
- The Mid-Line: The script first calculates a Simple Moving Average (SMA). This acts as the baseline, representing the average price of the asset over the chosen timeframe. It helps smooth out short-term fluctuations to reveal the underlying trend.
- The Deviation Calculation: To determine how far the price is straying from that average, the script measures the "variance." It looks at the difference between the current price and the moving average for every bar in the period, squares those differences, and calculates an average of those results. This identifies how much the market is "swinging" at any given moment.
- The Upper and Lower Bands: Finally, the script takes that deviation value and multiplies it by a user-defined factor (the "Deviation"). It then adds this value to the Mid-Line to create the Upper Band and subtracts it to create the Lower Band.
Visual Behavior
On your chart, these three lines move in tandem:
- When volatility is low, the bands contract toward each other, creating a narrower channel.
- When volatility is high, the bands expand outward, widening the channel.
By observing where the price sits in relation to these bands, traders can visually assess whether an asset is overextended (hitting the outer boundaries) or trading within a normal range of its average value.
Indicators Used
Miscellaneous
17
Views
0
Downloads
0
Favorites
Bollinger Bands
//+------------------------------------------------------------------+
//|                                                        Bands.mq4 |
//|                      Copyright © 2005, MetaQuotes Software Corp. |
//|                                       http://www.metaquotes.net/ |
//+------------------------------------------------------------------+
#property copyright "Copyright © 2005, MetaQuotes Software Corp."
#property link      "http://www.metaquotes.net/"

#property indicator_chart_window
#property indicator_buffers 3
#property indicator_color1 White
#property indicator_color2 White
#property indicator_color3 White
//---- indicator parameters
extern int    BandsPeriod=20;
extern int    BandsShift=0;
extern double BandsDeviations=2.0;
//---- buffers
double MovingBuffer[];
double UpperBuffer[];
double LowerBuffer[];
//+------------------------------------------------------------------+
//| Custom indicator initialization function                         |
//+------------------------------------------------------------------+
int init()
  {
//---- indicators
   SetIndexStyle(0,DRAW_LINE,1);
   SetIndexBuffer(0,MovingBuffer);
   SetIndexStyle(1,DRAW_LINE);
   SetIndexBuffer(1,UpperBuffer);
   SetIndexStyle(2,DRAW_LINE);
   SetIndexBuffer(2,LowerBuffer);
//----
   SetIndexDrawBegin(0,BandsPeriod+BandsShift);
   SetIndexDrawBegin(1,BandsPeriod+BandsShift);
   SetIndexDrawBegin(2,BandsPeriod+BandsShift);
//----
   return(0);
  }
//+------------------------------------------------------------------+
//| Bollinger Bands                                                  |
//+------------------------------------------------------------------+
int start()
  {
   int    i,k,counted_bars=IndicatorCounted();
   double deviation;
   double sum,oldval,newres;
//----
   if(Bars<=BandsPeriod) return(0);
//---- initial zero
   if(counted_bars<1)
      for(i=1;i<=BandsPeriod;i++)
        {
         MovingBuffer[Bars-i]=EMPTY_VALUE;
         UpperBuffer[Bars-i]=EMPTY_VALUE;
         LowerBuffer[Bars-i]=EMPTY_VALUE;
        }
//----
   int limit=Bars-counted_bars;
   if(counted_bars>0) limit++;
   for(i=0; i<limit; i++)
      MovingBuffer[i]=iMA(NULL,0,BandsPeriod,BandsShift,MODE_SMA,PRICE_CLOSE,i);
//----
   i=Bars-BandsPeriod+1;
   if(counted_bars>BandsPeriod-1) i=Bars-counted_bars-1;
   while(i>=0)
     {
      sum=0.0;
      k=i+BandsPeriod-1;
      oldval=MovingBuffer[i];
      while(k>=i)
        {
         newres=Close[k]-oldval;
         sum+=newres*newres;
         k--;
        }
      deviation=BandsDeviations*MathSqrt(sum/BandsPeriod);
      UpperBuffer[i]=oldval+deviation;
      LowerBuffer[i]=oldval-deviation;
      i--;
     }
//----
   return(0);
  }
//+------------------------------------------------------------------+
Comments