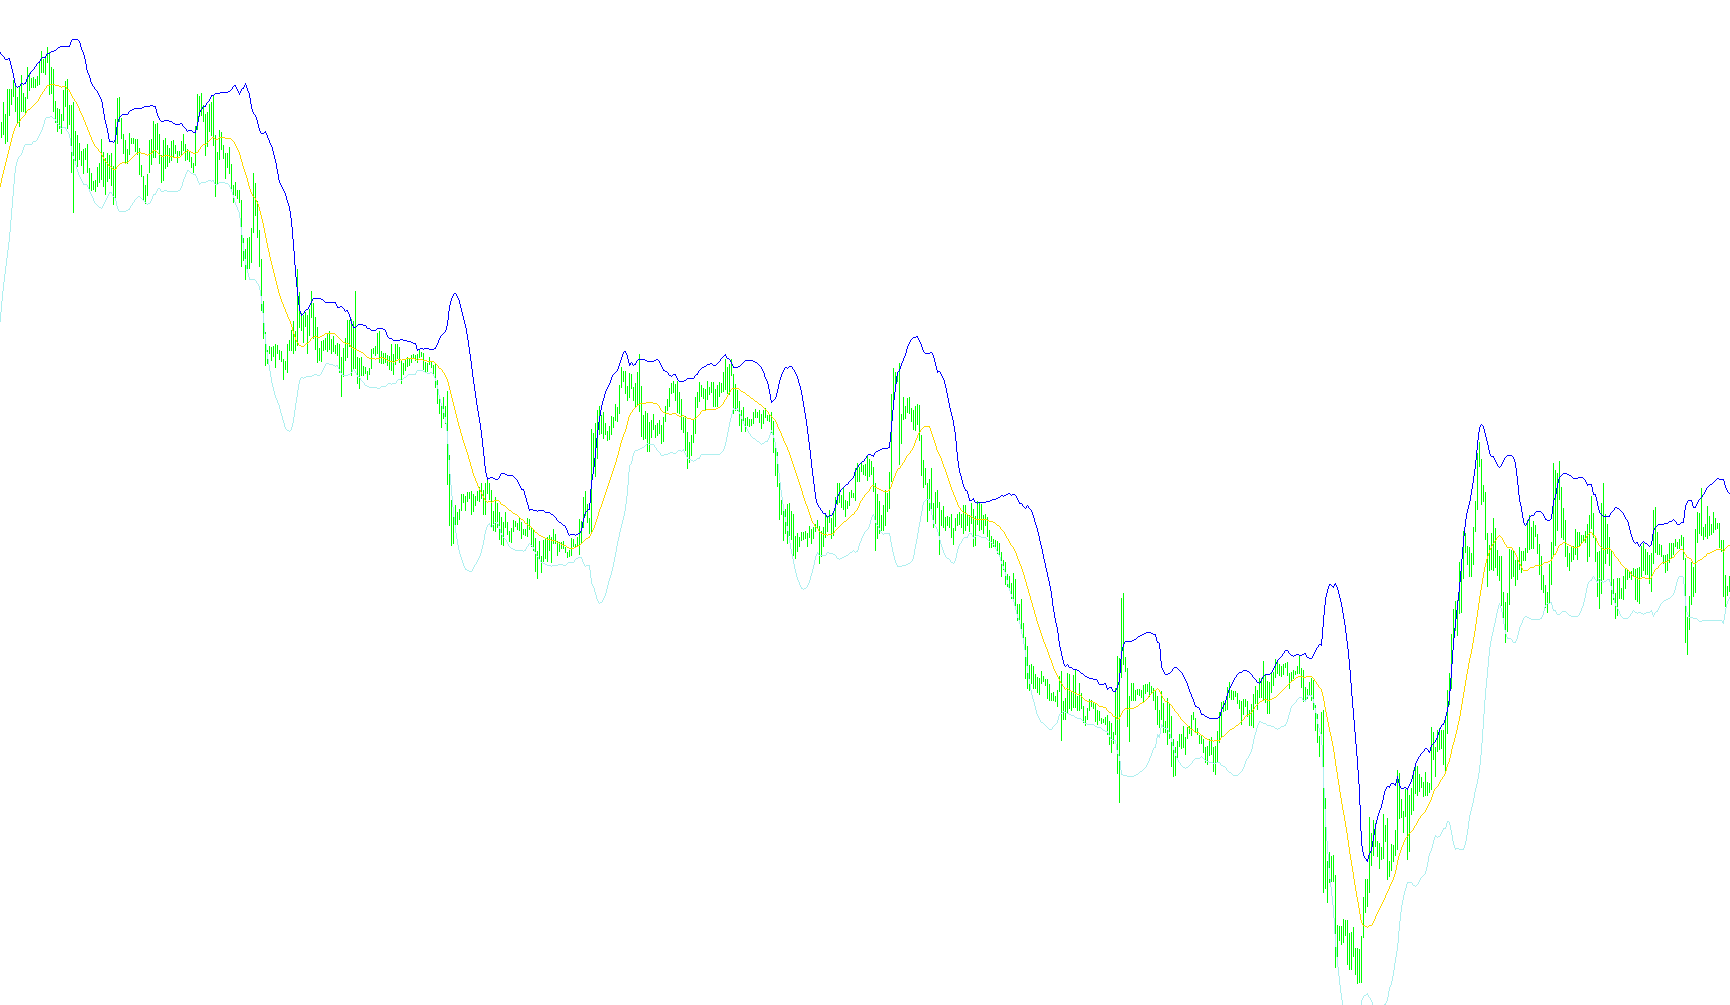
This script is a customized technical analysis tool designed for the MetaTrader trading platform. Its primary purpose is to calculate and display dynamic "Bands" on a price chart, which help traders visualize price trends, volatility, and potential overextended market conditions.
Core Functionality
The indicator works by creating three distinct lines on your chart: a central moving average (the midline) and two outer boundary lines (the upper and lower bands). The logic follows a two-step process:
1. Calculating the Base Movement (The Midline) First, the script determines the "heart" of the price action by calculating a Moving Average. Unlike standard tools that only offer one type of average, this specific version is highly versatile. It allows users to choose from several different mathematical methods to smooth out price data:
- Simple (SMA), Exponential (EMA), Smoothed (SMMA), or Linear Weighted (LWMA) averages.
- Least Squares Moving Average (LSMA): A specialized calculation that projects the trend line based on linear regression.
Additionally, it allows for "Applied Price" customization. This means you can choose whether the average is calculated based on the closing price, the opening price, the highs, the lows, or a combination of these values (such as the Median or Typical price).
2. Calculating Volatility (The Upper and Lower Bands) Once the central midline is established, the script calculates the "deviation" to create the outer bands. It looks at the variance between the current price and the midline over a specific period of time:
- Standard Deviation: The script measures how much the price fluctuates away from the average.
- Upper Band: Created by adding the deviation value to the midline.
- Lower Band: Created by subtracting the deviation value from the midline.
Key Features for the User
- Customizable Sensitivity: Users can adjust the "Bands Period" to make the indicator react faster or slower to market changes, and "Bands Deviations" to widen or narrow the boundaries.
- Visual Options: The script includes a toggle to hide or show the midline, allowing traders to focus solely on the outer bands or the full range.
- Dynamic Updates: The logic automatically updates with every new price tick, ensuring that the bands expand during high-volatility periods and contract during stable markets.
In summary, this tool serves as a visual guide for market momentum. By observing where the price sits in relation to these bands, traders can identify whether a market is trending strongly or if it has moved significantly far from its average, potentially signaling a reversal or a period of consolidation.
//+------------------------------------------------------------------+
//|                                                        Bands.mq4 |
//|                      Copyright © 2005, MetaQuotes Software Corp. |
//|                                       http://www.metaquotes.net/ |
//| Modified by Robert Hill to use any MA including LSMA             |
//|  instead of SMA                                                  |
//+------------------------------------------------------------------+
#property copyright "Copyright © 2005, MetaQuotes Software Corp."
#property link      "http://www.metaquotes.net/"

#property indicator_chart_window
#property indicator_buffers 3
#property indicator_color1 LightSeaGreen
#property indicator_color2 LightSeaGreen
#property indicator_color3 LightSeaGreen
//---- indicator parameters
extern string  m = "--Moving Average Types--";
extern string  m0 = " 0 = SMA";
extern string  m1 = " 1 = EMA";
extern string  m2 = " 2 = SMMA";
extern string  m3 = " 3 = LWMA";
extern string  m4 = " 4 = LSMA";
extern int     MA_Type=0;
extern string  p = "--Applied Price Types--";
extern string  p0 = " 0 = close";
extern string  p1 = " 1 = open";
extern string  p2 = " 2 = high";
extern string  p3 = " 3 = low";
extern string  p4 = " 4 = median(high+low)/2";
extern string  p5 = " 5 = typical(high+low+close)/3";
extern string  p6 = " 6 = weighted(high+low+close+close)/4";
extern int     MA_AppliedPrice = 0;
extern string  b = "--Bands Inputs--";
extern int     BandsPeriod=20;
extern int     BandsShift=0;
extern double  BandsDeviations=2.0;
extern bool    DisplayMidLine = true;

//---- buffers
double MovingBuffer[];
double UpperBuffer[];
double LowerBuffer[];

//---- variables

int    MA_Mode;
string strMAType;

//+------------------------------------------------------------------+
//| Custom indicator initialization function                         |
//+------------------------------------------------------------------+
int init()
  {
//---- indicators
   SetIndexStyle(0,DRAW_LINE);
   SetIndexBuffer(0,MovingBuffer);
   SetIndexStyle(1,DRAW_LINE);
   SetIndexBuffer(1,UpperBuffer);
   SetIndexStyle(2,DRAW_LINE);
   SetIndexBuffer(2,LowerBuffer);
//----
   SetIndexDrawBegin(0,BandsPeriod+BandsShift);
   SetIndexDrawBegin(1,BandsPeriod+BandsShift);
   SetIndexDrawBegin(2,BandsPeriod+BandsShift);
//----

switch (MA_Type)
   {
      case 1: strMAType="EMA"; MA_Mode=MODE_EMA; break;
      case 2: strMAType="SMMA"; MA_Mode=MODE_SMMA; break;
      case 3: strMAType="LWMA"; MA_Mode=MODE_LWMA; break;
      case 4: strMAType="LSMA"; break;
      default: strMAType="SMA"; MA_Mode=MODE_SMA; break;
   }
   IndicatorShortName( strMAType+ " (" +BandsPeriod + ") ");

   return(0);
  }

//+------------------------------------------------------------------------+
//| LSMA - Least Squares Moving Average function calculation               |
//| LSMA_In_Color Indicator plots the end of the linear regression line    |
//+------------------------------------------------------------------------+

//+------------------------------------------------------------------+
//| LSMA with PriceMode                                              |
//| PrMode  0=close, 1=open, 2=high, 3=low, 4=median(high+low)/2,    |
//| 5=typical(high+low+close)/3, 6=weighted(high+low+close+close)/4  |
//+------------------------------------------------------------------+

double LSMA(int TimeFrame, int Rperiod, int prMode, int shift)
{
   int i, myShift;
   double sum, pr;
   int length;
   double lengthvar;
   double tmp;
   double wt;

   length = Rperiod;

   sum = 0;
   for(i = length; i >= 1  ; i--)
   {
     lengthvar = length + 1;
     lengthvar /= 3;
     tmp = 0;
     myShift = length - i + shift;
     switch (prMode)
     {
     case 0: pr = iClose(NULL,TimeFrame,myShift);break;
     case 1: pr = iOpen(NULL,TimeFrame,myShift);break;
     case 2: pr = iHigh(NULL,TimeFrame,myShift);break;
     case 3: pr = iLow(NULL,TimeFrame,myShift);break;
     case 4: pr = (iHigh(NULL,TimeFrame,myShift) + iLow(NULL,TimeFrame,myShift))/2;break;
     case 5: pr = (iHigh(NULL,TimeFrame,myShift) + iLow(NULL,TimeFrame,myShift) + iClose(NULL,TimeFrame,myShift))/3;break;
     case 6: pr = (iHigh(NULL,TimeFrame,myShift) + iLow(NULL,TimeFrame,myShift) + iClose(NULL,TimeFrame,myShift) + iClose(NULL,TimeFrame,myShift))/4;break;
     }
     tmp = ( i - lengthvar)*pr;
     sum+=tmp;
    }
    wt = sum*6/(length*(length+1));
    wt = MathFloor(wt/Point)*Point;

    return(wt);
}

//+------------------------------------------------------------------+
//| Bollinger Bands                                                  |
//+------------------------------------------------------------------+
int start()
  {
   int    i,k,counted_bars=IndicatorCounted();
   double deviation;
   double sum,oldval,newres;
//----
   if(Bars<=BandsPeriod) return(0);
//---- initial zero
   if(counted_bars<1)
      for(i=1;i<=BandsPeriod;i++)
        {
         MovingBuffer[Bars-i]=EMPTY_VALUE;
         UpperBuffer[Bars-i]=EMPTY_VALUE;
         LowerBuffer[Bars-i]=EMPTY_VALUE;
        }
//----
   int limit=Bars-counted_bars;
   if(counted_bars>0) limit++;
   for(i=0; i<limit; i++)
   {
     if (MA_Type == 4)
      MovingBuffer[i]=LSMA(0, BandsPeriod, MA_AppliedPrice,i);
     else
      MovingBuffer[i]=iMA(NULL,0,BandsPeriod,BandsShift,MA_Mode,MA_AppliedPrice,i);
   }
//----
   i=Bars-BandsPeriod+1;
   if(counted_bars>BandsPeriod-1) i=Bars-counted_bars-1;
   while(i>=0)
     {
      sum=0.0;
      k=i+BandsPeriod-1;
      oldval=MovingBuffer[i];
      while(k>=i)
        {
         newres=Close[k]-oldval;
         sum+=newres*newres;
         k--;
        }
      deviation=BandsDeviations*MathSqrt(sum/BandsPeriod);
      UpperBuffer[i]=oldval+deviation;
      LowerBuffer[i]=oldval-deviation;
      i--;
     }
   if (DisplayMidLine == false)
   {
      for(i=1;i<=Bars;i++)
         MovingBuffer[i]=EMPTY_VALUE;
   }
   //----
   return(0);
  }
//+------------------------------------------------------------------+
Comments