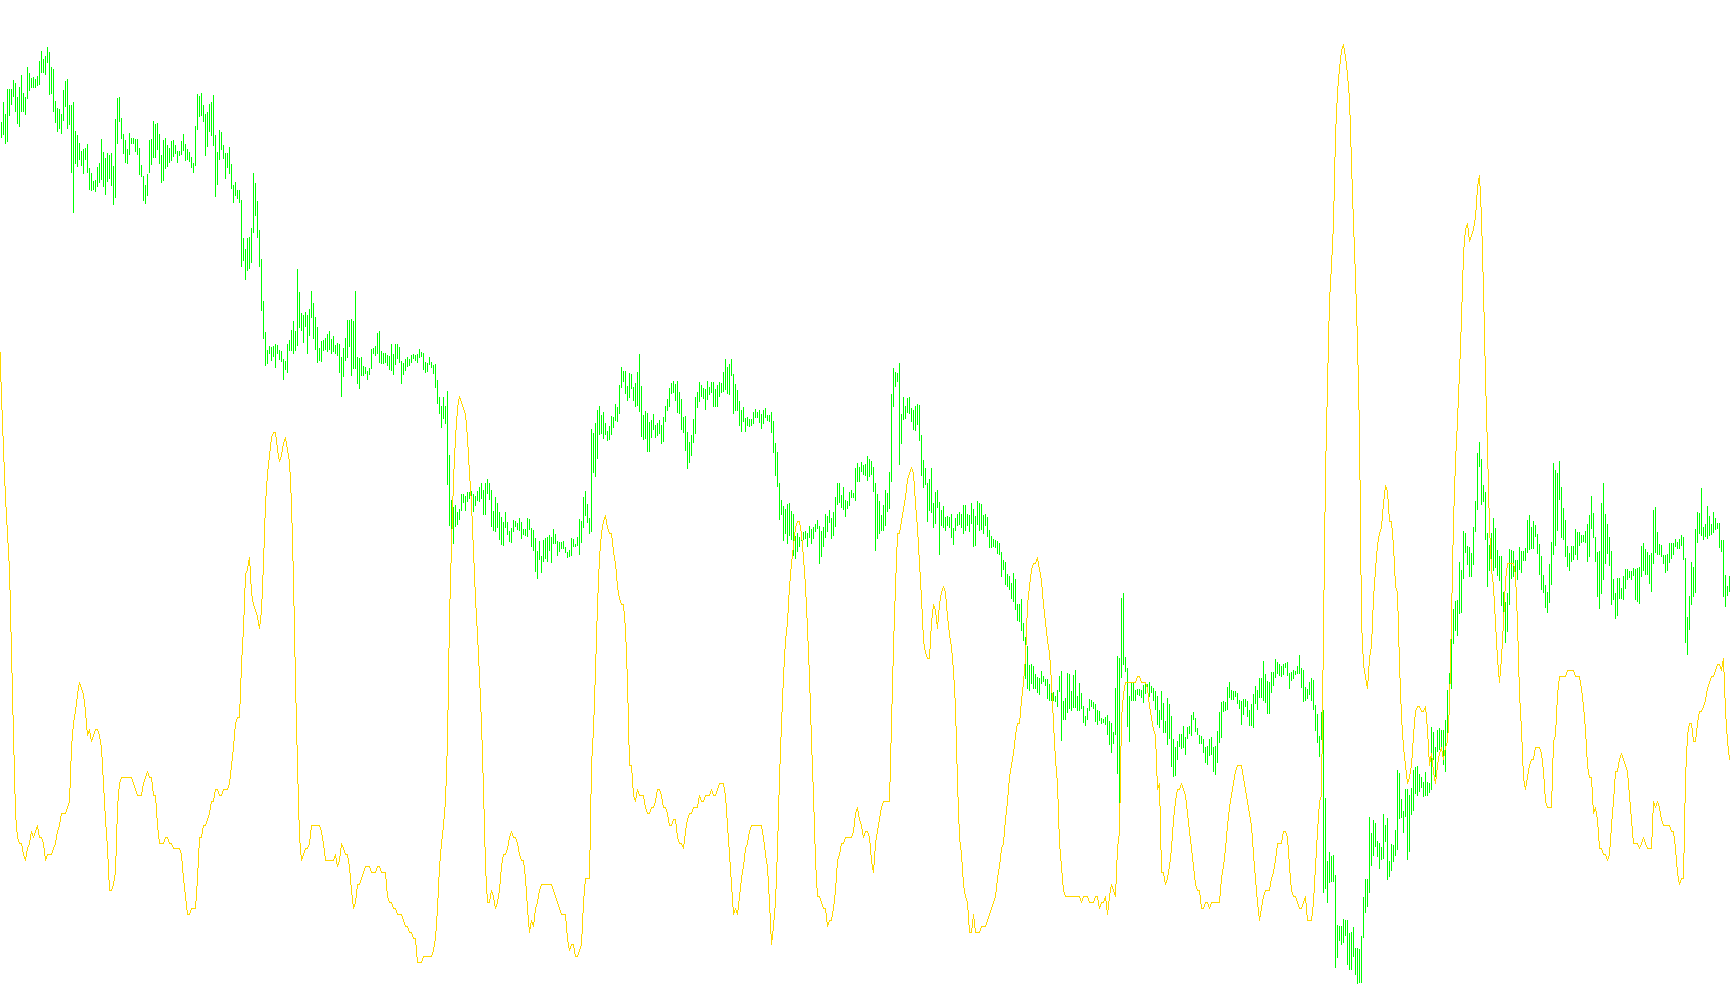
This technical tool, designed for the MetaTrader platform, provides traders with a visual representation of market volatility by calculating and displaying the "Bandwidth" of Bollinger Bands. While standard Bollinger Bands show price extremes, this specific script isolates the width of those bands to help identify periods of high activity versus periods of consolidation.
Core Logic and Functionality
The script operates through a systematic three-step mathematical process to translate raw price action into a readable volatility metric:
1. Establishing the Baseline (Moving Average) The tool first looks at a specific number of previous candles (the "Period") to calculate a Simple Moving Average (SMA). This acts as the "center line" or the equilibrium point of the market, smoothing out minor price fluctuations to show the general trend.
2. Measuring Price Variance (Standard Deviation) Once the baseline is established, the script calculates how far the actual market prices have strayed from that center line over the specified period. It takes into account the "Deviations"—a multiplier that determines how wide the boundaries should be. By calculating the difference between the current price and the average, it determines the "Standard Deviation," which represents the intensity of recent price swings.
3. Calculating the Bandwidth The final step involves taking the distance between the upper boundary and the lower boundary and converting that physical space into a numerical value.
- If the market is moving aggressively (high volatility), the gap between the boundaries widens, resulting in a higher Bandwidth value.
- If the market is trading sideways or "squeezing" (low volatility), the gap narrows, resulting in a lower Bandwidth value.
Practical Application for Traders
Instead of looking at price alone, this script allows you to monitor the expansion and contraction of the market. A rapidly rising Bandwidth suggests that momentum is increasing and the market is becoming more volatile. Conversely, a shrinking Bandwidth often indicates that the market is entering a period of stability or "quiet," which can sometimes precede a significant breakout in price.
By isolating this single metric into its own window, the tool helps traders filter out the "noise" of the main chart to focus purely on the expansion and contraction of market energy.
 //+------------------------------------------------------------------+
//|                                               BandsBandwidth.mq4 |
//|                                Copyright © 2009, Investors Haven |
//|                                                                  |
//+------------------------------------------------------------------+
#property copyright "Copyright © 2009, Investors Haven"
#property link      ""

#property indicator_separate_window
#property indicator_minimum 0
#property indicator_maximum 10000
#property indicator_buffers 1
#property indicator_color1 LightSeaGreen
#property indicator_width1 2
#property indicator_style1 0

//---- indicator parameters
extern int    BandsPeriod=20;
extern int    BandsShift=0;
extern double BandsDeviations=2.0;
//---- buffers
double MovingBuffer[];
double UpperBuffer[];
double LowerBuffer[];
double Bandwidth[];
//+------------------------------------------------------------------+
//| Custom indicator initialization function                         |
//+------------------------------------------------------------------+
int init()
  {

  //---- 3 additional buffers are used for counting.
   IndicatorBuffers(4);
  //---- indicators
   SetIndexStyle(0, DRAW_LINE);
   SetIndexBuffer(0,Bandwidth);
   SetIndexStyle(1,12);
   SetIndexBuffer(1,MovingBuffer);
   SetIndexStyle(2,12);
   SetIndexBuffer(2,UpperBuffer);
   SetIndexStyle(3,12);
   SetIndexBuffer(3,LowerBuffer);
//----
   SetIndexDrawBegin(0,BandsPeriod+BandsShift);
   SetIndexDrawBegin(1,BandsPeriod+BandsShift);
   SetIndexDrawBegin(2,BandsPeriod+BandsShift);
   SetIndexDrawBegin(3,BandsPeriod+BandsShift);
   IndicatorShortName("Bollinger Bandwidth");
   IndicatorDigits(MarketInfo(Symbol(),MODE_DIGITS) - 5);

   return(0);
  }
//+------------------------------------------------------------------+
//| Bollinger Bands                                                  |
//+------------------------------------------------------------------+
int start()
  {
   int    i,k,counted_bars=IndicatorCounted();
   double deviation;
   double sum,oldval,newres;
   Print("here");
//----
   if(Bars<=BandsPeriod) return(0);
//---- initial zero
   if(counted_bars<1)
      for(i=1;i<=BandsPeriod;i++)
        {
         MovingBuffer[Bars-i]=EMPTY_VALUE;
         UpperBuffer[Bars-i]=EMPTY_VALUE;
         LowerBuffer[Bars-i]=EMPTY_VALUE;
         Bandwidth[Bars-i]=EMPTY_VALUE;
         Print("Buffers cleaned");
        }
//----
   int limit=Bars-counted_bars;
   if(counted_bars>0) limit++;
   for(i=0; i<limit; i++)
      MovingBuffer[i]=iMA(NULL,0,BandsPeriod,BandsShift,MODE_SMA,PRICE_CLOSE,i);
//----
   i=Bars-BandsPeriod+1;
   if(counted_bars>BandsPeriod-1) i=Bars-counted_bars-1;
   Print("i is:", i);
   while(i>=0)
     {
      sum=0.0;
      k=i+BandsPeriod-1;
      oldval=MovingBuffer[i];
      while(k>=i)
        {
         newres=Close[k]-oldval;
         sum+=newres*newres;
         k--;
        }
      deviation=BandsDeviations*MathSqrt(sum/BandsPeriod);
      UpperBuffer[i]=oldval+deviation;
      Print("UpperBuffer is:", UpperBuffer[i]);
      LowerBuffer[i]=oldval-deviation;
      Print("LowerBuffer is:", LowerBuffer[i]);
      Bandwidth[i]=MathFloor((UpperBuffer[i] - LowerBuffer[i])*10000);
      Print("Bandwidth is:", Bandwidth[i]);
      i--;
     }
//----
   return(0);
  }
//+------------------------------------------------------------------+
Comments