Heatmap_RSI
Download script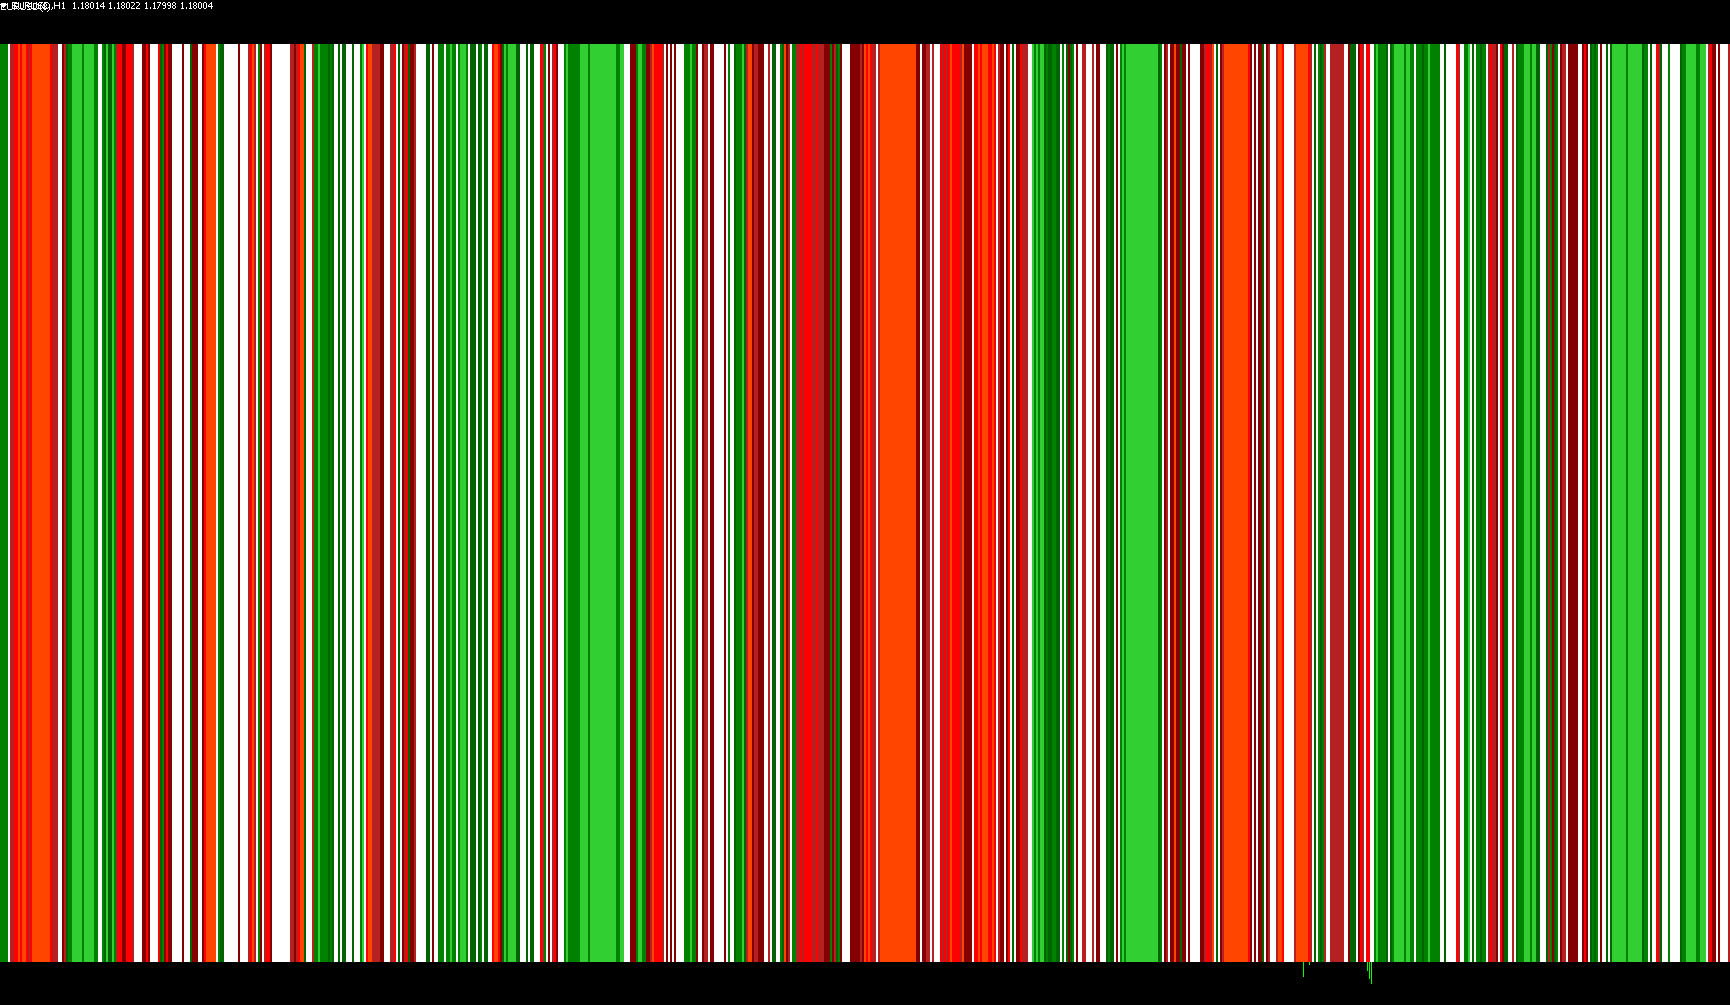
Overview
The Heatmap_RSI is a visual trading tool designed to simplify the interpretation of market momentum. Instead of relying on a standard moving line, this script translates the Relative Strength Index (RSI)—a common technical indicator—into a color-coded "heatmap" display. This allows traders to quickly identify whether a currency pair is in a bullish, bearish, or neutral state based on visual cues.
Core Logic and Functionality
1. Momentum Tracking (The RSI Foundation) The script works by constantly calculating the RSI of a specific currency pair over a user-defined period. The RSI measures the speed and change of price movements. In this tool, that numerical value is used as the primary "trigger" to determine which color appears on your chart.
2. Dynamic Color Mapping The tool categorizes the RSI values into distinct zones, each represented by a specific color to indicate market sentiment:
- Bullish Sentiment (Green Shades): When the RSI climbs above 55, the script begins to display shades of green. The intensity of the green increases as the RSI value rises further toward higher levels, signaling stronger upward momentum.
- Bearish Sentiment (Red/Maroon Shades): When the RSI drops below 45, the script transitions into shades of red and maroon. Similar to the bullish side, as the RSI moves lower, the colors shift to reflect a deepening downward trend.
- Neutral/Ranging Zone (Gray): When the RSI sits in the middle ground (the "neutral zone"), the script displays gray blocks. This indicates that the market is currently lacking a clear direction and may be moving sideways or ranging.
3. Advanced Features
- Inversion Toggle: The script includes an "Invert Strength" option. This allows users to flip the logic of the colors, which can be useful for specific trading styles or when looking at assets with inverse correlations.
- Customizable Pairs: While it defaults to the currency pair currently on your screen, the tool can be configured to monitor a specific secondary currency pair simultaneously.
- Visual Clarity: By using blocks and distinct colors rather than a thin line, the heatmap provides a "glanceable" experience, allowing you to see at a glance how the trend has evolved over time without having to study complex numerical data points.
Summary for the Trader
Essentially, this script acts as a visual filter. It takes the complex math of the RSI and "paints" your chart: Green means the bulls are in control, Red means the bears are taking charge, and Gray means the market is undecided.
//+------------------------------------------------------------------+
//|                                                  Heatmap_RSI.mq4 |
//|                                                      Lq_sunshine |
//|                                         http://www.forex-tsd.com |
//+------------------------------------------------------------------+

#property indicator_separate_window
#property indicator_buffers 8
#property indicator_color1 DarkGreen   // C'162,208,162'
#property indicator_color2 Green       // C' 90,185, 90'
#property indicator_color3 LimeGreen   // C' 23,139, 23'
#property indicator_color4 C'50,50,50' // C'255,255,255'
#property indicator_color5 Maroon      // C'255,185,185'
#property indicator_color6 FireBrick   // C'255,115,115'
#property indicator_color7 Red         // C'255, 76, 76'
#property indicator_color8 OrangeRed   // C'255, 32, 32'
//---- parameters
extern int    Periods = 8;
extern bool   invert_strength =  0;
extern string CurrencyPair    = "";
extern string NOTE0 = "Enter currencypair in uppercase,";
extern string NOTE1 = "e.g. EURUSD";
extern string NOTE2 = "Leave empty for current symbol.";
//extern string NOTE3 = "Add an \"m\"  e.g EURUSDm ";
//extern string NOTE4 = "if you have a mini account.";
//---- buffers
   double     ExtBuffer0[];
   double     ExtBuffer1[];
   double     ExtBuffer2[];
   double     ExtBuffer3[];
   double     ExtBuffer4[];
   double     ExtBuffer5[];
   double     ExtBuffer6[];
   double     ExtBuffer7[];
   double     ExtBuffer8[];
//+------------------------------------------------------------------+
//+------------------------------------------------------------------+
int init()
{
   SetIndexBuffer(0,ExtBuffer0);
   SetIndexBuffer(1,ExtBuffer1);
   SetIndexBuffer(2,ExtBuffer2);
   SetIndexBuffer(3,ExtBuffer3);
   SetIndexBuffer(4,ExtBuffer4);
   SetIndexBuffer(5,ExtBuffer5);
   SetIndexBuffer(6,ExtBuffer6);
   SetIndexBuffer(7,ExtBuffer7);

   SetIndexStyle(0,DRAW_HISTOGRAM, EMPTY, 5, indicator_color1);
   SetIndexStyle(1,DRAW_HISTOGRAM, EMPTY, 5, indicator_color2);
   SetIndexStyle(2,DRAW_HISTOGRAM, EMPTY, 5, indicator_color3);
   SetIndexStyle(3,DRAW_HISTOGRAM, EMPTY, 5, indicator_color4);
   SetIndexStyle(4,DRAW_HISTOGRAM, EMPTY, 5, indicator_color5);
   SetIndexStyle(5,DRAW_HISTOGRAM, EMPTY, 5, indicator_color6);
   SetIndexStyle(6,DRAW_HISTOGRAM, EMPTY, 5, indicator_color7);
   SetIndexStyle(7,DRAW_HISTOGRAM, EMPTY, 5, indicator_color8);

   for (int i=0;i<indicator_buffers;i++) SetIndexLabel(i,NULL);

   if (CurrencyPair == "") CurrencyPair = Symbol();
   if (iClose(CurrencyPair,0,0) == 0)
              CurrencyPair = Symbol();
   IndicatorShortName(CurrencyPair+"("+Periods+")");
   return(1);
}

int deinit()
  {
   return(0);
  }
//+------------------------------------------------------------------+
int start()
  {

   int    counted_bars=IndicatorCounted();

//---- check for possible errors
   if (counted_bars<0) return(-1);
//---- last counted bar will be recounted
   if (counted_bars>0) counted_bars--;

   int    pos=Bars-counted_bars;

   double ddraw;

//---- main calculation loop
   while(pos>=0)
     {
      ddraw= iRSI(CurrencyPair,0,Periods,PRICE_CLOSE,pos);

      if (invert_strength==1)
         ddraw=ddraw-(ddraw-50)*2;   //---- Inversion of the RSI

      if(ddraw<=45)                  //---- RSI <= 45 draws Red blocks

      if(ddraw<=45 && ddraw>40)       drawblock(0,0,0,0,4,0,0,0,pos);

      else if(ddraw<=40 && ddraw>35)  drawblock(0,0,0,0,0,4,0,0,pos);

      else if(ddraw<=35 && ddraw>30)  drawblock(0,0,0,0,0,0,4,0,pos);

      else                            drawblock(0,0,0,0,0,0,0,4,pos);


      else if(ddraw>=55)     //---- RSI >= 55 draws Green blocks

      if(ddraw>55 && ddraw<60)        drawblock(4,0,0,0,0,0,0,0,pos);

      else if(ddraw>=60 && ddraw<70)  drawblock(0,4,0,0,0,0,0,0,pos);

      else                            drawblock(0,0,4,0,0,0,0,0,pos);

      else                            drawblock(0,0,0,4,0,0,0,0,pos);     //---- draw Gray block if there chart is ranging

     pos--; }
//----
   return(0);
  }

void drawblock(int a,int b,int c,int d,int e,int f,int g,int h,int pos)

{
ExtBuffer0[pos]=a;
ExtBuffer1[pos]=b;
ExtBuffer2[pos]=c;
ExtBuffer3[pos]=d;
ExtBuffer4[pos]=e;
ExtBuffer5[pos]=f;
ExtBuffer6[pos]=g;
ExtBuffer7[pos]=h;
}
Comments