#SVM_b4_dd_pred4_
Download script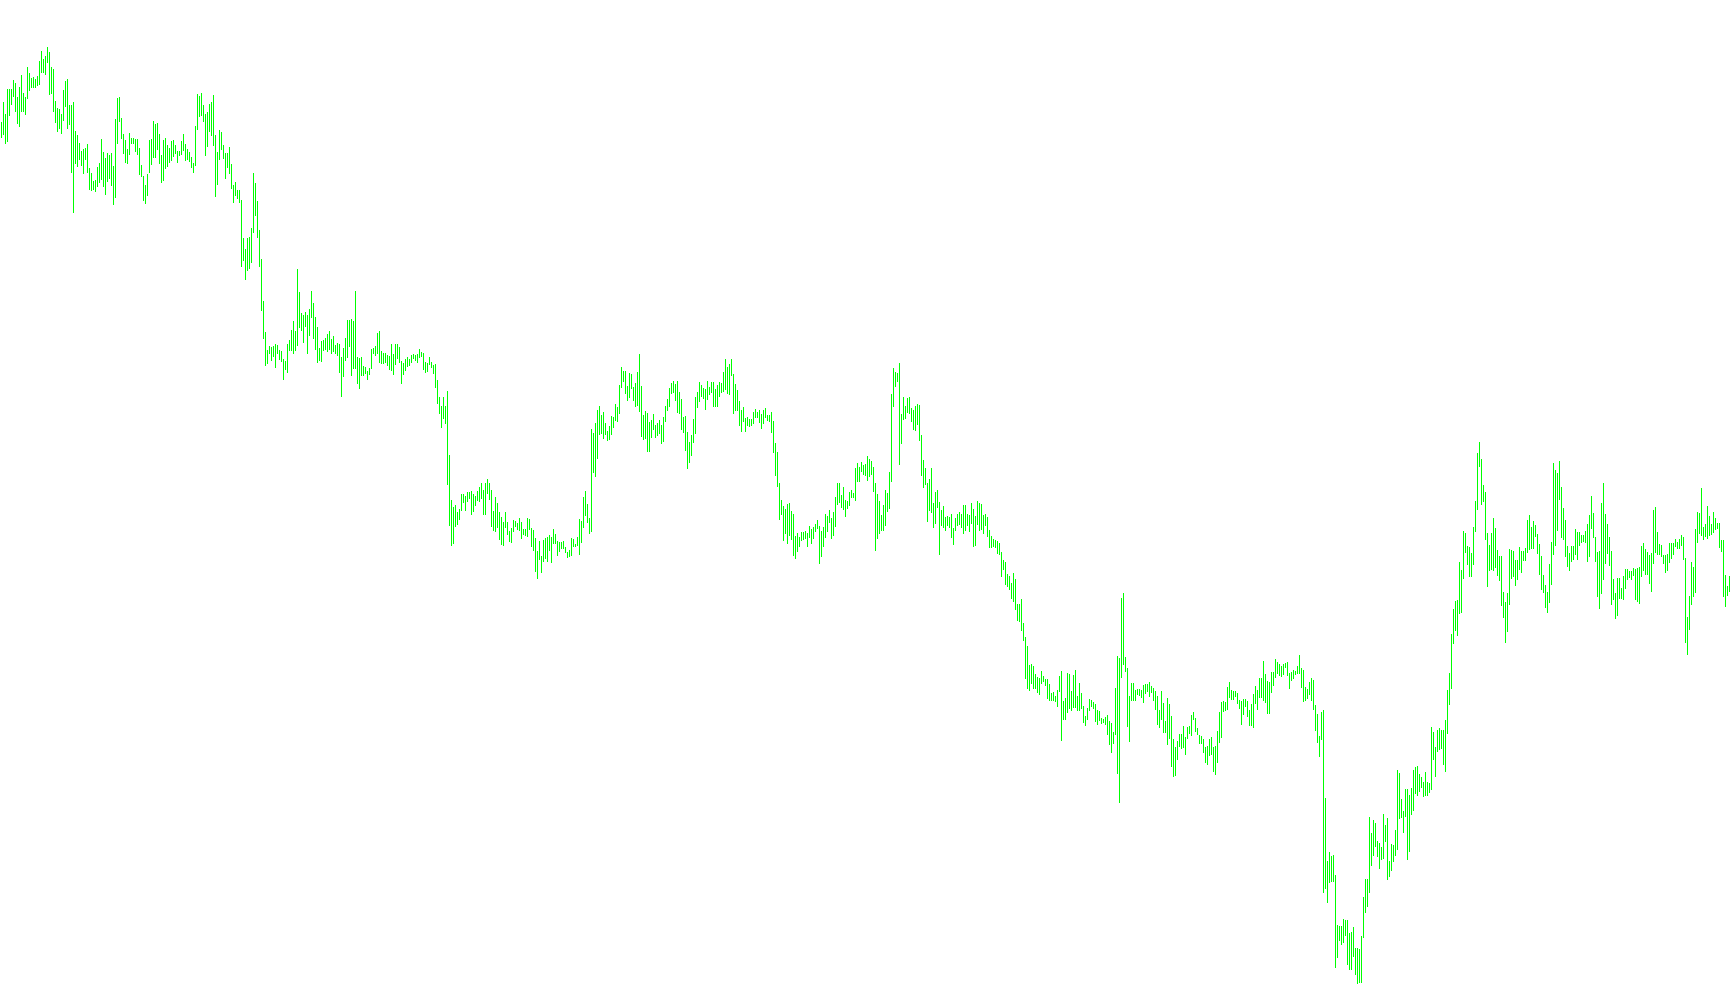
This script is designed as a visual dashboard for traders who want to monitor market momentum and trends through a simplified color-coded system. Rather than cluttering the screen with complex lines or standard oscillator values, it translates specific mathematical data into a clean, block-based visual display.
Core Functionality
The primary goal of this tool is to interpret data from a secondary technical indicator (an RSI-based calculation) and map it onto your chart using a series of colored blocks. It acts as a "translator," taking raw numerical values and converting them into actionable visual cues: Red for bearish momentum, Green for bullish momentum, and White for neutral/ranging conditions.
How the Logic Works
The script operates by scanning historical price data and identifying specific threshold levels. Here is how it interprets those levels to create the visual output:
- Bearish Signals (Red Blocks): When the underlying data reaches certain low thresholds, the script activates different positions of red blocks. The specific placement of these blocks varies depending on how deep the momentum is falling, providing a visual "gradient" of downward pressure.
- Bullish Signals (Green Blocks): Conversely, when the data hits higher thresholds, the script triggers green blocks. Similar to the bearish signals, the distribution of these blocks changes based on the strength of the upward move, allowing you to see at a glance how strong the current trend is.
- Neutral/Ranging Signals (White Blocks): If the data falls into a middle "gray area" where there is no clear dominant trend, the script displays white blocks. This informs the trader that the market may be consolidating or ranging, suggesting a period of lower volatility where a strong direction hasn't yet been established.
Visual Experience
Instead of forcing the user to read numbers on an oscillator window, this script provides an immediate "heat map" of sorts. By looking at the blocks:
- Color Detection: You can instantly see if the bias is Bullish (Green), Bearish (Red), or Neutral (White).
- Trend Strength: Because different thresholds trigger different block patterns, you can visually distinguish between a weak trend and a high-momentum breakout without having to analyze the raw numbers yourself.
In summary, this tool simplifies complex technical analysis into a binary visual language, allowing for faster decision-making by highlighting market sentiment through a color-coded histogram system.
//+------------------------------------------------------------------+
//|                                     multisymbol_color-RSI_1.0.mq4 |
//|                                                      Lq_sunshine |
//|                                         http://www.forex-tsd.com |
//+------------------------------------------------------------------+
//#property indicator_chart_window
#property indicator_separate_window
#property indicator_buffers 8
#property indicator_color1 C'162,208,162'
#property indicator_color2 C' 90,185, 90'
#property indicator_color3 C' 23,139, 23'
#property indicator_color4 C'255,255,255'
#property indicator_color5 C'255,185,185'
#property indicator_color6 C'255,115,115'
#property indicator_color7 C'255, 76, 76'
#property indicator_color8 C'255, 32, 32'

string indicator1="#SVM_b4_dd_pred4";
//extern int    Periode=10;
//extern bool   invert_strength =  0;
//extern string CurrencyPair    = "";
//extern string NOTE0 = "enter currencypair in uppercase";
//extern string NOTE1 = "like EURUSD";
//extern string NOTE2 = "leave empty for current symbol";
//extern string NOTE3 = "if you have a mini account";
//extern string NOTE4 = "add a \"m\"  e.g EURUSDm ";

//----------


//---- buffers
   double     ExtBuffer0[];
   double     ExtBuffer1[];
   double     ExtBuffer2[];
   double     ExtBuffer3[];
   double     ExtBuffer4[];
   double     ExtBuffer5[];
   double     ExtBuffer6[];
   double     ExtBuffer7[];
   double     ExtBuffer8[];


//+------------------------------------------------------------------+
//+------------------------------------------------------------------+
int init()
{
   SetIndexBuffer(0,ExtBuffer0);
   SetIndexBuffer(1,ExtBuffer1);
   SetIndexBuffer(2,ExtBuffer2);
   SetIndexBuffer(3,ExtBuffer3);
   SetIndexBuffer(4,ExtBuffer4);
   SetIndexBuffer(5,ExtBuffer5);
   SetIndexBuffer(6,ExtBuffer6);
   SetIndexBuffer(7,ExtBuffer7);

   SetIndexStyle(0,DRAW_HISTOGRAM, EMPTY, 5);
   SetIndexStyle(1,DRAW_HISTOGRAM, EMPTY, 5);
   SetIndexStyle(2,DRAW_HISTOGRAM, EMPTY, 5);
   SetIndexStyle(3,DRAW_HISTOGRAM, EMPTY, 5);
   SetIndexStyle(4,DRAW_HISTOGRAM, EMPTY, 5);
   SetIndexStyle(5,DRAW_HISTOGRAM, EMPTY, 5);
   SetIndexStyle(6,DRAW_HISTOGRAM, EMPTY, 5);
   SetIndexStyle(7,DRAW_HISTOGRAM, EMPTY, 5);

   //for (int i=0;i<indicator_buffers;i++) SetIndexLabel(i,NULL);

   //if (CurrencyPair == "") CurrencyPair = Symbol();
   //if (iClose(CurrencyPair,0,0) == 0)
   //           CurrencyPair = Symbol();
   //IndicatorShortName(CurrencyPair+"("+Periode+")");
   return(1);
}

int deinit()
  {
   return(0);
  }
//+------------------------------------------------------------------+
//+------------------------------------------------------------------+
int start()
  {


   int    counted_bars=IndicatorCounted();

//---- check for possible errors
   if (counted_bars<0) return(-1);
//---- last counted bar will be recounted
   if (counted_bars>0) counted_bars--;

   int    pos=Bars-counted_bars;


   double ddraw;


//---- main calculation loop
   while(pos>=0)
     {
        ddraw= iCustom(Symbol(),0,indicator1,6,pos);
         //if (invert_strength==1)
         //    ddraw=ddraw-(ddraw-50)*2;             //---- Inversion of the RSI
          //   1     2     3     4    5    6    7
          //-2.9  -1.9  -0.9   0.1  1.1  2.1  3.1
         if(ddraw==1.1 )           //---- RSI <= 48 draws RED blocks
         {
                //Print("----> -0.9");
                //        1 2 3 4 5 6 7 8
                drawblock(0,0,0,0,5,0,0,0,pos);
                //        1 2 3 4 5 6 7 8
                //drawblock(0,0,0,0,0,5,0,0,pos);
                //        1 2 3 4 5 6 7 8
                //drawblock(0,0,0,0,0,0,5,0,pos);
                //        1 2 3 4 5 6 7 8
                //drawblock(0,0,0,0,0,0,0,5,pos);
          }
          //   1     2     3     4    5    6    7
          //-2.9  -1.9  -0.9   0.1  1.1  2.1  3.1
         else if(ddraw==2.1 )           //---- RSI <= 48 draws RED blocks
         {
                //Print("----> -0.9");
                //        1 2 3 4 5 6 7 8
                //drawblock(0,0,0,0,5,0,0,0,pos);
                //        1 2 3 4 5 6 7 8
                drawblock(0,0,0,0,0,5,0,0,pos);
                //        1 2 3 4 5 6 7 8
                //drawblock(0,0,0,0,0,0,5,0,pos);
                //        1 2 3 4 5 6 7 8
                //drawblock(0,0,0,0,0,0,0,5,pos);
          }
          //   1     2     3     4    5    6    7
          //-2.9  -1.9  -0.9   0.1  1.1  2.1  3.1
         else if(ddraw==3.1 )           //---- RSI <= 48 draws RED blocks
         {
                //Print("----> -0.9");
                //        1 2 3 4 5 6 7 8
                //drawblock(0,0,0,0,5,0,0,0,pos);
                //        1 2 3 4 5 6 7 8
                //drawblock(0,0,0,0,0,5,0,0,pos);
                //        1 2 3 4 5 6 7 8
                drawblock(0,0,0,0,0,0,5,0,pos);
                //        1 2 3 4 5 6 7 8
                //drawblock(0,0,0,0,0,0,0,5,pos);
          }
          //   1     2     3     4    5    6    7
          //-2.9  -1.9  -0.9   0.1  1.1  2.1  3.1
          else if(ddraw==5.1)     //---- RSI >= 52 draws green blocks
          {
                //Print("----> 1.1");
                //        1 2 3 4 5 6 7 8
                //drawblock(5,0,0,0,0,0,0,0,pos);
                //        1 2 3 4 5 6 7 8
                //drawblock(0,5,0,0,0,0,0,0,pos);
                //        1 2 3 4 5 6 7 8
                drawblock(0,0,5,0,0,0,0,0,pos);
          }
          //   1     2     3     4    5    6    7
          //-2.9  -1.9  -0.9   0.1  1.1  2.1  3.1
         else if(ddraw==6.1)     //---- RSI >= 52 draws green blocks
          {
                //Print("----> 1.1");
                //        1 2 3 4 5 6 7 8
                //drawblock(5,0,0,0,0,0,0,0,pos);
                //        1 2 3 4 5 6 7 8
                drawblock(0,5,0,0,0,0,0,0,pos);
                //        1 2 3 4 5 6 7 8
                //drawblock(0,0,5,0,0,0,0,0,pos);
          }
          //   1     2     3     4    5    6    7
          //-2.9  -1.9  -0.9   0.1  1.1  2.1  3.1
         else if(ddraw==7.1)     //---- RSI >= 52 draws green blocks
          {
                //Print("----> 1.1");
                //        1 2 3 4 5 6 7 8
                drawblock(5,0,0,0,0,0,0,0,pos);
                //        1 2 3 4 5 6 7 8
                //drawblock(0,5,0,0,0,0,0,0,pos);
                //        1 2 3 4 5 6 7 8
                //drawblock(0,0,5,0,0,0,0,0,pos);
          }
          //   1     2     3     4    5    6    7
          //-2.9  -1.9  -0.9   0.1  1.1  2.1  3.1
          else  if(ddraw==4.1)
          {
                //Print("----> 0.1");
                //---- draw white block if there chart is ranging
                //        1 2 3 4 5 6 7 8
                drawblock(0,0,0,5,0,0,0,0,pos);
          }


         pos--;
     }
//----
   return(0);
  }

void drawblock(int a,int b,int c,int d,int e,int f,int g,int h,int pos)

{

               ExtBuffer0[pos]=a;
               ExtBuffer1[pos]=b;
               ExtBuffer2[pos]=c;
               ExtBuffer3[pos]=d;
               ExtBuffer4[pos]=e;
               ExtBuffer5[pos]=f;
               ExtBuffer6[pos]=g;
               ExtBuffer7[pos]=h;
}
Comments