multisymbol_color_Stochastic_LQ_1.0M6
Download script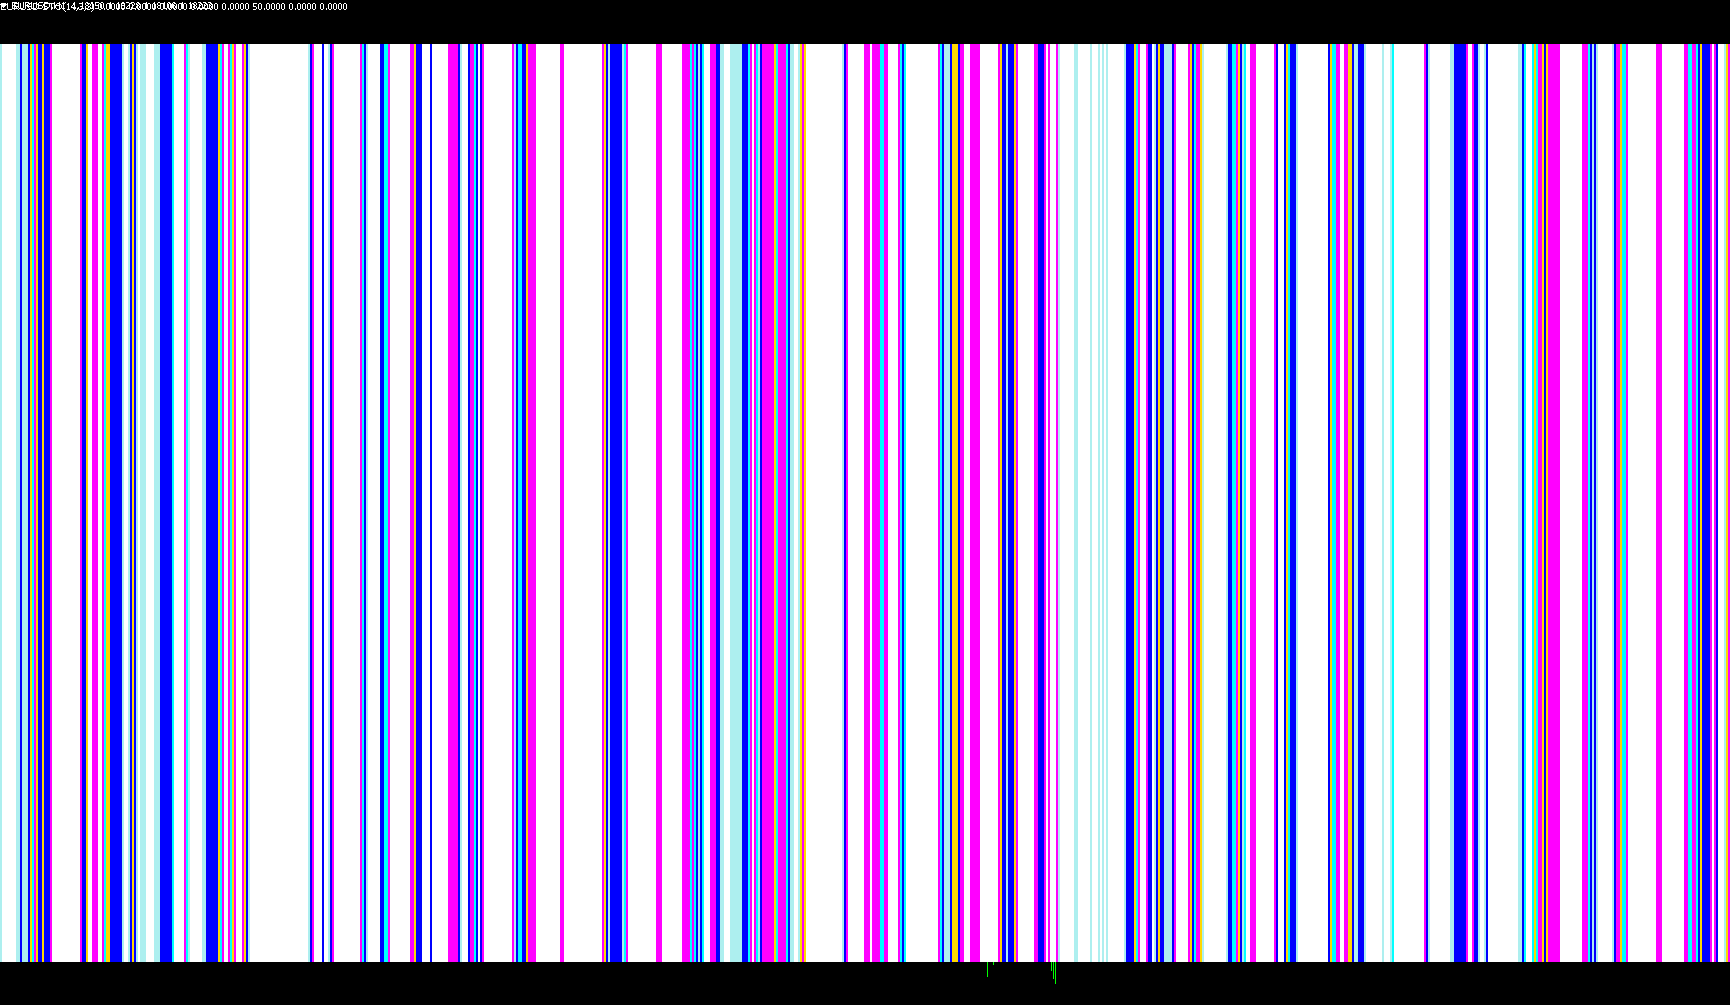
This tool is a specialized visual indicator designed for the MetaTrader 4 platform. It transforms the standard Stochastic Oscillator—a common technical analysis tool used to identify overbought and oversold conditions—into a color-coded visual heat map or "histogram" style display.
Core Functionality
Instead of showing you just two intersecting lines, this script analyzes the momentum of a specific currency pair and translates that data into distinct colored blocks. These colors serve as an immediate visual cue for the strength and direction of the market trend.
How the Logic Works
The indicator works by calculating the Stochastic value and then categorizing that value into specific "zones." Depending on where the price action falls within these zones, the tool draws different colors to represent varying degrees of momentum:
- Bearish Momentum (Red Tones): When the values fall below the 50-point midline, the indicator shifts toward red. It differentiates between "weak" bearish signals and "strong" bearish signals based on specific sub-levels (e.g., falling below 45, 30, or 20).
- Bullish Momentum (Green Tones): When values rise above the 50-point midline, the indicator shifts toward green. It uses different shades to represent "weak" bullish movement versus high-strength momentum (reaching toward the upper limits of the scale).
- Neutral/Ranging States: The logic includes specific thresholds where the colors shift to indicate a neutral or ranging market, helping the user distinguish between a clear trend and sideways price action.
Key Features for the User
- Multi-Symbol Capability: The script can be configured to monitor a specific currency pair (like EURUSD) regardless of which chart you are currently viewing.
- Customizable Sensitivity: You can adjust the core settings—such as the K-Period, Slowing, and D-Period—to make the indicator more responsive to fast price changes or smoother for long-term trend analysis.
- Inversion Logic: There is a built-in feature to "invert" the strength readings, allowing for customized visual preferences based on individual trading styles.
- Mini-Account Support: The logic includes specific handling for "mini" accounts (indicated by an "m" suffix), ensuring that calculations remain accurate regardless of your account type.
Visual Experience
The primary goal of this script is to simplify data interpretation. By turning raw numerical percentages into a gradient of colors, it allows a trader to glance at the chart and instantly perceive market sentiment: deep reds for heavy downward pressure, bright greens for upward strength, and softer tones for transitional price movements.
//+------------------------------------------------------------------+
//| mod. Stochastic                     multisymbol_color-RSI_1.0.mq4|
//|                                                      Lq_sunshine |
//|mod. barlevel ki                         http://www.forex-tsd.com |
//+------------------------------------------------------------------+


#property indicator_separate_window
#property indicator_buffers 8
#property indicator_color1 C'188,253,176'//white
#property indicator_color2 C'140,240,130'
#property indicator_color3 C'73,204,70'
#property indicator_color4 C'23,139,23'  //green
#property indicator_color5 C'255,185,185'
#property indicator_color6 C'255,115,115'
#property indicator_color7 C'255,76,76'
#property indicator_color8 C'255,32,32'   //red
#property indicator_maximum 77
#property indicator_minimum 1


//extern int    Periode=14;
extern int       KPeriod       =  14;
extern int       Slowing       =   3;
extern int       DPeriod       =   3;

extern int       MAMethod      =   2;
extern int       PriceField    =   0;

extern bool   Use_percentD       =  false;
extern bool   invert_strength =  0;
extern string CurrencyPair    = "";
extern string NOTE_1    = "enter currencypair in uppercase";
extern string _____     = "like EURUSD";
extern string ______    = "leave empty for current symbol";
extern string NOTE_2    = "if you have a mini account";
extern string ________  = "add a \"m\"  e.g EURUSDm ";
extern string MA_Method_ = "SMA0 EMA1 SMMA2 LWMA3";

extern bool  lablesOn = true;
extern int   BarLevel= 10;

//---- buffers
   double     ExtBuffer0[];
   double     ExtBuffer1[];
   double     ExtBuffer2[];
   double     ExtBuffer3[];
   double     ExtBuffer4[];
   double     ExtBuffer5[];
   double     ExtBuffer6[];
   double     ExtBuffer7[];
   double     ExtBuffer8[];


//+------------------------------------------------------------------+
//+------------------------------------------------------------------+
int init()
{
   SetIndexBuffer(0,ExtBuffer0);
   SetIndexBuffer(1,ExtBuffer1);
   SetIndexBuffer(2,ExtBuffer2);
   SetIndexBuffer(3,ExtBuffer3);
   SetIndexBuffer(4,ExtBuffer4);
   SetIndexBuffer(5,ExtBuffer5);
   SetIndexBuffer(6,ExtBuffer6);
   SetIndexBuffer(7,ExtBuffer7);

   SetIndexStyle(0,DRAW_HISTOGRAM, EMPTY, 5);
   SetIndexStyle(1,DRAW_HISTOGRAM, EMPTY, 5);
   SetIndexStyle(2,DRAW_HISTOGRAM, EMPTY, 5);
   SetIndexStyle(3,DRAW_HISTOGRAM, EMPTY, 5);
   SetIndexStyle(4,DRAW_HISTOGRAM, EMPTY, 5);
   SetIndexStyle(5,DRAW_HISTOGRAM, EMPTY, 5);
   SetIndexStyle(6,DRAW_HISTOGRAM, EMPTY, 5);
   SetIndexStyle(7,DRAW_HISTOGRAM, EMPTY, 5);

   for (int i=0;i<indicator_buffers;i++) SetIndexLabel(i,NULL);

   if (CurrencyPair == "") CurrencyPair = Symbol();
   if (iClose(CurrencyPair,0,0) == 0)
              CurrencyPair = Symbol();
   IndicatorShortName(CurrencyPair+" STO("+KPeriod+","+Slowing+","+DPeriod+")");


if (lablesOn)
 {
 SetIndexLabel(0,"sto50-55"); //litegreen
 SetIndexLabel(1,"sto55-70");
 SetIndexLabel(2,"sto70-80");
 SetIndexLabel(3,"sto>80");   //green
 SetIndexLabel(4,"sto45-50"); //litered
 SetIndexLabel(5,"sto30-45");
 SetIndexLabel(6,"sto20-30");
 SetIndexLabel(7,"sto<20");   //red
 }


   return(1);
}

int deinit()
  {
   return(0);
  }
//+------------------------------------------------------------------+
//+------------------------------------------------------------------+
int start()
  {


   int    counted_bars=IndicatorCounted();

//---- check for possible errors
   if (counted_bars<0) return(-1);
//---- last counted bar will be recounted
   if (counted_bars>0) counted_bars--;

   int    pos=Bars-counted_bars;


  double ddraw;

// double level[];

//---- main calculation loop
   while(pos>=0)
   {
//          ddraw= iRSI(CurrencyPair,0,Periode,PRICE_CLOSE,pos);
            ddraw = iStochastic(CurrencyPair,0,KPeriod,DPeriod,Slowing,MAMethod,PriceField,MODE_MAIN,pos);
      if (Use_percentD)
            ddraw = iStochastic(CurrencyPair,0,KPeriod,DPeriod,Slowing,MAMethod,PriceField,MODE_SIGNAL,pos);

         if (invert_strength==1)
             ddraw=ddraw-(ddraw-50)*2;             //---- Inversion of the RSI

         if(ddraw<50)           //---- RSI <= 48 draws RED blocks

             if(ddraw<50&&ddraw>45)    //---- 44< RSI  draws RED blocks
                drawblock(0,0,0,0,5,0,0,0,pos);

                  else if(ddraw<=45&&ddraw>30)  //---- 39< RSI  draws RED blocks
                          drawblock(0,0,0,0,0,5,0,0,pos);

                         else if(ddraw<=30&&ddraw>20)//---- 35< RSI  draws RED blocks
                                drawblock(0,0,0,0,0,0,5,0,pos);

                          else
                               drawblock(0,0,0,0,0,0,0,5,pos);


          else if(ddraw>=50)     //---- RSI >= 52 draws green blocks

               if(ddraw>=50&&ddraw<55)//---- RSI >= 52 <56 draws green blocks
                  drawblock(5,0,0,0,0,0,0,0,pos);

              else if(ddraw>=55&&ddraw<70)//---- RSI >= 56 <60 draws green blocks
                      drawblock(0,5,0,0,0,0,0,0,pos);

                  else if(ddraw>=70&&ddraw<80)//---- 60>RSI<70 draws green blocks
                         drawblock(0,0,5,0,0,0,0,0,pos);

             else
              drawblock(0,0,0,5,0,0,0,0,pos);     //---- draw white block if there chart is ranging
//


         pos--;
   }


//----
   return(0);
  }

void drawblock(int a,int b,int c,int d,int e,int f,int g,int h,int pos)

{

               ExtBuffer0[pos]=a*BarLevel;
               ExtBuffer1[pos]=b*BarLevel;
               ExtBuffer2[pos]=c*BarLevel;
               ExtBuffer3[pos]=d*BarLevel;
               ExtBuffer4[pos]=e*BarLevel;
               ExtBuffer5[pos]=f*BarLevel;
               ExtBuffer6[pos]=g*BarLevel;
               ExtBuffer7[pos]=h*BarLevel;


}
Comments