#SVM_b4_dd_pred2_
Download script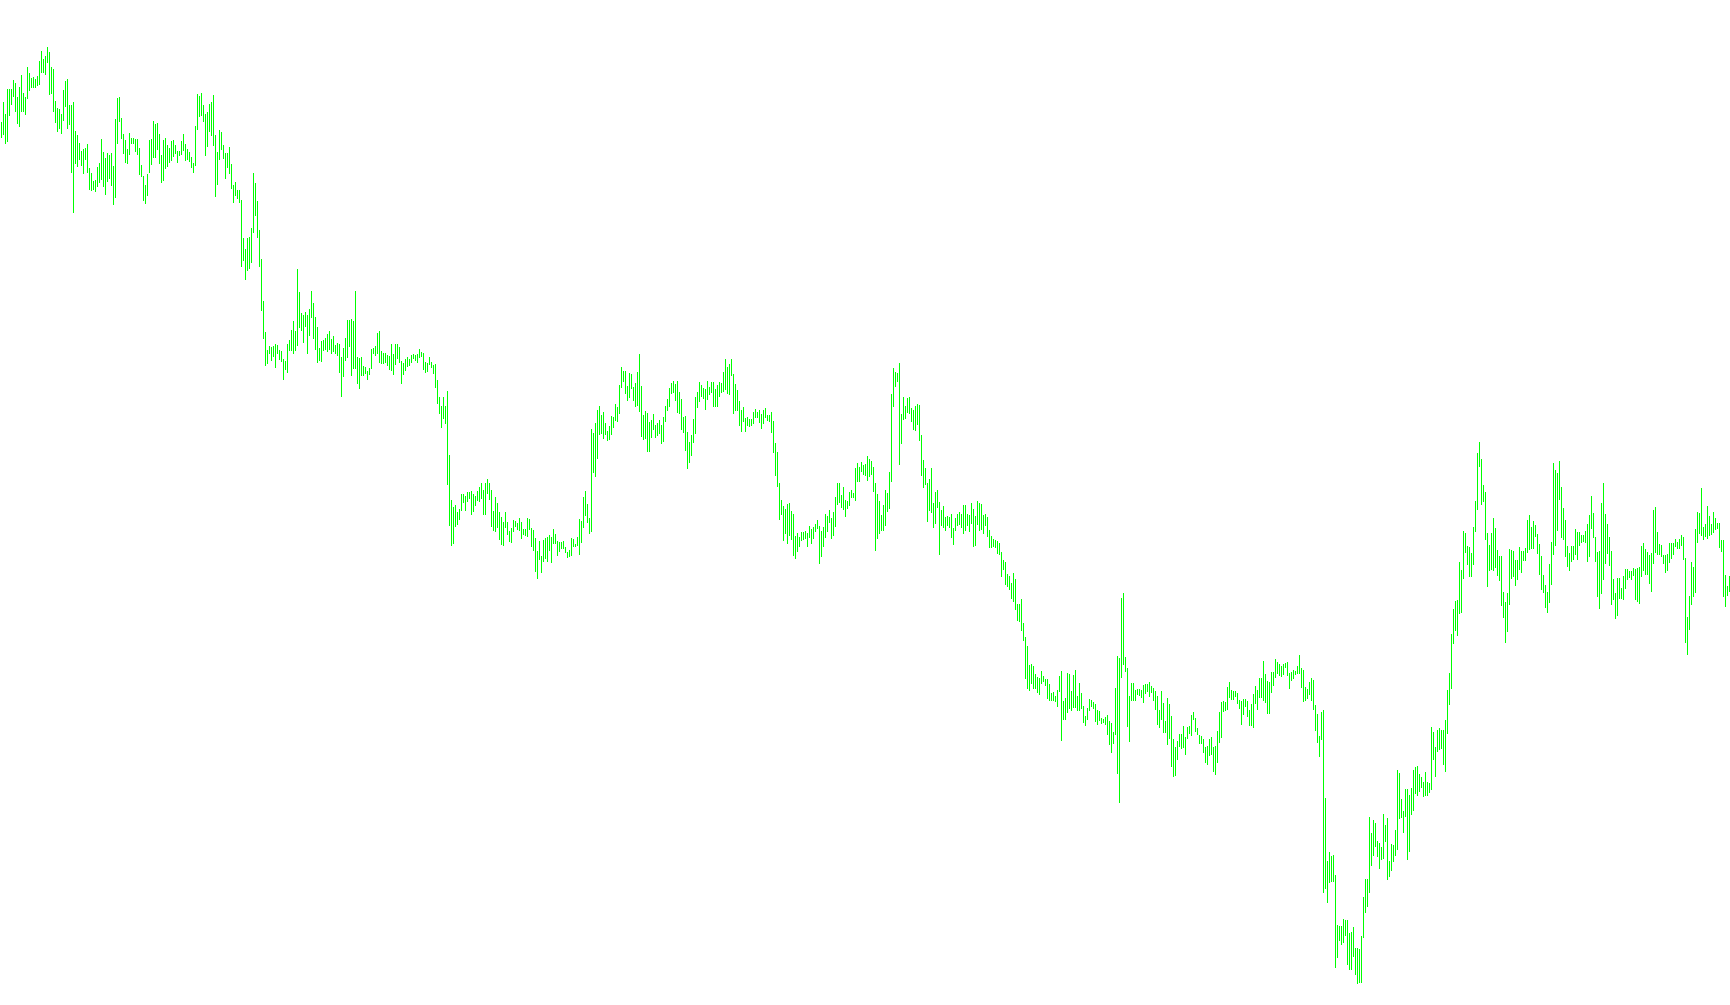
This script is designed as a visual trading tool for MetaTrader 4 that transforms complex technical data into an easy-to-read color-coded histogram. Instead of requiring you to interpret raw numerical values, it translates market momentum into a simplified visual "dashboard."
Core Logic and Functionality
The primary objective of this script is to monitor the Relative Strength Index (RSI)—a common tool used to measure the speed and change of price movements—and convert its various levels into distinct colors on your chart. It acts as a bridge between a complex calculation and a simple visual cue.
How the Visuals Work
The script monitors specific "thresholds" or triggers. When the market data hits these specific points, the tool paints different sections of a histogram using a variety of colors (Red, Green, White, and various shades). Here is how the logic handles the market behavior:
- Bearish Momentum (Red Zones): When the underlying momentum drops below certain levels, the script activates specific "blocks" in red. These indicate areas where the downward pressure is becoming more pronounced. The different red variations allow you to see the progression of this weakness as it intensifies.
- Bullish Momentum (Green Zones): Conversely, when the momentum rises above specific targets, the script paints the histogram with green blocks. This provides a quick visual confirmation of upward strength and buying pressure.
- Neutral / Ranging Markets (White Zones): When the data falls into a middle ground—meaning the market is neither showing significant strength nor weakness—the script highlights these areas in white. This helps traders identify "sideways" price action or periods of consolidation.
Summary for the User
Rather than forcing you to constantly check if an indicator is above 50, below 30, or hitting specific numbers, this script does that work for you in real-time. It scans the data and updates a multi-colored histogram:
- Green tells you where there is strength.
- Red tells you where there is weakness.
- White tells you when the market is resting or undecided.
By using this script, you can glance at your chart and immediately understand the "mood" of the market based on the dominant color shown in the histogram window.
//+------------------------------------------------------------------+
//|                                     multisymbol_color-RSI_1.0.mq4 |
//|                                                      Lq_sunshine |
//|                                         http://www.forex-tsd.com |
//+------------------------------------------------------------------+
//#property indicator_chart_window
#property indicator_separate_window
#property indicator_buffers 8
#property indicator_color1 C'162,208,162'
#property indicator_color2 C' 90,185, 90'
#property indicator_color3 C' 23,139, 23'
#property indicator_color4 C'255,255,255'
#property indicator_color5 C'255,185,185'
#property indicator_color6 C'255,115,115'
#property indicator_color7 C'255, 76, 76'
#property indicator_color8 C'255, 32, 32'

string indicator1="#SVM_b4_dd_pred2";
//extern int    Periode=10;
//extern bool   invert_strength =  0;
//extern string CurrencyPair    = "";
//extern string NOTE0 = "enter currencypair in uppercase";
//extern string NOTE1 = "like EURUSD";
//extern string NOTE2 = "leave empty for current symbol";
//extern string NOTE3 = "if you have a mini account";
//extern string NOTE4 = "add a \"m\"  e.g EURUSDm ";

//----------


//---- buffers
   double     ExtBuffer0[];
   double     ExtBuffer1[];
   double     ExtBuffer2[];
   double     ExtBuffer3[];
   double     ExtBuffer4[];
   double     ExtBuffer5[];
   double     ExtBuffer6[];
   double     ExtBuffer7[];
   double     ExtBuffer8[];


//+------------------------------------------------------------------+
//+------------------------------------------------------------------+
int init()
{
   SetIndexBuffer(0,ExtBuffer0);
   SetIndexBuffer(1,ExtBuffer1);
   SetIndexBuffer(2,ExtBuffer2);
   SetIndexBuffer(3,ExtBuffer3);
   SetIndexBuffer(4,ExtBuffer4);
   SetIndexBuffer(5,ExtBuffer5);
   SetIndexBuffer(6,ExtBuffer6);
   SetIndexBuffer(7,ExtBuffer7);

   SetIndexStyle(0,DRAW_HISTOGRAM, EMPTY, 5);
   SetIndexStyle(1,DRAW_HISTOGRAM, EMPTY, 5);
   SetIndexStyle(2,DRAW_HISTOGRAM, EMPTY, 5);
   SetIndexStyle(3,DRAW_HISTOGRAM, EMPTY, 5);
   SetIndexStyle(4,DRAW_HISTOGRAM, EMPTY, 5);
   SetIndexStyle(5,DRAW_HISTOGRAM, EMPTY, 5);
   SetIndexStyle(6,DRAW_HISTOGRAM, EMPTY, 5);
   SetIndexStyle(7,DRAW_HISTOGRAM, EMPTY, 5);

   //for (int i=0;i<indicator_buffers;i++) SetIndexLabel(i,NULL);

   //if (CurrencyPair == "") CurrencyPair = Symbol();
   //if (iClose(CurrencyPair,0,0) == 0)
   //           CurrencyPair = Symbol();
   //IndicatorShortName(CurrencyPair+"("+Periode+")");
   return(1);
}

int deinit()
  {
   return(0);
  }
//+------------------------------------------------------------------+
//+------------------------------------------------------------------+
int start()
  {


   int    counted_bars=IndicatorCounted();

//---- check for possible errors
   if (counted_bars<0) return(-1);
//---- last counted bar will be recounted
   if (counted_bars>0) counted_bars--;

   int    pos=Bars-counted_bars;


   double ddraw;


//---- main calculation loop
   while(pos>=0)
     {
        ddraw= iCustom(Symbol(),0,indicator1,6,pos);
         //if (invert_strength==1)
         //    ddraw=ddraw-(ddraw-50)*2;             //---- Inversion of the RSI
          //   1     2     3     4    5    6    7
          //-2.9  -1.9  -0.9   0.1  1.1  2.1  3.1
         if(ddraw==1.1 )           //---- RSI <= 48 draws RED blocks
         {
                //Print("----> -0.9");
                //        1 2 3 4 5 6 7 8
                drawblock(0,0,0,0,5,0,0,0,pos);
                //        1 2 3 4 5 6 7 8
                //drawblock(0,0,0,0,0,5,0,0,pos);
                //        1 2 3 4 5 6 7 8
                //drawblock(0,0,0,0,0,0,5,0,pos);
                //        1 2 3 4 5 6 7 8
                //drawblock(0,0,0,0,0,0,0,5,pos);
          }
          //   1     2     3     4    5    6    7
          //-2.9  -1.9  -0.9   0.1  1.1  2.1  3.1
         else if(ddraw==2.1 )           //---- RSI <= 48 draws RED blocks
         {
                //Print("----> -0.9");
                //        1 2 3 4 5 6 7 8
                //drawblock(0,0,0,0,5,0,0,0,pos);
                //        1 2 3 4 5 6 7 8
                drawblock(0,0,0,0,0,5,0,0,pos);
                //        1 2 3 4 5 6 7 8
                //drawblock(0,0,0,0,0,0,5,0,pos);
                //        1 2 3 4 5 6 7 8
                //drawblock(0,0,0,0,0,0,0,5,pos);
          }
          //   1     2     3     4    5    6    7
          //-2.9  -1.9  -0.9   0.1  1.1  2.1  3.1
         else if(ddraw==3.1 )           //---- RSI <= 48 draws RED blocks
         {
                //Print("----> -0.9");
                //        1 2 3 4 5 6 7 8
                //drawblock(0,0,0,0,5,0,0,0,pos);
                //        1 2 3 4 5 6 7 8
                //drawblock(0,0,0,0,0,5,0,0,pos);
                //        1 2 3 4 5 6 7 8
                drawblock(0,0,0,0,0,0,5,0,pos);
                //        1 2 3 4 5 6 7 8
                //drawblock(0,0,0,0,0,0,0,5,pos);
          }
          //   1     2     3     4    5    6    7
          //-2.9  -1.9  -0.9   0.1  1.1  2.1  3.1
          else if(ddraw==5.1)     //---- RSI >= 52 draws green blocks
          {
                //Print("----> 1.1");
                //        1 2 3 4 5 6 7 8
                //drawblock(5,0,0,0,0,0,0,0,pos);
                //        1 2 3 4 5 6 7 8
                //drawblock(0,5,0,0,0,0,0,0,pos);
                //        1 2 3 4 5 6 7 8
                drawblock(0,0,5,0,0,0,0,0,pos);
          }
          //   1     2     3     4    5    6    7
          //-2.9  -1.9  -0.9   0.1  1.1  2.1  3.1
         else if(ddraw==6.1)     //---- RSI >= 52 draws green blocks
          {
                //Print("----> 1.1");
                //        1 2 3 4 5 6 7 8
                //drawblock(5,0,0,0,0,0,0,0,pos);
                //        1 2 3 4 5 6 7 8
                drawblock(0,5,0,0,0,0,0,0,pos);
                //        1 2 3 4 5 6 7 8
                //drawblock(0,0,5,0,0,0,0,0,pos);
          }
          //   1     2     3     4    5    6    7
          //-2.9  -1.9  -0.9   0.1  1.1  2.1  3.1
         else if(ddraw==7.1)     //---- RSI >= 52 draws green blocks
          {
                //Print("----> 1.1");
                //        1 2 3 4 5 6 7 8
                drawblock(5,0,0,0,0,0,0,0,pos);
                //        1 2 3 4 5 6 7 8
                //drawblock(0,5,0,0,0,0,0,0,pos);
                //        1 2 3 4 5 6 7 8
                //drawblock(0,0,5,0,0,0,0,0,pos);
          }
          //   1     2     3     4    5    6    7
          //-2.9  -1.9  -0.9   0.1  1.1  2.1  3.1
          else  if(ddraw==4.1)
          {
                //Print("----> 0.1");
                //---- draw white block if there chart is ranging
                //        1 2 3 4 5 6 7 8
                drawblock(0,0,0,5,0,0,0,0,pos);
          }


         pos--;
     }
//----
   return(0);
  }

void drawblock(int a,int b,int c,int d,int e,int f,int g,int h,int pos)

{

               ExtBuffer0[pos]=a;
               ExtBuffer1[pos]=b;
               ExtBuffer2[pos]=c;
               ExtBuffer3[pos]=d;
               ExtBuffer4[pos]=e;
               ExtBuffer5[pos]=f;
               ExtBuffer6[pos]=g;
               ExtBuffer7[pos]=h;
}
Comments