multisymbol_color-RSI_LQ_1[1].0
Download script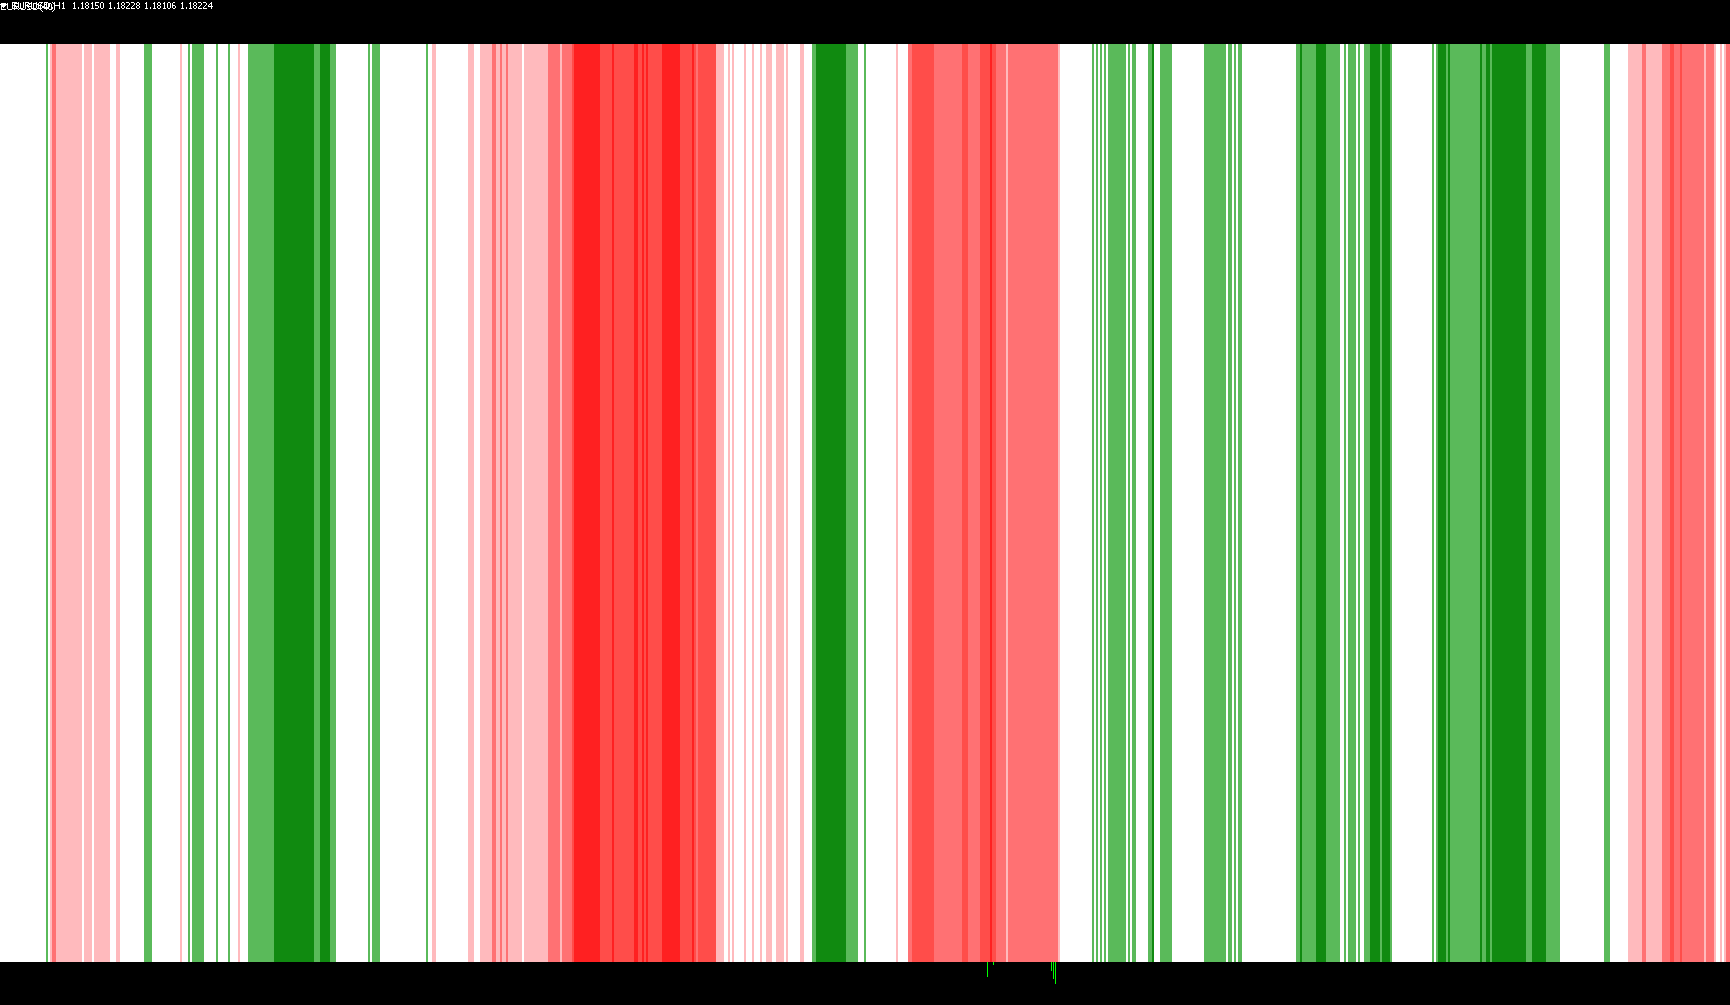
This tool is designed to provide a visual representation of market momentum by analyzing the Relative Strength Index (RSI) of a specific currency pair. Instead of showing you the standard, sometimes cluttered RSI line, this script translates those numerical values into a color-coded histogram that helps you identify market sentiment at a glance.
Core Functionality
The logic works by monitoring the "strength" of price movements over a user-defined period (defaulting to 40). It evaluates where the current price action sits relative to a central equilibrium point and translates that position into specific colors:
- Green Shades (Bullish Momentum): When the market shows positive strength, the tool uses different shades of green. The specific shade depends on how high the momentum is; as the value climbs further above the midpoint, the color intensity changes to reflect stronger upward movement.
- Red Shades (Bearish Momentum): Conversely, when the market shows negative strength, the tool uses various shades of red. Similar to the bullish side, these colors shift based on how deep the price action falls below the midpoint, indicating the severity of the downward trend.
- White/Neutral (Ranging Market): If the momentum is relatively flat and hovering near the middle—neither showing significant strength nor weakness—the tool displays a white block. This signifies a "ranging" or neutral market state.
Key Features for Users
- Multi-Symbol Capability: While you are looking at one chart, you can configure the script to display the data of a different currency pair by entering its name in the settings.
- Inversion Toggle: The logic includes an "invert strength" option, which allows you to flip the readings if you prefer to view the market momentum from an opposite perspective.
- Visual Clarity: By using a histogram of colored blocks rather than a standard line, the tool allows for a quicker psychological interpretation of the market: Red means pressure is downward, Green means pressure is upward, and White means the market is undecided.
Price Data Components
Indicators Used
Miscellaneous
8
Views
0
Downloads
0
Favorites
multisymbol_color-RSI_LQ_1[1].0
//+------------------------------------------------------------------+
//|                                     multisymbol_color-RSI_1.0.mq4 |
//|                                                      Lq_sunshine |
//|                                         http://www.forex-tsd.com |
//+------------------------------------------------------------------+

#property indicator_separate_window
#property indicator_buffers 8
#property indicator_color1 C'162,208,162'
#property indicator_color2 C' 90,185, 90'
#property indicator_color3 C' 23,139, 23'
#property indicator_color4 C'255,255,255'
#property indicator_color5 C'255,185,185'
#property indicator_color6 C'255,115,115'
#property indicator_color7 C'255, 76, 76'
#property indicator_color8 C'255, 32, 32'


extern int    Periode=40;
extern bool   invert_strength =  0;
extern string CurrencyPair    = "";
extern string NOTE0 = "enter currencypair in uppercase";
extern string NOTE1 = "like EURUSD";
extern string NOTE2 = "leave empty for current symbol";
extern string NOTE3 = "if you have a mini account";
extern string NOTE4 = "add a \"m\"  e.g EURUSDm ";

//---- buffers
   double     ExtBuffer0[];
   double     ExtBuffer1[];
   double     ExtBuffer2[];
   double     ExtBuffer3[];
   double     ExtBuffer4[];
   double     ExtBuffer5[];
   double     ExtBuffer6[];
   double     ExtBuffer7[];
   double     ExtBuffer8[];


//+------------------------------------------------------------------+
//+------------------------------------------------------------------+
int init()
{
   SetIndexBuffer(0,ExtBuffer0);
   SetIndexBuffer(1,ExtBuffer1);
   SetIndexBuffer(2,ExtBuffer2);
   SetIndexBuffer(3,ExtBuffer3);
   SetIndexBuffer(4,ExtBuffer4);
   SetIndexBuffer(5,ExtBuffer5);
   SetIndexBuffer(6,ExtBuffer6);
   SetIndexBuffer(7,ExtBuffer7);

   SetIndexStyle(0,DRAW_HISTOGRAM, EMPTY, 4, C'162,208,162');
   SetIndexStyle(1,DRAW_HISTOGRAM, EMPTY, 4, C'90,185,90');
   SetIndexStyle(2,DRAW_HISTOGRAM, EMPTY, 4, C'23,139,23');
   SetIndexStyle(3,DRAW_HISTOGRAM, EMPTY, 4, C'255,255,255');
   SetIndexStyle(4,DRAW_HISTOGRAM, EMPTY, 4, C'255,185,185');
   SetIndexStyle(5,DRAW_HISTOGRAM, EMPTY, 4, C'255,115,115');
   SetIndexStyle(6,DRAW_HISTOGRAM, EMPTY, 4, C'255,76,76');
   SetIndexStyle(7,DRAW_HISTOGRAM, EMPTY, 4, C'255,32,32');

   for (int i=0;i<indicator_buffers;i++) SetIndexLabel(i,NULL);

   if (CurrencyPair == "") CurrencyPair = Symbol();
   if (iClose(CurrencyPair,0,0) == 0)
              CurrencyPair = Symbol();
   IndicatorShortName(CurrencyPair+"("+Periode+")");
   return(1);
}

int deinit()
  {
   return(0);
  }
//+------------------------------------------------------------------+
//+------------------------------------------------------------------+
int start()
  {


   int    counted_bars=IndicatorCounted();

//---- check for possible errors
   if (counted_bars<0) return(-1);
//---- last counted bar will be recounted
   if (counted_bars>0) counted_bars--;

   int    pos=Bars-counted_bars;


   double ddraw;


//---- main calculation loop
   while(pos>=0)
     {
         ddraw= iRSI(CurrencyPair,0,Periode,PRICE_CLOSE,pos);
         if (invert_strength==1)
             ddraw=ddraw-(ddraw-50)*2;             //---- Inversion of the RSI

         if(ddraw<=48)           //---- RSI <= 48 draws RED blocks

             if(ddraw<=48&&ddraw>44)
                drawblock(0,0,0,0,5,0,0,0,pos);

                  else if(ddraw<=44&&ddraw>39)
                          drawblock(0,0,0,0,0,5,0,0,pos);

                         else if(ddraw<=39&&ddraw>35)
                                drawblock(0,0,0,0,0,0,5,0,pos);

                          else
                               drawblock(0,0,0,0,0,0,0,5,pos);


          else if(ddraw>=52)     //---- RSI >= 52 draws green blocks

               if(ddraw>52&&ddraw<56)
                  drawblock(5,0,0,0,0,0,0,0,pos);

              else if(ddraw>=56&&ddraw<60)
                      drawblock(0,5,0,0,0,0,0,0,pos);
                  else
                      drawblock(0,0,5,0,0,0,0,0,pos);

             else
              drawblock(0,0,0,5,0,0,0,0,pos);     //---- draw white block if there chart is ranging


         pos--;
     }
//----
   return(0);
  }

void drawblock(int a,int b,int c,int d,int e,int f,int g,int h,int pos)

{

               ExtBuffer0[pos]=a;
               ExtBuffer1[pos]=b;
               ExtBuffer2[pos]=c;
               ExtBuffer3[pos]=d;
               ExtBuffer4[pos]=e;
               ExtBuffer5[pos]=f;
               ExtBuffer6[pos]=g;
               ExtBuffer7[pos]=h;
}
Comments