#SVM_b4_dd_pred5_
Download script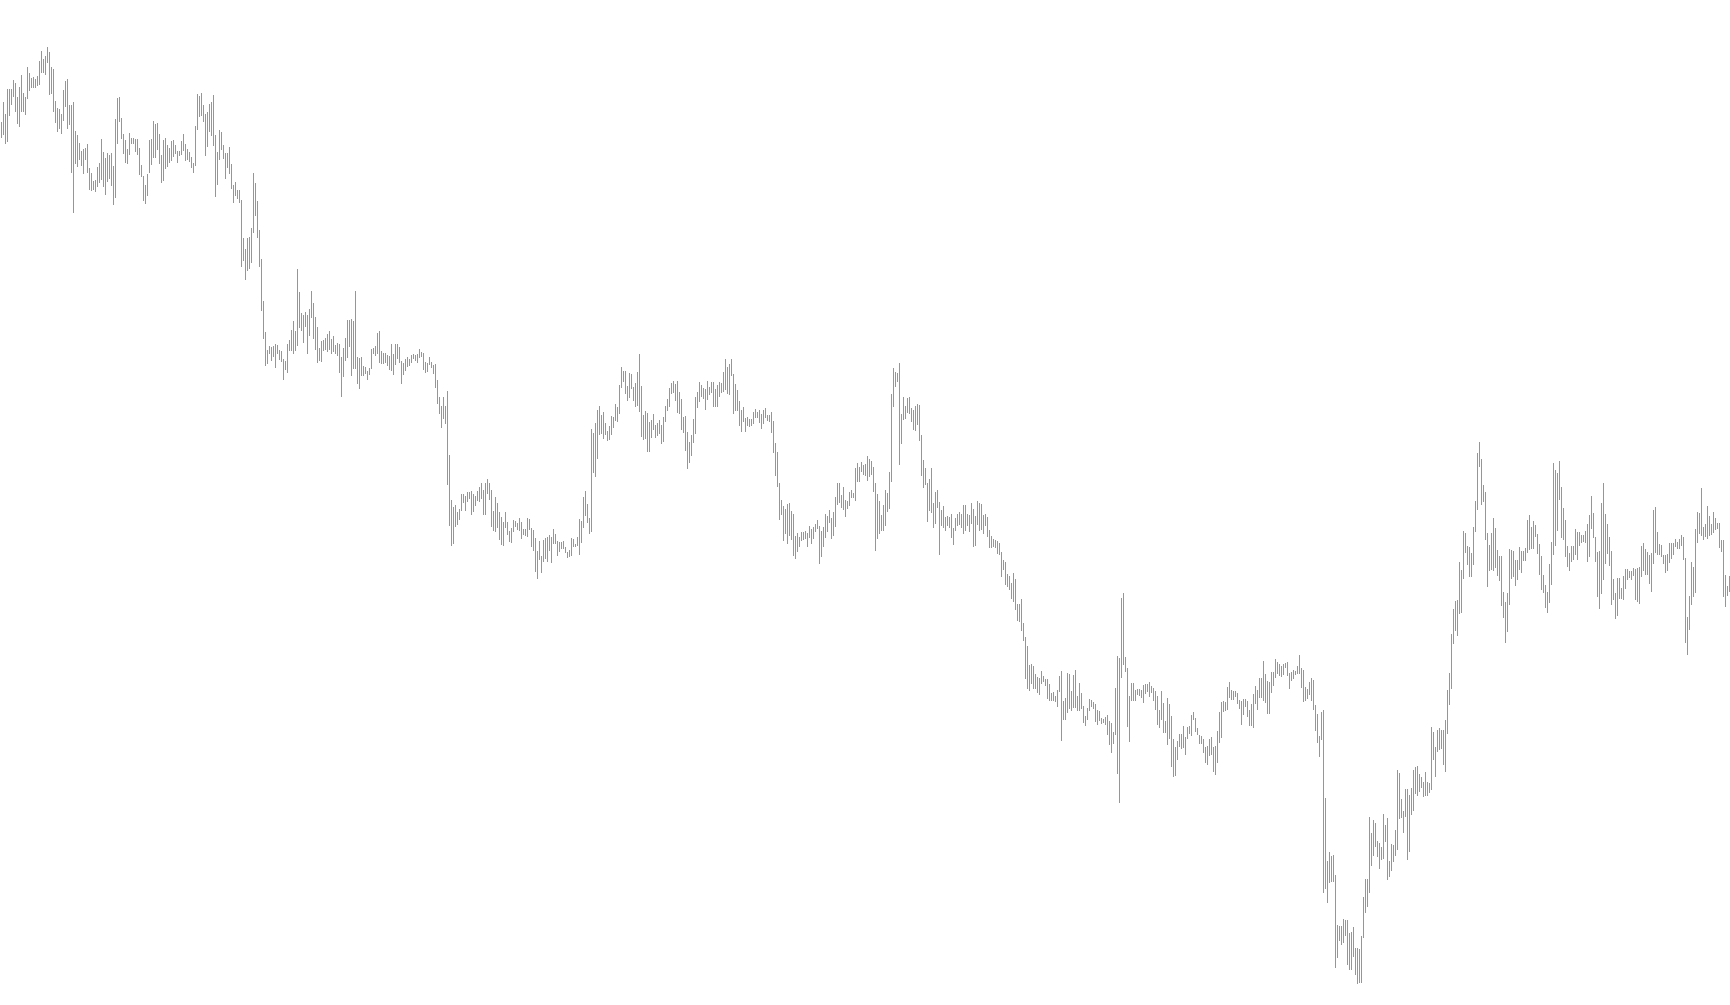
This script is designed as a visual market analysis tool for MetaTrader. Its primary function is to translate complex Relative Strength Index (RSI) data into a simplified, color-coded visual layout on your trading chart. Instead of making you interpret raw numbers or oscillating lines, it converts market momentum into specific colored blocks that help identify trends at a glance.
How the Logic Works
The tool functions by scanning the price history and interacting with an underlying technical indicator to pull "strength" values. It then categorizes these values into four distinct visual states:
- Bullish Momentum (Green): When the data indicates strong upward momentum, the script identifies specific thresholds and populates the chart with green blocks. These serve as a visual cue that the market may be experiencing positive pressure.
- Bearish Momentum (Red): Conversely, when the data suggests significant downward pressure, the script triggers red blocks. This provides an immediate visual warning of bearish sentiment.
- Neutral/Ranging Markets (White): The logic includes a specific condition to detect "ranging" behavior—periods where the market isn't moving strongly in either direction. During these times, it displays white blocks to signal that the market may be consolidating or moving sideways.
- Multi-Layered Visualization: The script is designed to manage multiple visual layers simultaneously. It can plot different combinations of these colored blocks across various "buffers," allowing for a more nuanced representation of the data than a single line could provide.
User Experience Summary
For a trader, the logic simplifies the decision-making process:
- Scanning: The script automatically processes the history of the current symbol.
- Filtering: It filters out the "noise" of the RSI and looks for specific intensity levels.
- Mapping: It maps those levels to a visual language (Red, Green, and White).
- Display: You receive a clean, color-coded histogram that allows you to quickly see where the trend stands without needing to manually calculate technical values.
Miscellaneous
6
Views
0
Downloads
0
Favorites
#SVM_b4_dd_pred5_
//+------------------------------------------------------------------+
//|                                     multisymbol_color-RSI_1.0.mq4 |
//|                                                      Lq_sunshine |
//|                                         http://www.forex-tsd.com |
//+------------------------------------------------------------------+
//#property indicator_chart_window
#property indicator_separate_window
#property indicator_buffers 8
#property indicator_color1 C'162,208,162'
#property indicator_color2 C' 90,185, 90'
#property indicator_color3 C' 23,139, 23'
#property indicator_color4 C'255,255,255'
#property indicator_color5 C'255,185,185'
#property indicator_color6 C'255,115,115'
#property indicator_color7 C'255, 76, 76'
#property indicator_color8 C'255, 32, 32'

string indicator1="#SVM_b4_dd_pred5";
//extern int    Periode=10;
//extern bool   invert_strength =  0;
//extern string CurrencyPair    = "";
//extern string NOTE0 = "enter currencypair in uppercase";
//extern string NOTE1 = "like EURUSD";
//extern string NOTE2 = "leave empty for current symbol";
//extern string NOTE3 = "if you have a mini account";
//extern string NOTE4 = "add a \"m\"  e.g EURUSDm ";

//----------


//---- buffers
   double     ExtBuffer0[];
   double     ExtBuffer1[];
   double     ExtBuffer2[];
   double     ExtBuffer3[];
   double     ExtBuffer4[];
   double     ExtBuffer5[];
   double     ExtBuffer6[];
   double     ExtBuffer7[];
   double     ExtBuffer8[];


//+------------------------------------------------------------------+
//+------------------------------------------------------------------+
int init()
{
   SetIndexBuffer(0,ExtBuffer0);
   SetIndexBuffer(1,ExtBuffer1);
   SetIndexBuffer(2,ExtBuffer2);
   SetIndexBuffer(3,ExtBuffer3);
   SetIndexBuffer(4,ExtBuffer4);
   SetIndexBuffer(5,ExtBuffer5);
   SetIndexBuffer(6,ExtBuffer6);
   SetIndexBuffer(7,ExtBuffer7);

   SetIndexStyle(0,DRAW_HISTOGRAM, EMPTY, 5);
   SetIndexStyle(1,DRAW_HISTOGRAM, EMPTY, 5);
   SetIndexStyle(2,DRAW_HISTOGRAM, EMPTY, 5);
   SetIndexStyle(3,DRAW_HISTOGRAM, EMPTY, 5);
   SetIndexStyle(4,DRAW_HISTOGRAM, EMPTY, 5);
   SetIndexStyle(5,DRAW_HISTOGRAM, EMPTY, 5);
   SetIndexStyle(6,DRAW_HISTOGRAM, EMPTY, 5);
   SetIndexStyle(7,DRAW_HISTOGRAM, EMPTY, 5);

   //for (int i=0;i<indicator_buffers;i++) SetIndexLabel(i,NULL);

   //if (CurrencyPair == "") CurrencyPair = Symbol();
   //if (iClose(CurrencyPair,0,0) == 0)
   //           CurrencyPair = Symbol();
   //IndicatorShortName(CurrencyPair+"("+Periode+")");
   return(1);
}

int deinit()
  {
   return(0);
  }
//+------------------------------------------------------------------+
//+------------------------------------------------------------------+
int start()
  {


   int    counted_bars=IndicatorCounted();

//---- check for possible errors
   if (counted_bars<0) return(-1);
//---- last counted bar will be recounted
   if (counted_bars>0) counted_bars--;

   int    pos=Bars-counted_bars;


   double ddraw;


//---- main calculation loop
   while(pos>=0)
     {
        ddraw= iCustom(Symbol(),0,indicator1,6,pos);
         //if (invert_strength==1)
         //    ddraw=ddraw-(ddraw-50)*2;             //---- Inversion of the RSI
          //   1     2     3     4    5    6    7
          //-2.9  -1.9  -0.9   0.1  1.1  2.1  3.1
         if(ddraw==1.1 )           //---- RSI <= 48 draws RED blocks
         {
                //Print("----> -0.9");
                //        1 2 3 4 5 6 7 8
                drawblock(0,0,0,0,5,0,0,0,pos);
                //        1 2 3 4 5 6 7 8
                //drawblock(0,0,0,0,0,5,0,0,pos);
                //        1 2 3 4 5 6 7 8
                //drawblock(0,0,0,0,0,0,5,0,pos);
                //        1 2 3 4 5 6 7 8
                //drawblock(0,0,0,0,0,0,0,5,pos);
          }
          //   1     2     3     4    5    6    7
          //-2.9  -1.9  -0.9   0.1  1.1  2.1  3.1
         else if(ddraw==2.1 )           //---- RSI <= 48 draws RED blocks
         {
                //Print("----> -0.9");
                //        1 2 3 4 5 6 7 8
                //drawblock(0,0,0,0,5,0,0,0,pos);
                //        1 2 3 4 5 6 7 8
                drawblock(0,0,0,0,0,5,0,0,pos);
                //        1 2 3 4 5 6 7 8
                //drawblock(0,0,0,0,0,0,5,0,pos);
                //        1 2 3 4 5 6 7 8
                //drawblock(0,0,0,0,0,0,0,5,pos);
          }
          //   1     2     3     4    5    6    7
          //-2.9  -1.9  -0.9   0.1  1.1  2.1  3.1
         else if(ddraw==3.1 )           //---- RSI <= 48 draws RED blocks
         {
                //Print("----> -0.9");
                //        1 2 3 4 5 6 7 8
                //drawblock(0,0,0,0,5,0,0,0,pos);
                //        1 2 3 4 5 6 7 8
                //drawblock(0,0,0,0,0,5,0,0,pos);
                //        1 2 3 4 5 6 7 8
                drawblock(0,0,0,0,0,0,5,0,pos);
                //        1 2 3 4 5 6 7 8
                //drawblock(0,0,0,0,0,0,0,5,pos);
          }
          //   1     2     3     4    5    6    7
          //-2.9  -1.9  -0.9   0.1  1.1  2.1  3.1
          else if(ddraw==5.1)     //---- RSI >= 52 draws green blocks
          {
                //Print("----> 1.1");
                //        1 2 3 4 5 6 7 8
                //drawblock(5,0,0,0,0,0,0,0,pos);
                //        1 2 3 4 5 6 7 8
                //drawblock(0,5,0,0,0,0,0,0,pos);
                //        1 2 3 4 5 6 7 8
                drawblock(0,0,5,0,0,0,0,0,pos);
          }
          //   1     2     3     4    5    6    7
          //-2.9  -1.9  -0.9   0.1  1.1  2.1  3.1
         else if(ddraw==6.1)     //---- RSI >= 52 draws green blocks
          {
                //Print("----> 1.1");
                //        1 2 3 4 5 6 7 8
                //drawblock(5,0,0,0,0,0,0,0,pos);
                //        1 2 3 4 5 6 7 8
                drawblock(0,5,0,0,0,0,0,0,pos);
                //        1 2 3 4 5 6 7 8
                //drawblock(0,0,5,0,0,0,0,0,pos);
          }
          //   1     2     3     4    5    6    7
          //-2.9  -1.9  -0.9   0.1  1.1  2.1  3.1
         else if(ddraw==7.1)     //---- RSI >= 52 draws green blocks
          {
                //Print("----> 1.1");
                //        1 2 3 4 5 6 7 8
                drawblock(5,0,0,0,0,0,0,0,pos);
                //        1 2 3 4 5 6 7 8
                //drawblock(0,5,0,0,0,0,0,0,pos);
                //        1 2 3 4 5 6 7 8
                //drawblock(0,0,5,0,0,0,0,0,pos);
          }
          //   1     2     3     4    5    6    7
          //-2.9  -1.9  -0.9   0.1  1.1  2.1  3.1
          else  if(ddraw==4.1)
          {
                //Print("----> 0.1");
                //---- draw white block if there chart is ranging
                //        1 2 3 4 5 6 7 8
                drawblock(0,0,0,5,0,0,0,0,pos);
          }


         pos--;
     }
//----
   return(0);
  }

void drawblock(int a,int b,int c,int d,int e,int f,int g,int h,int pos)

{

               ExtBuffer0[pos]=a;
               ExtBuffer1[pos]=b;
               ExtBuffer2[pos]=c;
               ExtBuffer3[pos]=d;
               ExtBuffer4[pos]=e;
               ExtBuffer5[pos]=f;
               ExtBuffer6[pos]=g;
               ExtBuffer7[pos]=h;
}
Comments