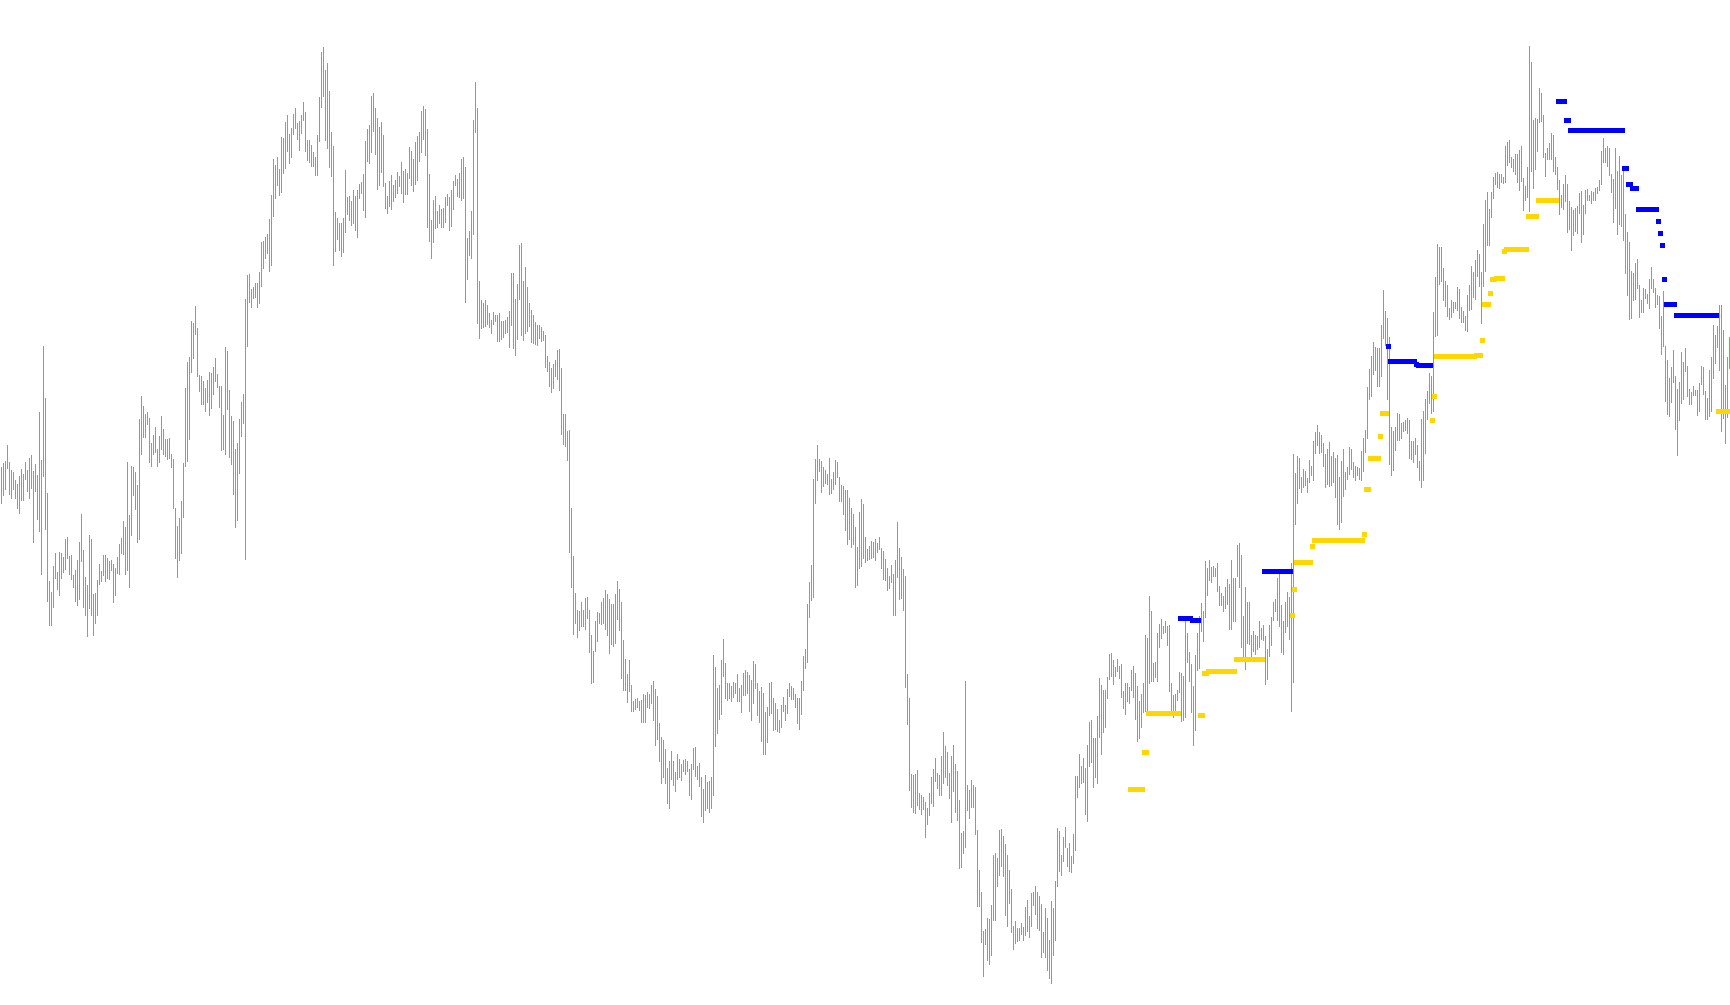
This tool is designed to help traders identify market trends and potential reversal points by analyzing price movement and volatility. It functions as a visual tracking system that monitors how the market behaves over a specific period of time to determine whether it is moving in a bullish (upward) or bearish (downward) direction.
Core Functionality
1. Volatility Calculation (WATR) The script first calculates a specialized volatility measure. Instead of just looking at the current price, it looks back at a set number of past candles to determine the "Average Range" (the distance between the highest and lowest prices).
- It applies a weighting system where more recent price data has a higher influence on the calculation than older data.
- The script includes specific adjustments for certain currency pairs (like JPY-related pairs) to ensure the volatility measurement is scaled correctly for those specific markets.
2. Trend Tracking Once it understands how much the market typically "wiggles" (volatility), it begins to track the trend:
- Upward Trend: If the price moves higher, the script attempts to maintain a bullish bias.
- Downward Trend: If the price moves lower, it maintains a bearish bias.
- The logic is designed to "hold" its position until a significant enough price movement occurs to suggest that the trend has actually changed.
3. Dynamic Thresholds and Reversals The tool doesn't just change direction based on a single small move. It uses the volatility calculation to create a "buffer" or a dynamic threshold. For example, in an uptrend, it looks for the price to drop below a certain calculated level before it signals a switch to a downtrend (and vice versa). This helps filter out minor market noise and only highlights more significant shifts in momentum.
Visual Output
The script translates these calculations into visual markers on your chart:
- Blue Markers: Represent periods where the logic identifies an upward trend.
- Red Markers: Represent periods where the logic identifies a downward trend.
By providing these visual cues, the tool allows you to see at a glance where the momentum has shifted, helping you stay aligned with the prevailing market direction based on historical volatility and price action.
//+------------------------------------------------------------------+
//|                                                    NRTR WATR.mq4 |
//|                                        Ramdass - Conversion only |
//+------------------------------------------------------------------+

#property indicator_chart_window
#property indicator_buffers 2
#property indicator_color1 Blue
#property indicator_color2 Red
//---- input parameters
extern int AveragePeriod = 10;
extern int Variant = 2;
extern int CountBars = 300;
//---- buffers
double value1[];
double value2[];
//+------------------------------------------------------------------+
//| Custom indicator initialization function                         |
//+------------------------------------------------------------------+
int init()
  {
//---- indicator line
   IndicatorBuffers(2);
   SetIndexStyle(0, DRAW_ARROW);
   SetIndexArrow(0, 167);
   SetIndexStyle(1, DRAW_ARROW);
   SetIndexArrow(1, 167);
   SetIndexBuffer(0, value1);
   SetIndexBuffer(1, value2);
//----
   if(CountBars >= Bars)
       CountBars = Bars - AveragePeriod - 2;
   SetIndexDrawBegin(0, Bars - CountBars + 1);
   SetIndexDrawBegin(1, Bars - CountBars + 1);
//----
   return(0);
  }
//+------------------------------------------------------------------+
//| NRTR WATR                                                        |
//+------------------------------------------------------------------+
int start()
  {
   int i, i2, bar, counted_bars = IndicatorCounted();
   double value, WATR;
   double trend = 1, dK, AvgRange, price, AveragePeriod_D;
   AveragePeriod_D = AveragePeriod;
//----
   if(Bars <= AveragePeriod)
       return(0);
//---- initial zero
   if(counted_bars < 1)
     {
       for(i = 1; i <= AveragePeriod; i++)
           value1[Bars-i] = 0.0;
       for(i = 1; i <= AveragePeriod; i++)
           value2[Bars-i] = 0.0;
     }
   AvgRange = 0;
   if((Variant == 2) || (Variant == 3))
     {
       for(i=AveragePeriod; i>=1; i--)
         {
           dK = 1 + (AveragePeriod_D - i) / AveragePeriod_D;
           AvgRange = AvgRange + dK*MathAbs(High[i] - Low[i]);
         }
       if(Symbol() == "USDJPY" || Symbol() == "GBPJPY" || Symbol() == "EURJPY")
         {
           WATR = AvgRange / AveragePeriod_D / 100;
         }
       else
         {
           WATR = AvgRange / AveragePeriod_D;
         }
     }
   if(Variant == 1)
     {
       for(i = 1; i <= AveragePeriod; i++)
         {
           dK = 1 + (AveragePeriod_D - i) / AveragePeriod_D;
           AvgRange = AvgRange + dK*MathAbs(High[CountBars + i] - Low[CountBars + i]);
          }
       WATR = AvgRange/AveragePeriod_D;
     }
   if(Close[CountBars-1] > Open[CountBars-1])
     {
       value1[CountBars - 1] = Close[CountBars - 1] * (1 - WATR);
       trend = 1;
       value2[CountBars - 1] = 0.0;
     }
   if(Close[CountBars-1] < Open[CountBars-1])
     {
       value2[CountBars - 1] = Close[CountBars - 1] * (1 + WATR);
       trend = -1; value1[CountBars - 1] = 0.0;
     }
   bar = CountBars;
   while(bar >= 0)
     {
       value1[bar] = 0.0;
       value2[bar] = 0.0;
       if(Variant == 3)
         {
           AvgRange = 0;
           for(i = 1; i <= AveragePeriod; i++)
             {
               dK = 1 + (AveragePeriod_D-i) / AveragePeriod_D;
               AvgRange = AvgRange + dK*MathAbs(High[bar + i] - Low[bar + i]);
             }
           WATR = AvgRange / AveragePeriod_D;
         }
       if(trend == 1)
         {
           if(Close[bar] > price) price = Close[bar];
           value = price * (1 - WATR);
           if(Close[bar] < value)
             {
               price = Close[bar];
               value = price * (1 + WATR);
               trend = -1;
             }
         }
       if(trend == -1)
         {
           if(Close[bar] < price)
               price = Close[bar];
           value = price * (1 + WATR);
           if(Close[bar] > value)
             {
               price = Close[bar];
               value = price * (1 - WATR);
               trend = 1;
             }
         }
       if(trend == 1)
         {
           value1[bar] = value;
           value2[bar] = 0.0;
         }
       if(trend == -1)
         {
           value2[bar] = value;
           value1[bar] = 0.0;
         }
       bar--;
     }
   return(0);
  }
//+------------------------------------------------------------------+
Comments