ATR_Channels
Indicator

ATR_Channels

iATRiMA

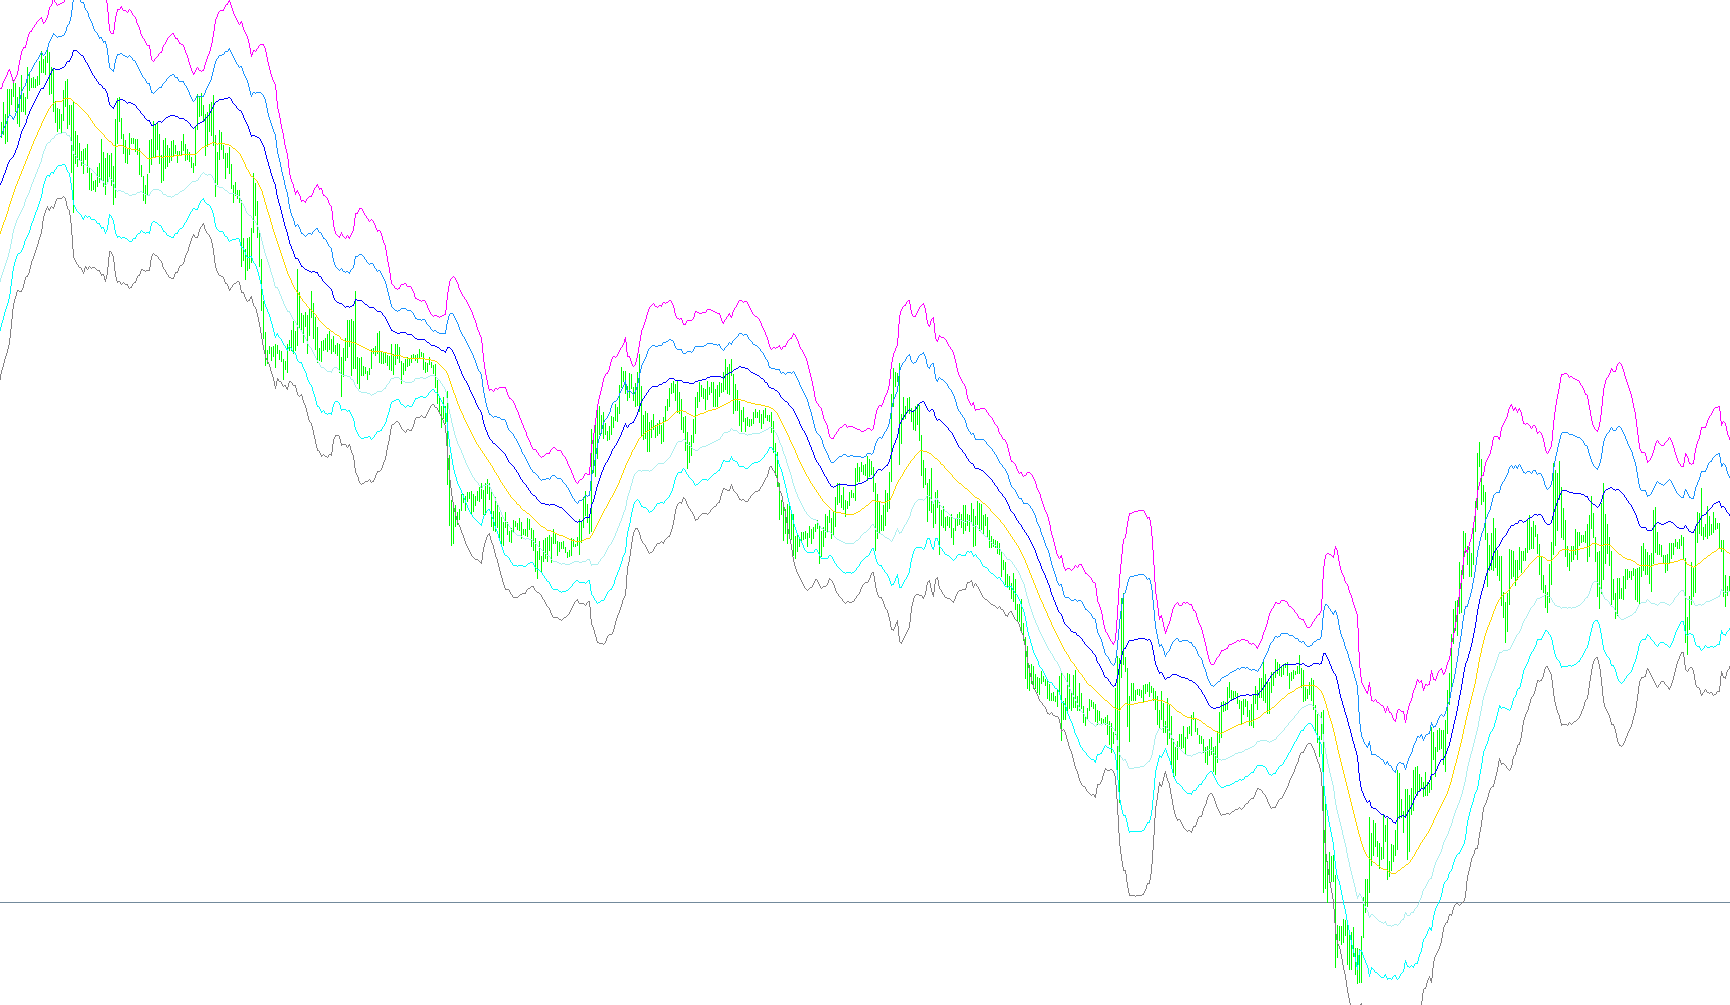
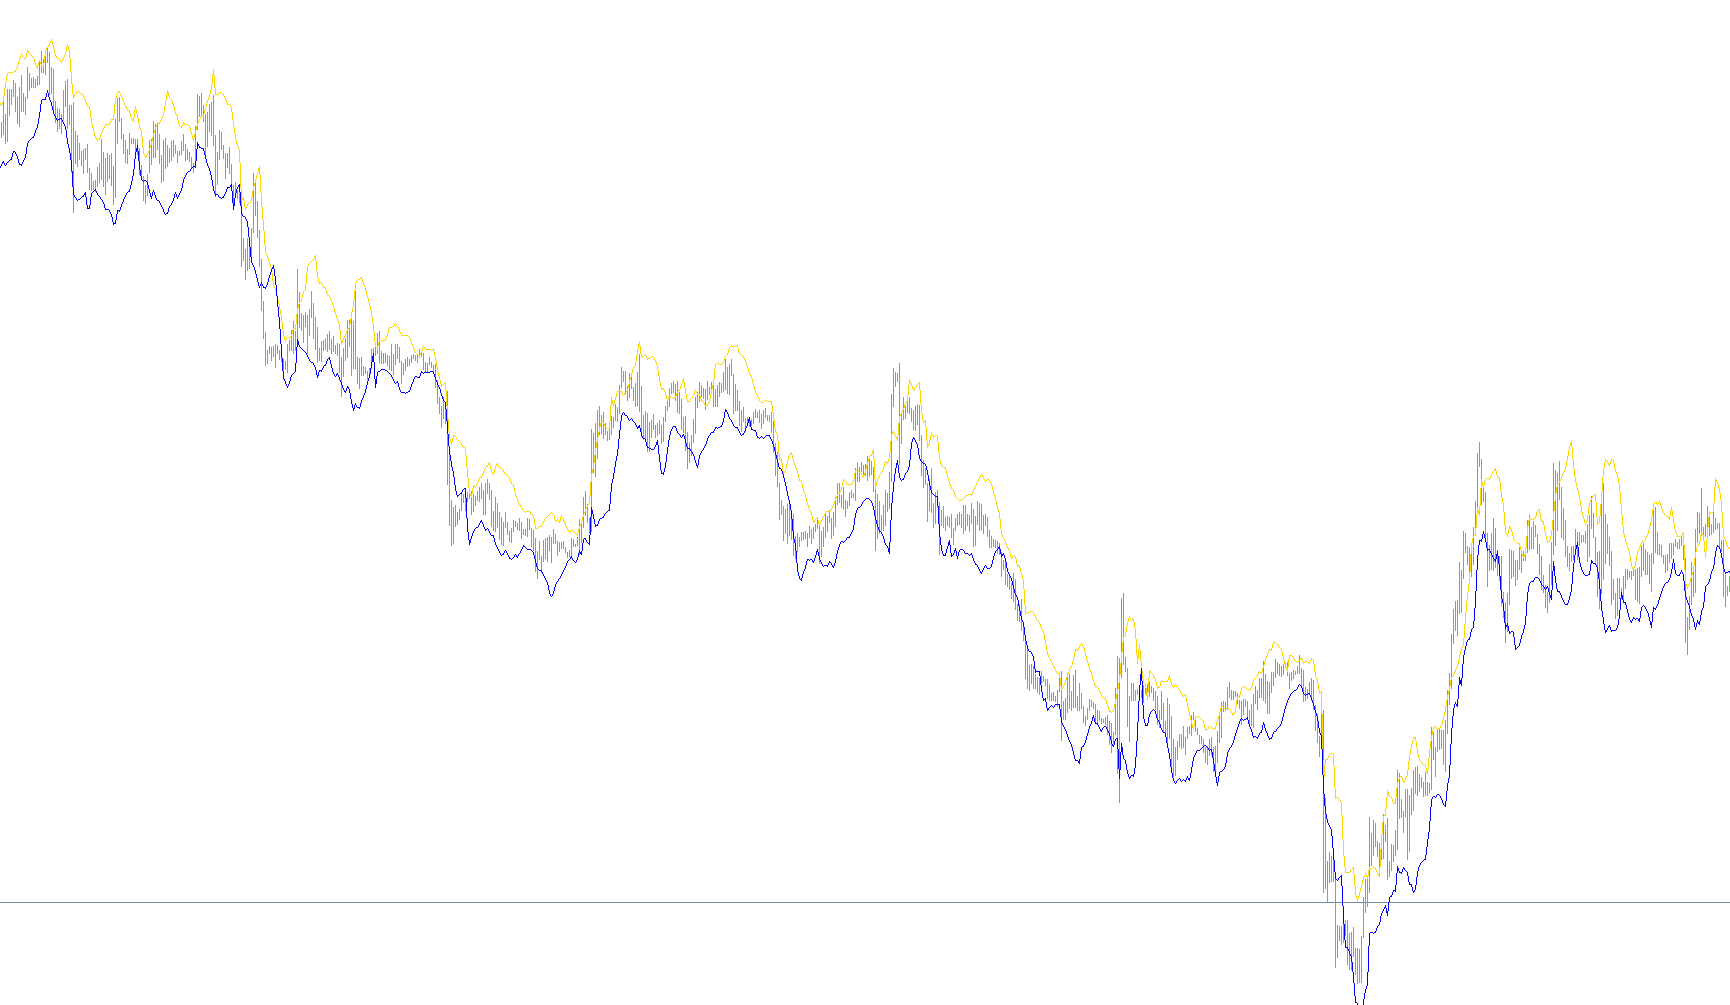
This indicator plots a central linear weighted moving average flanked by three distinct sets of expansion bands calculated via variable Average True Range multipliers.

ATR_Channels_VarTFs_mtf
Indicator

ATR_Channels_VarTFs_mtf

iATRiMA

This indicator projects triple volatility bands and a moving average by calculating Average True Range from higher timeframes relative to a secondary base timeframe.

ATR_Channels_VarTFs_mtf_TMA
Indicator

ATR_Channels_VarTFs_mtf_TMA

iATR

This indicator projects three nested volatility channels based on ATR variance and a centered moving average across multiple timeframes to visualize price expansion limits.

ATR_Chart_Daily
Indicator

ATR_Chart_Daily

iATR

This indicator extracts and displays the current and previous Average True Range values from the daily timeframe directly onto the chart as text objects.

atr_filter
Indicator

atr_filter

iATRiMAOnArray

This indicator identifies overarching market turbulence by applying a smoothed moving average to the Average True Range values.

ATR_Levels
Indicator

ATR_Levels

iATR

The indicator projects horizontal support and resistance levels by anchoring daily price extremes with ATR-based volatility offsets across different timeframes.

ATR_ratio
Indicator

ATR_ratio

iATR

Quantifies the relative magnitude of short-term price fluctuation against long-term variance to identify expansion phases.

ATR_Ratio_v1
Indicator

ATR_Ratio_v1

iATRiMAOnArray

This indicator calculates the relative ratio between a fast and slow Average True Range to identify momentum shifts in market volatility dynamics.

ATR_Ratio_v1a
Indicator

ATR_Ratio_v1a

iATRiMAOnArray

This indicator quantifies relative market turbulence by calculating the ratio between a fast and slow Average True Range, smoothed through a moving average to identify shifting volatility dynamics.

ATR_Ratio_v2
Indicator

ATR_Ratio_v2

iATRiStdDevOnArray

This indicator quantifies relative volatility dynamics by calculating the ratio between fast and slow Average True Range values, supplemented by a secondary standard deviation variance analysis.

ATR_SL_CHANEL
Indicator

ATR_SL_CHANEL

iATR

This indicator dynamically constructs upper and lower price boundaries by calculating the distance from the 10-period extreme price points using a multiplier of the Average True Range.

atr_value_indicator
Indicator

atr_value_indicator

iATR

This indicator calculates and visualizes the weighted average true range to provide a real-time measurement of market price fluctuations scaled to user-defined multipliers.

ATR_x2LHist_mtf
Indicator

ATR_x2LHist_mtf

iATR
ATR_x3LHist_mtf
Indicator

ATR_x3LHist_mtf

iATR

This indicator overlays three distinct Average True Range values across specified timeframes to visualize historical price expansion and volatility dynamics simultaneously.

A_info
Indicator

A_info

iATR

This indicator extracts and displays real-time statistical data including daily range, distance from opening price, average volatility, and transaction costs directly on the chart.
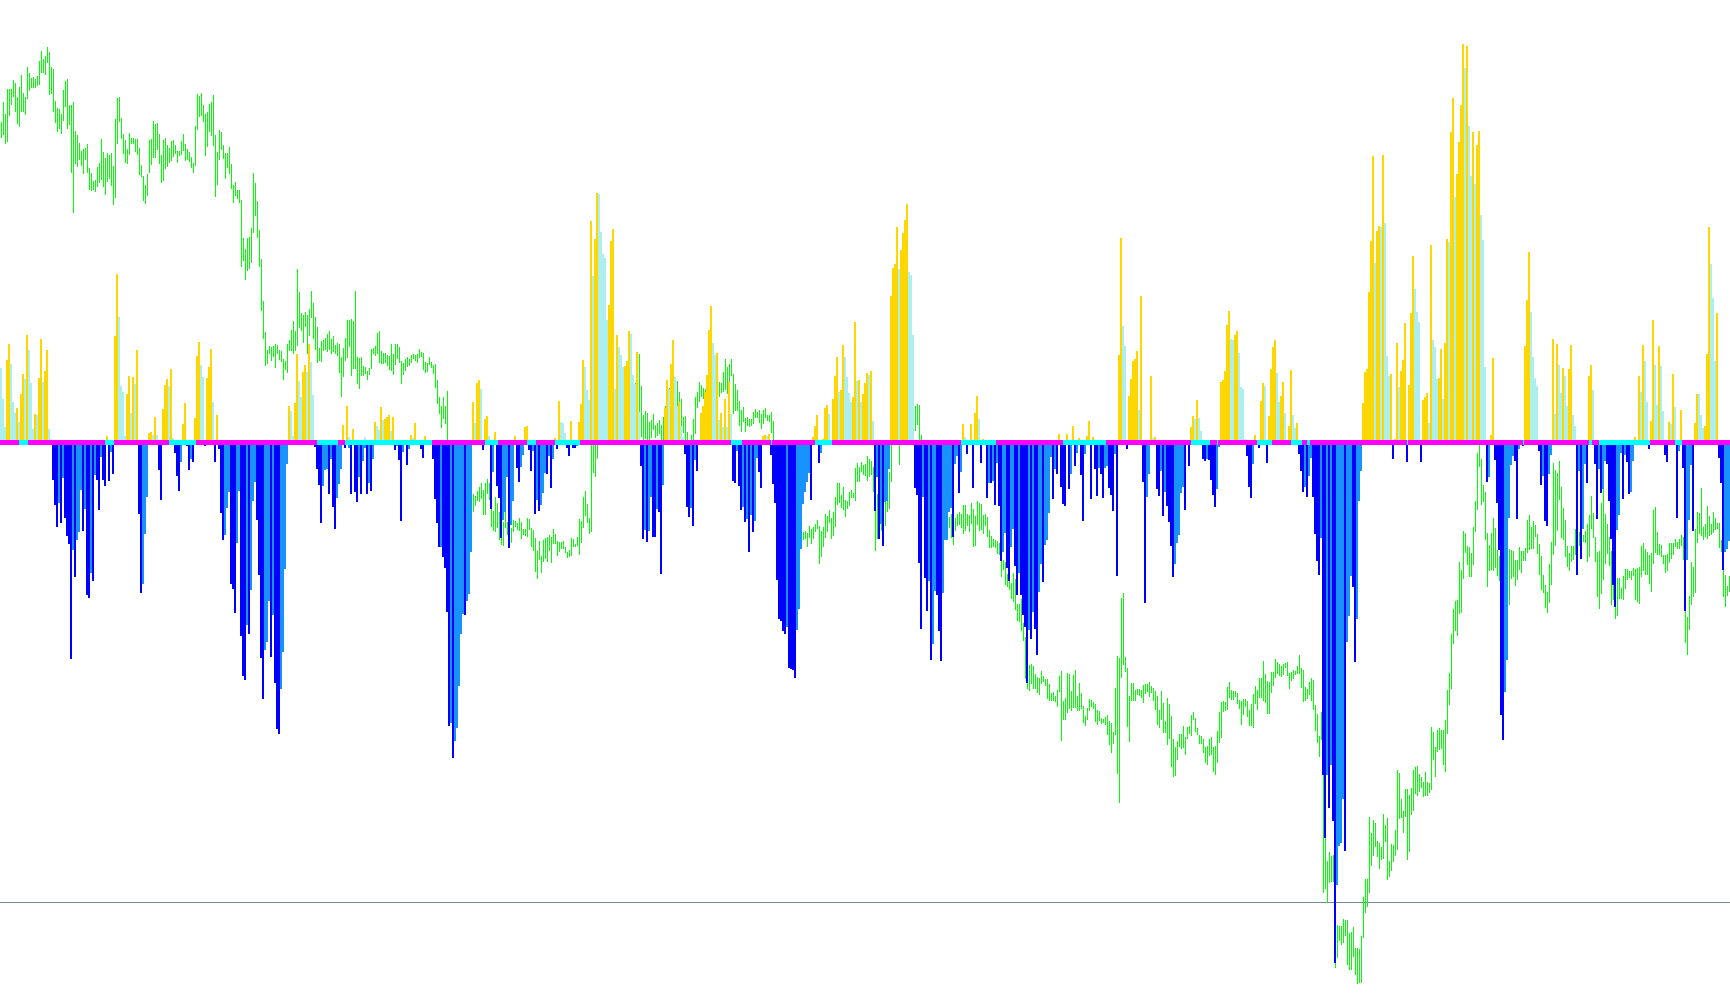
Bands+Fibo_True
Indicator

Bands+Fibo_True

iATRiMA

This indicator dynamically maps price action by projecting multiple Fibonacci-weighted expansion levels based on the Average True Range around a Simple Moving Average.
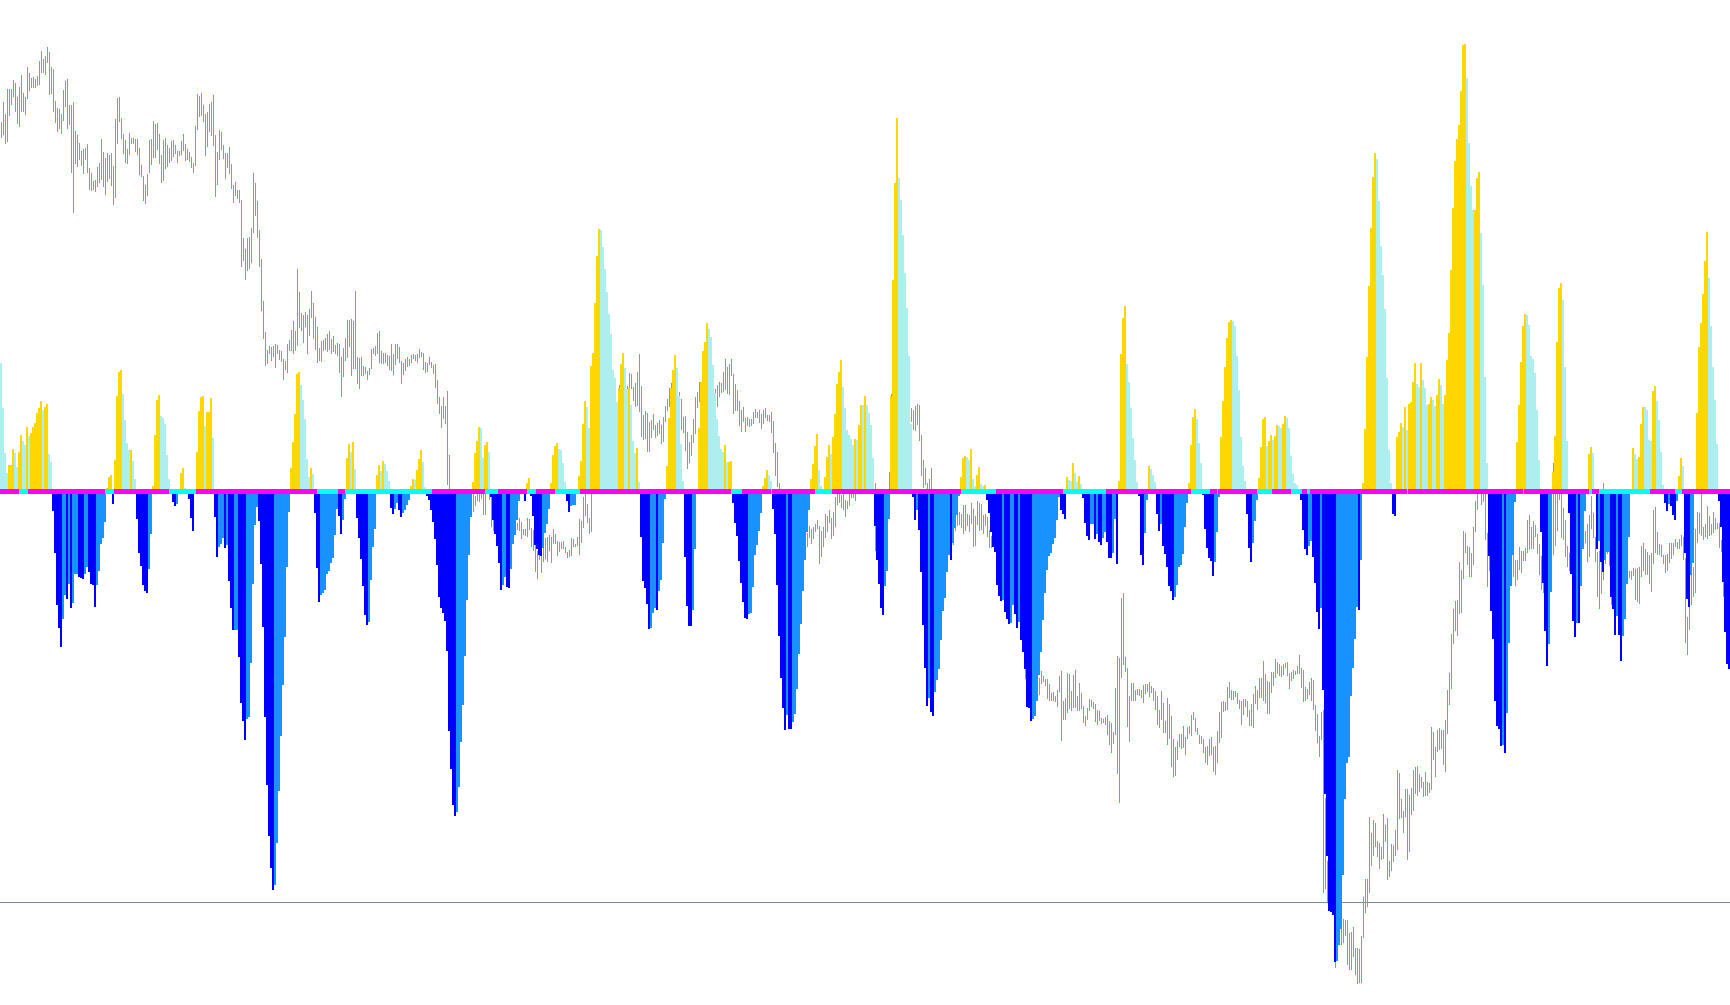
BAT ATR v1
Indicator

BAT ATR v1

iATR

This indicator dynamically plots support and resistance levels by calculating price offsets based on Average True Range volatility to capture trailing trend momentum.

BAT_ATRv1
Indicator

BAT_ATRv1

iATR

This indicator dynamically tracks price momentum by calculating asymmetrical support and resistance boundaries based on the Average True Range to lock in profits during trending moves.

bbhisto_sq
Indicator

bbhisto_sq

iATRiMAiStdDev

Identifies periods of extreme market stagnation by calculating the ratio between Bollinger Band standard deviation and ATR-based volatility to pinpoint potential breakout signals.

BbSq-OsMA
Indicator

BbSq-OsMA

iATRiOsMAiStdDev
Indicator

bbsqueeze w Alert

iATRiMAiStdDev
bbsqueeze
Indicator

bbsqueeze

iATRiMAiStdDev

This indicator identifies high-volatility expansion phases by measuring the ratio between Bollinger Band deviation and ATR-adjusted volatility, while using linear regression slopes to determine trend direction.

bbsqueeze1
Indicator

bbsqueeze1

iATRiMAiStdDev

Identifies high-probability breakout opportunities by monitoring the ratio between linear regression slopes and volatility-adjusted standard deviations.

bbsqueeze1_v1
Indicator

bbsqueeze1_v1

iATRiMAiStdDev

This indicator identifies market compression by calculating the ratio between Bollinger Band volatility and Keltner Channel range against a linear regression trend line.

bbsqueezemodified
Indicator

bbsqueezemodified

iATRiMAiStdDev

This indicator identifies high-probability breakout points by detecting price compression through a ratio of Bollinger Band deviation to ATR volatility combined with linear regression momentum.

bbsqueeze_001
Indicator

bbsqueeze_001

iATRiMAiStdDev

This indicator identifies high-probability trend reversals by detecting periods of low volatility relative to linear regression price action.

bbsqueeze_003
Indicator

bbsqueeze_003

iATRiMAiStdDev

This indicator identifies trend momentum using a custom linear regression slope while signaling potential volatility breakouts by comparing standard deviation against ATR-based price expansion.

bbsqueeze_dark
Indicator

bbsqueeze_dark

iATRiMAiStdDev

This indicator identifies volatility compression and expansion by cross-referencing linear regression trends with a modified Bollinger Band squeeze metric.

bbsqueeze_dark[1]
Indicator

bbsqueeze_dark[1]

iATRiMAiStdDev

This indicator identifies bullish and bearish trend momentum via linear regression analysis while flagging volatility squeezes using a ratio of standard deviation to adjusted ATR.

bbsqueeze_dark_001
Indicator

bbsqueeze_dark_001

iATRiMAiStdDev

This indicator identifies trend reversals and volatility contractions by comparing linear regression slopes against a normalized standard deviation ratio.

bbsqueeze_v1
Indicator

bbsqueeze_v1

iATRiMAiStdDev

This indicator identifies potential trend breakouts by calculating the ratio between Bollinger Band standard deviation and ATR-based volatility to detect price compression.

BB_FlatSq_mtf_sw
Indicator

BB_FlatSq_mtf_sw

iATRiMAiStdDev

This indicator identifies high-volatility expansion zones by calculating price deviations from moving averages while filtering for market compression using a Bollinger Squeeze logic.

BB_SqueezeLRSml_4c
Indicator

BB_SqueezeLRSml_4c

iATRiMAiStdDev

This indicator identifies volatility compression by calculating the ratio between Bollinger Band deviation and Keltner Channel width while mapping price momentum via linear regression slopes.

BB_SqueezeLRSm_4c
Indicator

BB_SqueezeLRSm_4c

iATRiMAiStdDev

This indicator identifies market volatility compression by comparing Keltner Channel width against Bollinger Band standard deviation while plotting linear regression slopes to detect directional momentum shifts.

BB_Squeeze_4c_JMA
Indicator

BB_Squeeze_4c_JMA

iATRiStdDev

This indicator identifies trend exhaustion and breakout potential by calculating the ratio between Bollinger Band standard deviation and ATR-based volatility, filtered through a Jurik Moving Average linear regression.

Indicator

BB_Squeeze_Advanced_v2

iCCIiMACDiRSIiStochastic
Indicator

BB_Squeeze_Advanced_v2M

iCCIiMACDiRSIiStochastic
Indicator

BB_Squeeze_Advanced_v2M2

iCCIiMACDiRSIiStochastic
Indicator

BB_Squeeze_Advanced_v2M3

iCCIiMACDiRSIiStochastic
Indicator

BB_Squeeze_Advanced_v2M3B

iCCIiMACDiRSIiStochastic
Indicator

BB_Squeeze_Advanced_v2M3BC

iCCIiMACDiRSIiStochastic
Indicator

BB_Squeeze_Advanced_v2_v1

iCCIiMACDiRSIiStochastic
BB_Sqz_sBar_mtf_sw
Indicator

BB_Sqz_sBar_mtf_sw

iATRiStdDev

This indicator identifies periods of low market volatility by detecting instances where the Bollinger Band width contracts below a specific threshold relative to the Keltner Channel.

Blur's Prices&Time
Indicator

Blur's Prices&Time

iCCIiATRiRSIiStochastic

This indicator dynamically visualizes real-time bid/ask prices and time stamps on the chart while dynamically color-coding them based on synchronized RSI, Stochastic, and CCI momentum thresholds.

Bollinger Squeeze Basic
Indicator

Bollinger Squeeze Basic

iATRiMomentumiStdDev

This indicator identifies market compression by comparing momentum deviations against ATR-adjusted standard deviation thresholds to detect potential explosive breakouts.

Bollinger Squeeze v3
Indicator

Bollinger Squeeze v3

iATRiMomentumiMAiStdDev

This indicator identifies market compression by calculating a volatility ratio between Standard Deviation and ATR while visualizing momentum shifts through comparative histogram bars.

Bollinger Squeeze v4
Indicator

Bollinger Squeeze v4

iATRiMAiStdDev

This indicator identifies potential volatility breakouts by measuring the ratio between Bollinger Band deviations and ATR-based fluctuations while tracking linear regression momentum shifts.

Bollinger Squeeze v4_001
Indicator

Bollinger Squeeze v4_001

iATRiMAiStdDev

This indicator identifies potential market breakouts by measuring the compression of price action using a ratio of Standard Deviation to Average True Range, overlaid with Linear Regression momentum histograms.

Bollinger Squeeze v4_v1
Indicator

Bollinger Squeeze v4_v1

iATRiMAiStdDev

This indicator identifies market compression and trend direction by calculating the ratio between standard deviation and ATR volatility while plotting a linear regression-based momentum histogram.

Indicator

Bollinger Squeeze v5

iCCIiATRiStdDev