#MTF_shi_channel_1
Indicator

#MTF_shi_channel_1

iATR

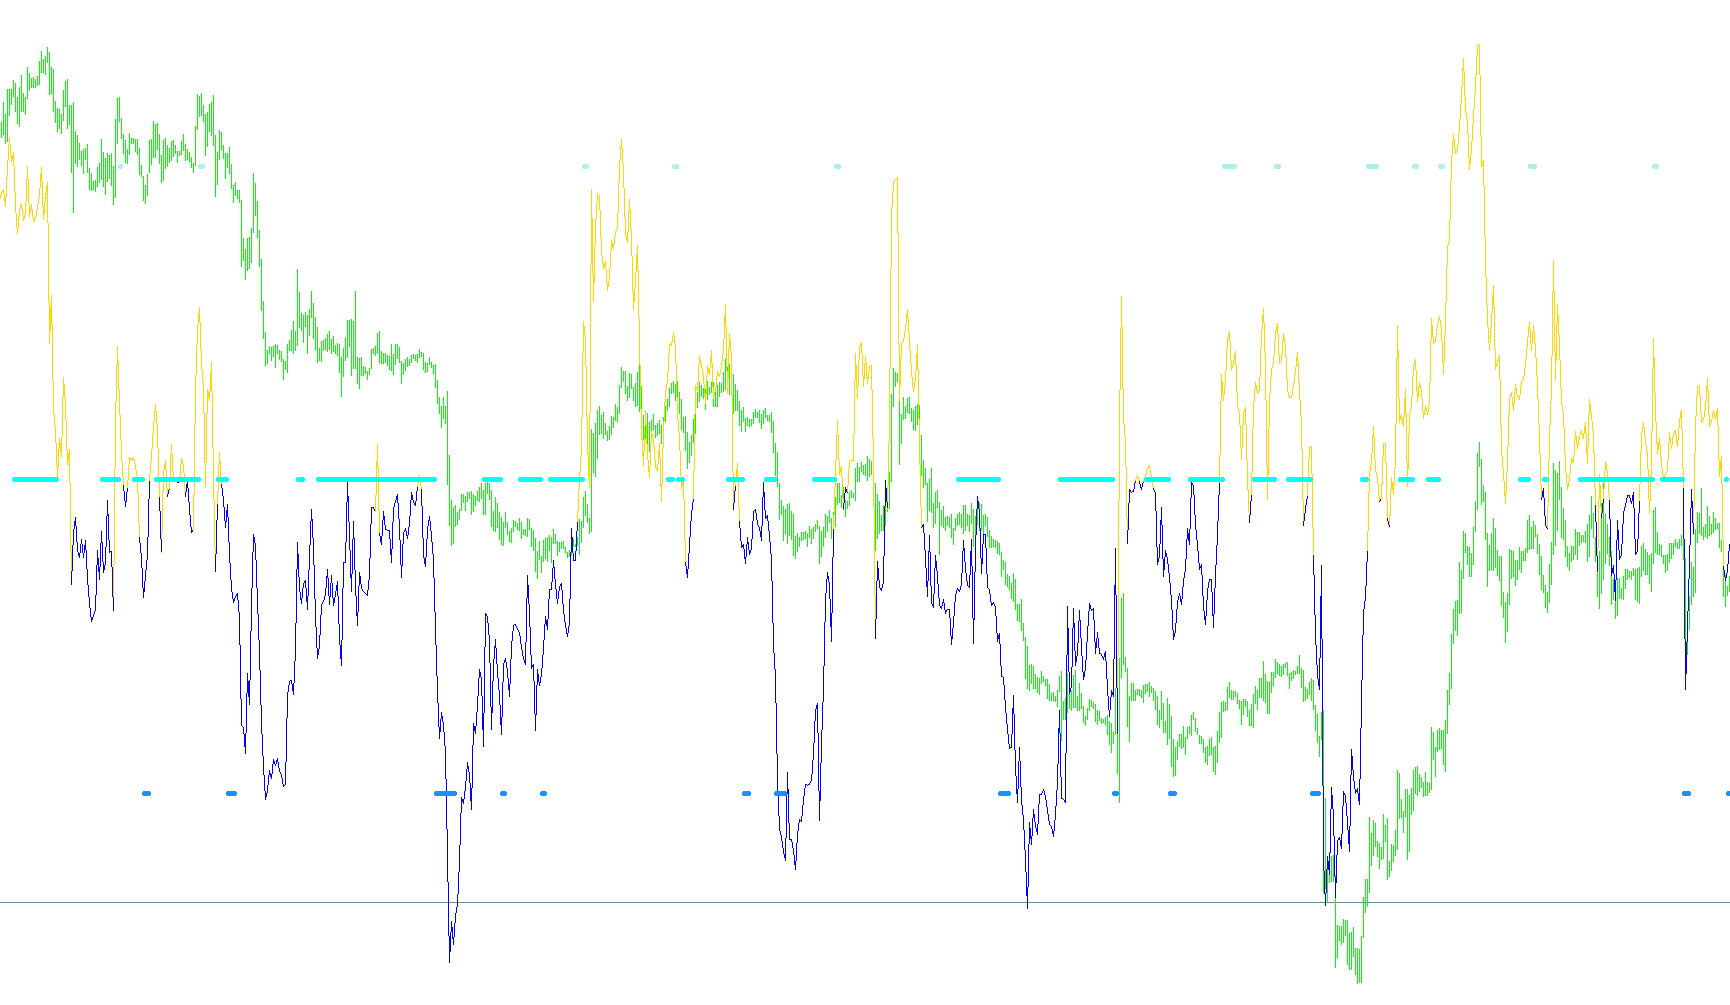
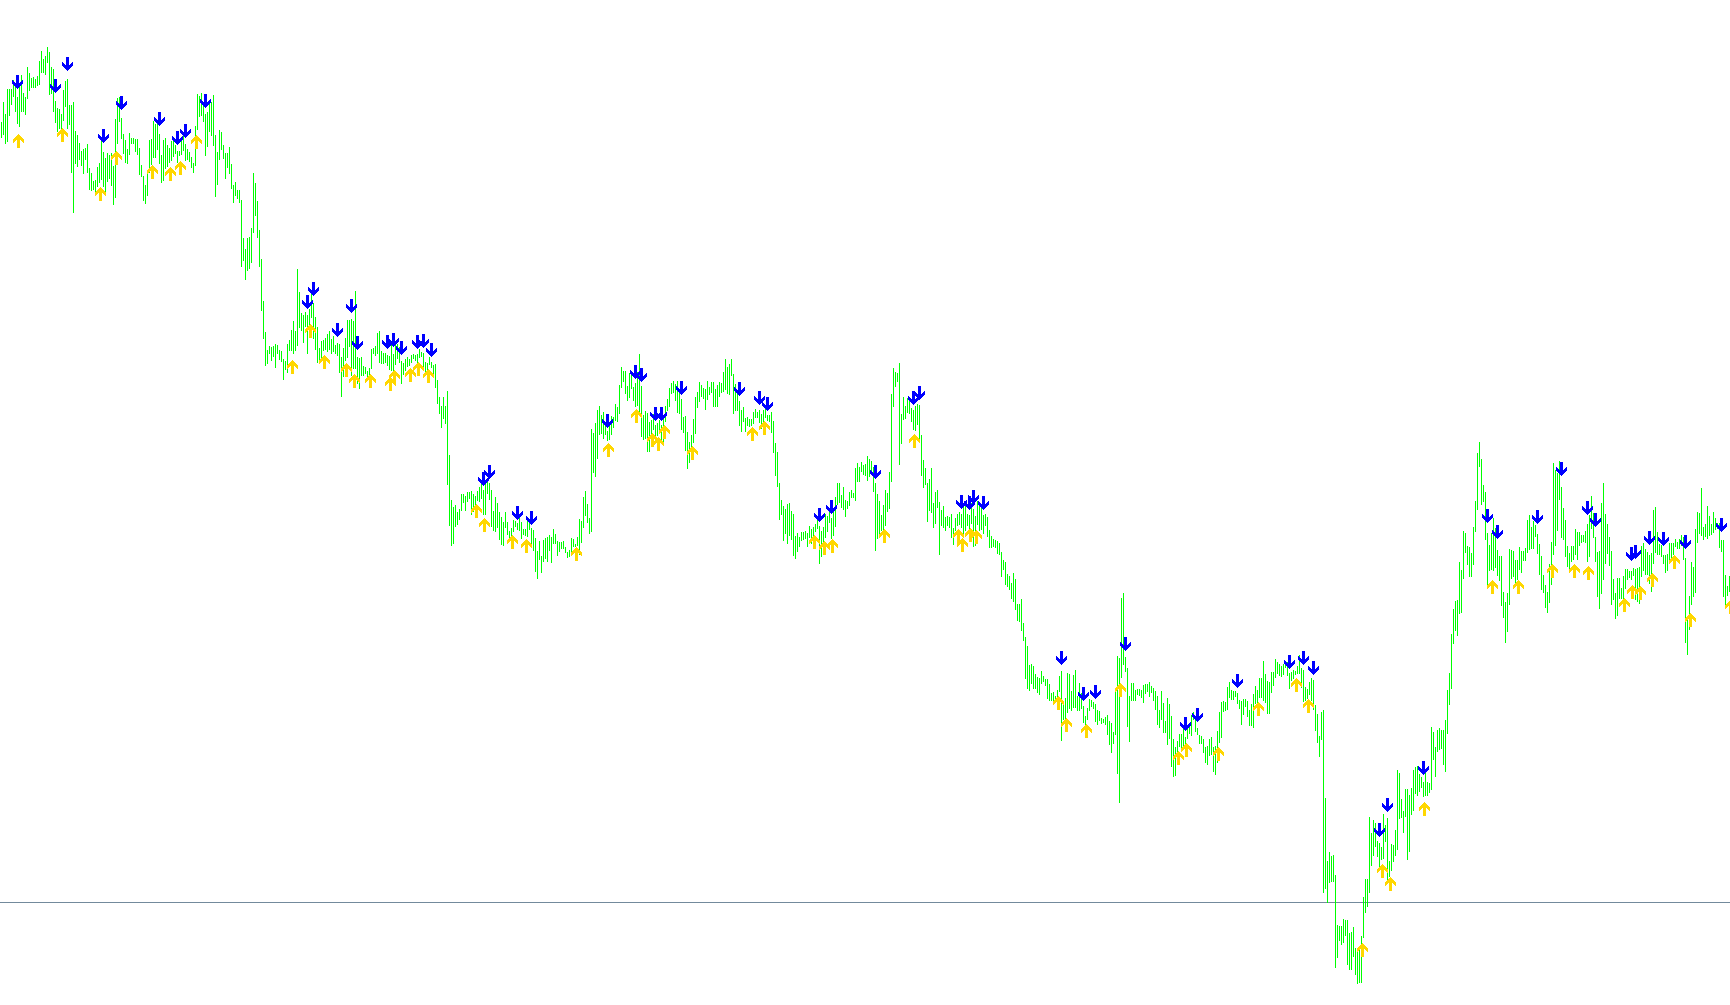
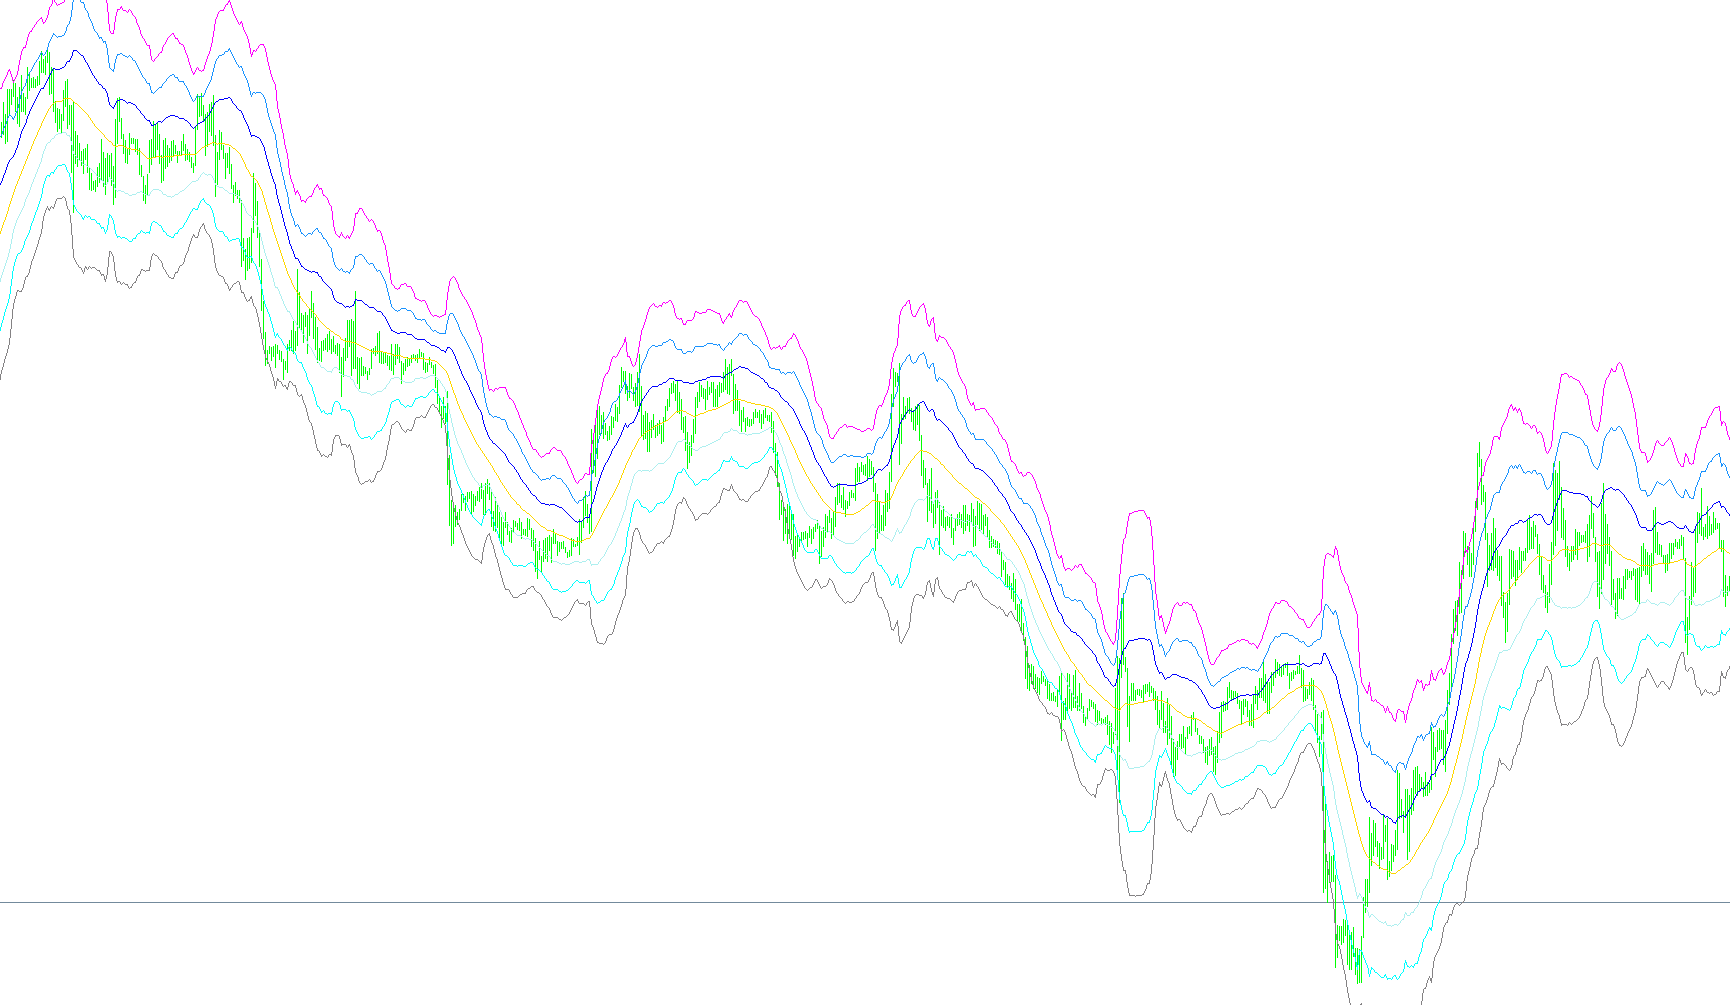
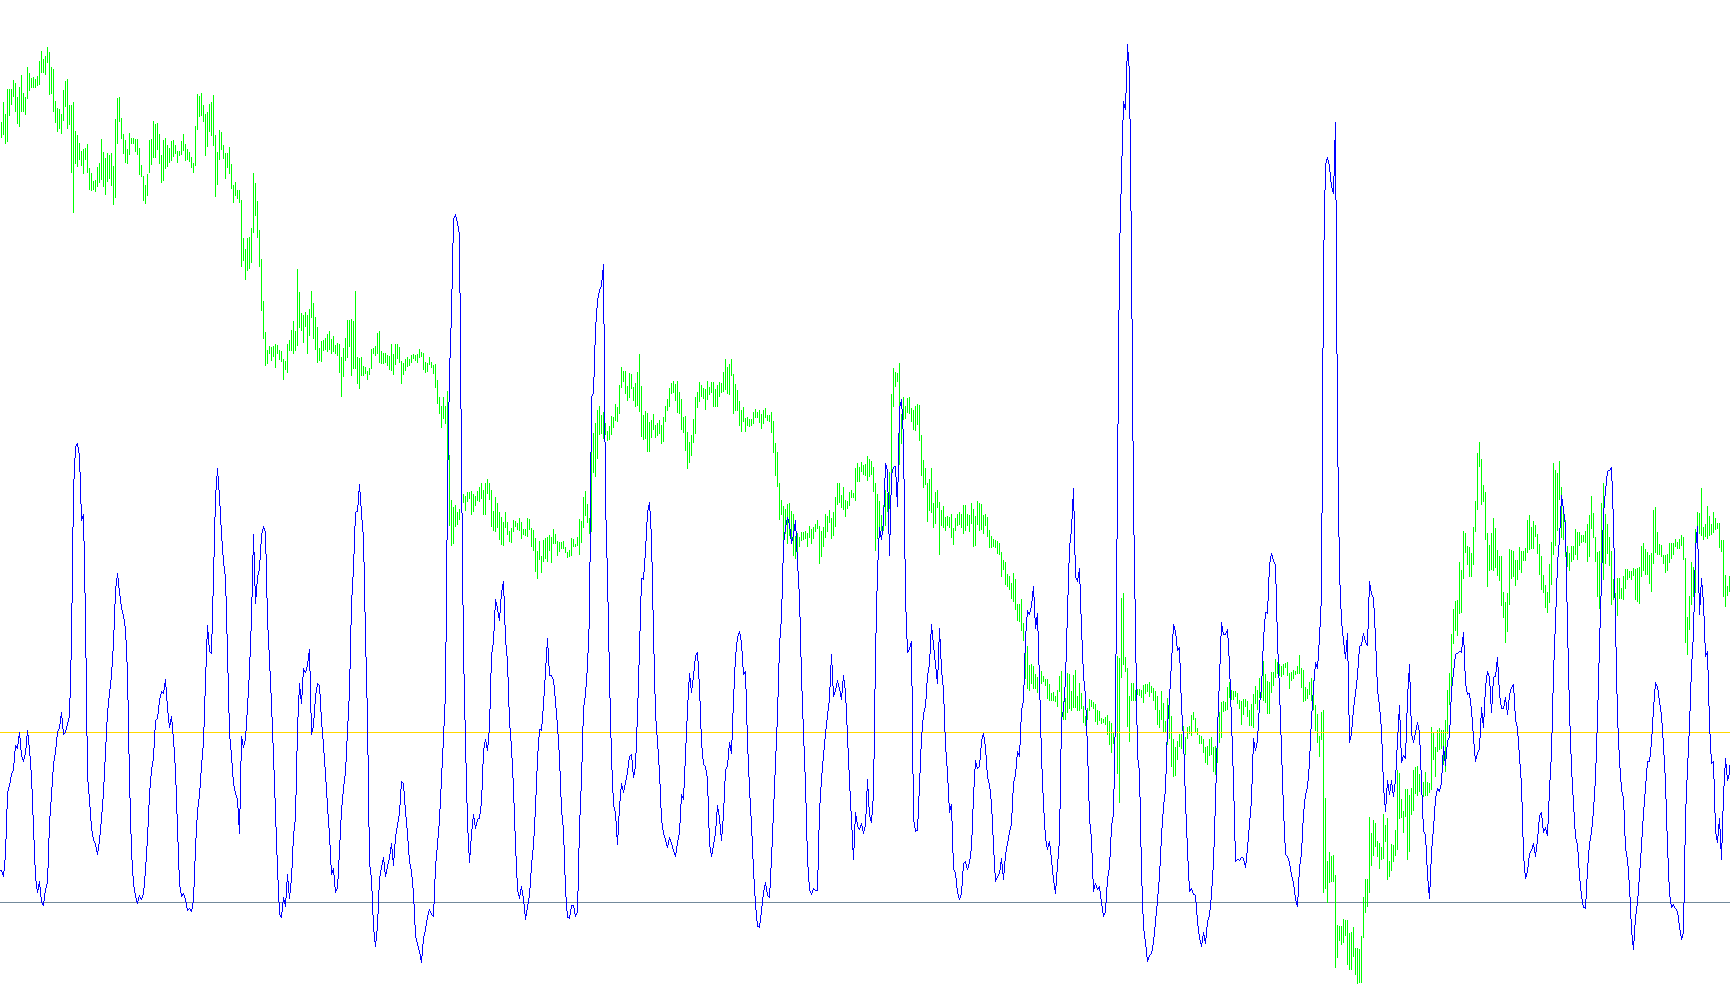
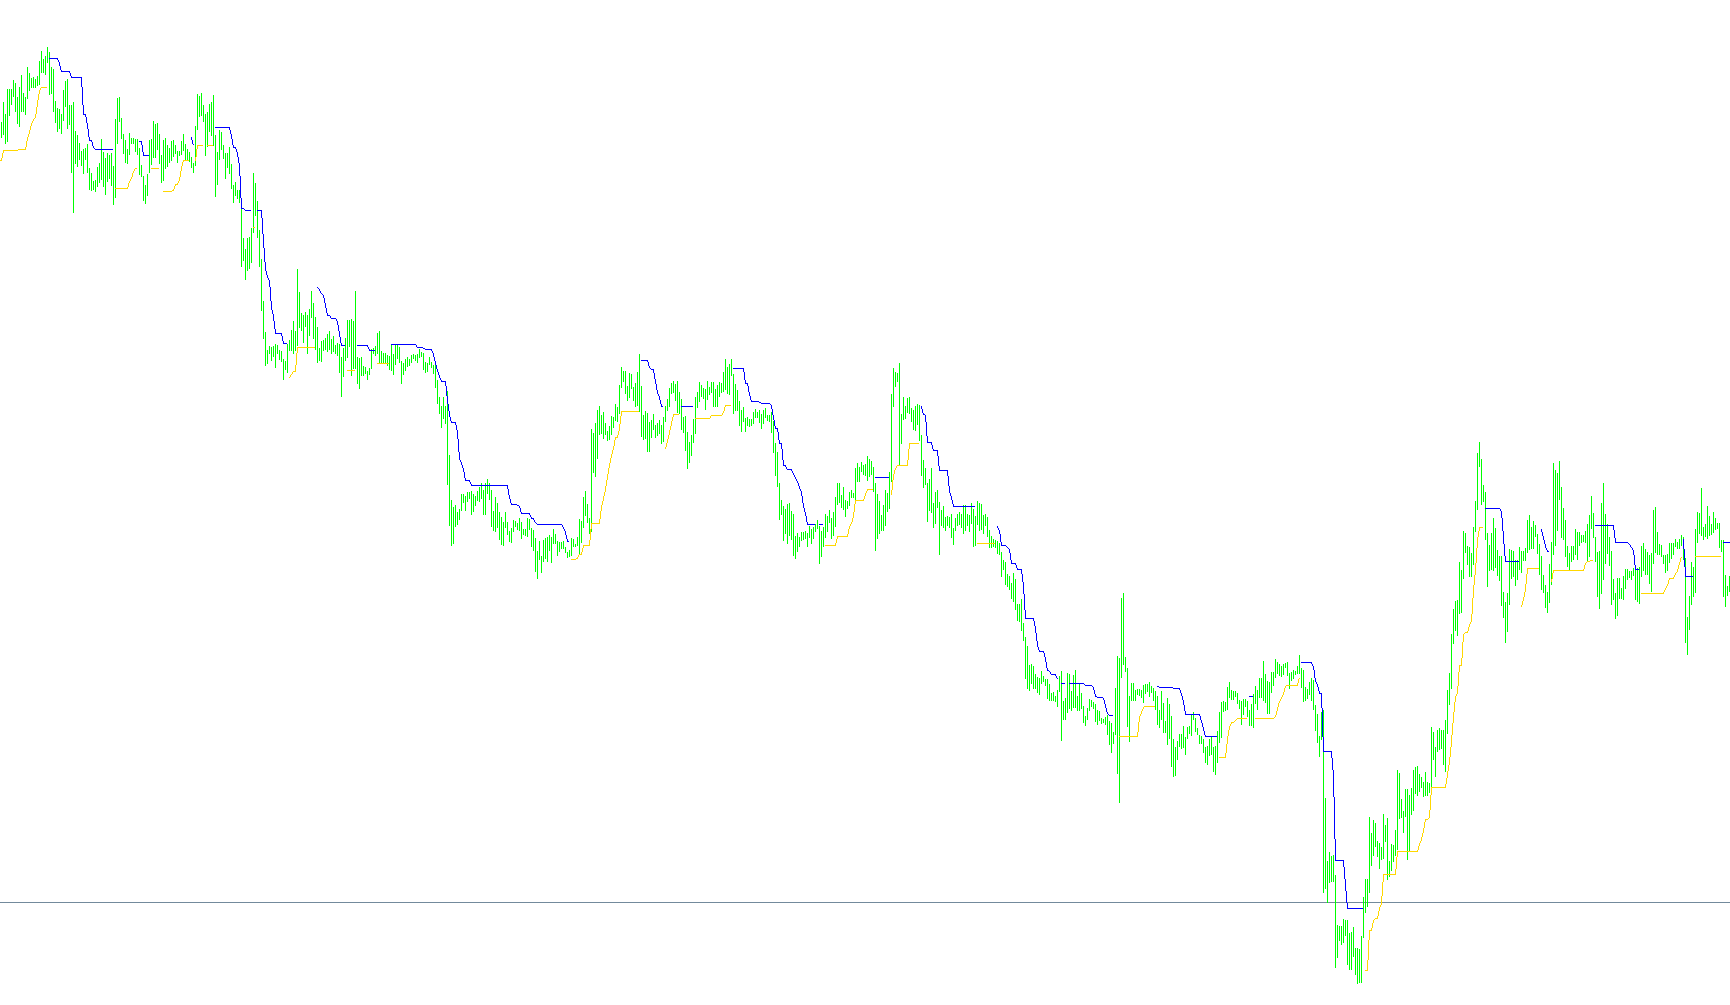
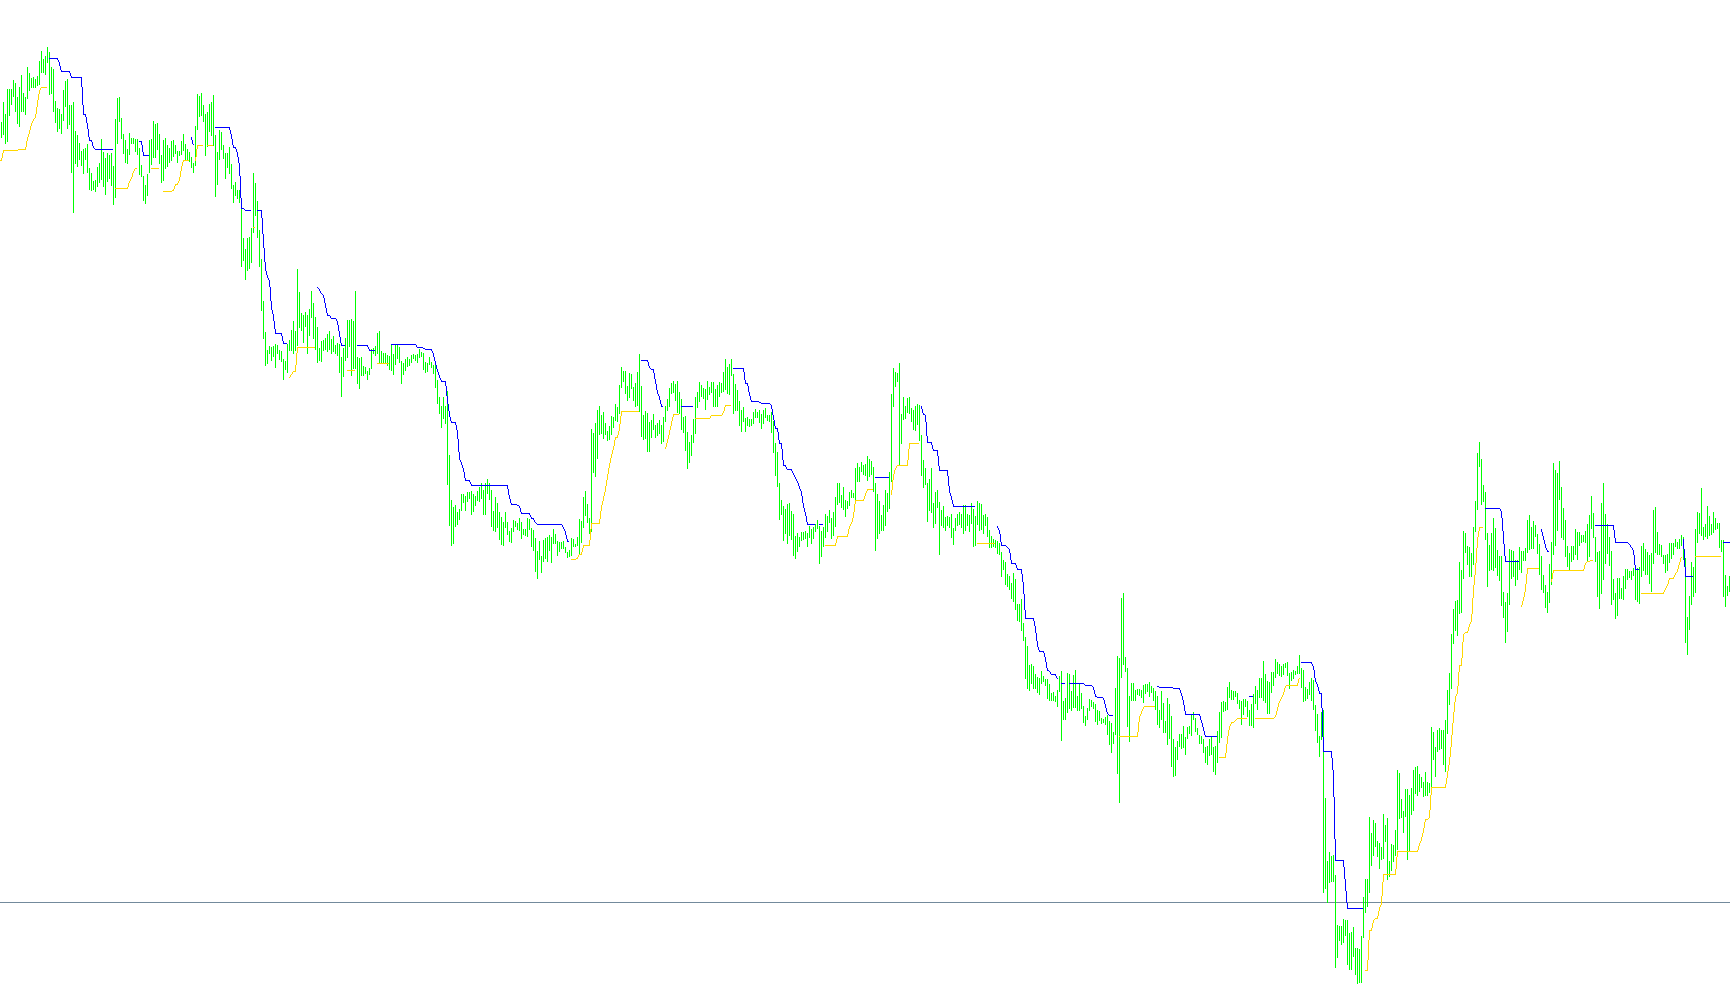
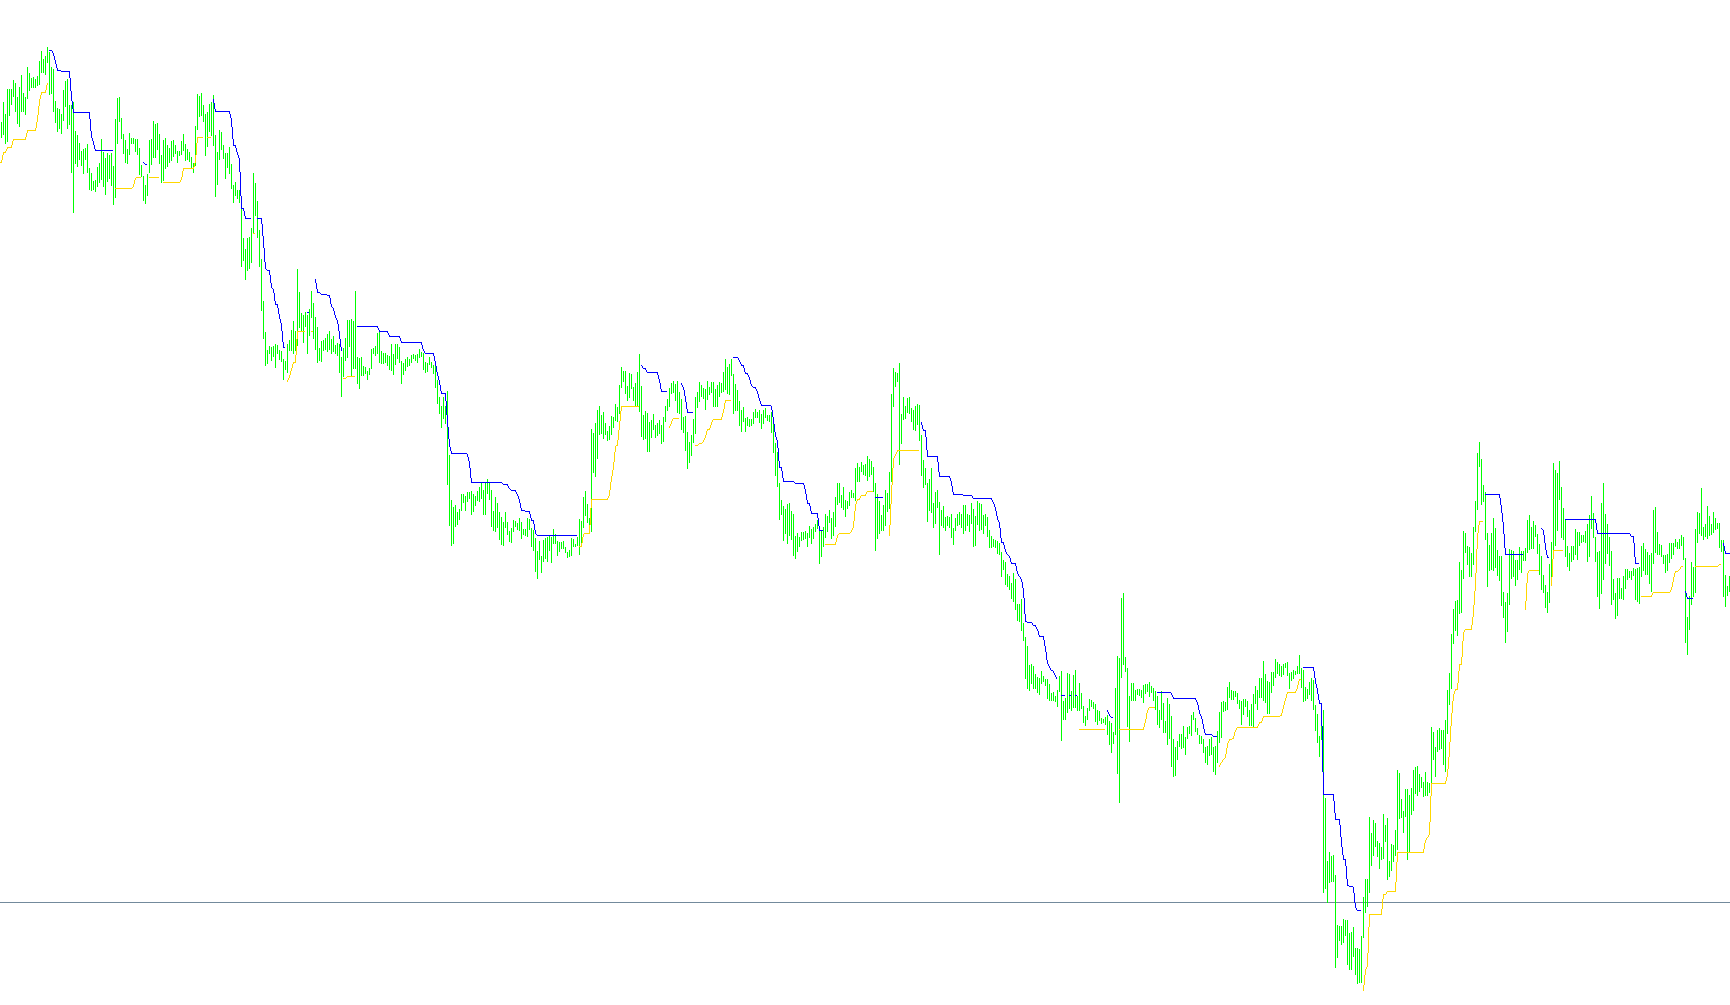
This indicator identifies structural market pivots using fractal points to project linear trend channels and calculate dynamic price expansion levels.

#MTF_shi_channel_1_001
Indicator

#MTF_shi_channel_1_001

iATR

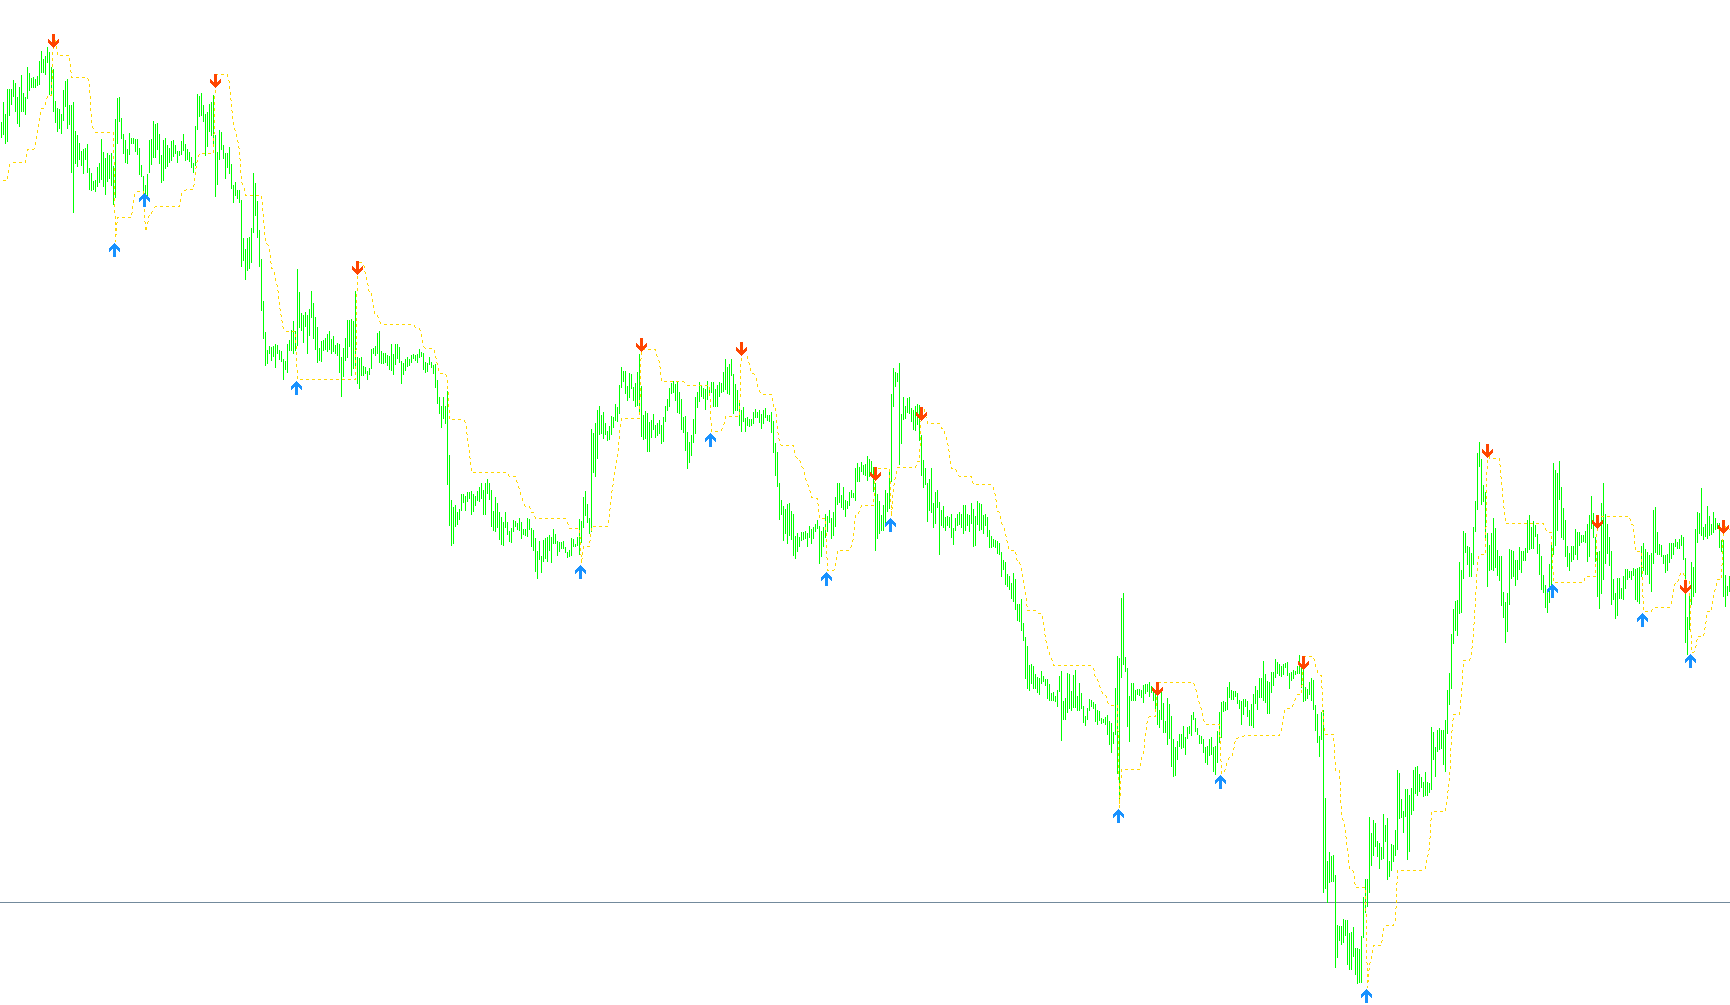
This indicator identifies multi-point fractal extremes to project dynamic trend channels and calculate breakout levels based on volatility-adjusted step calculations.

#MTF_shi_channel_1_002
Indicator

#MTF_shi_channel_1_002

iATR

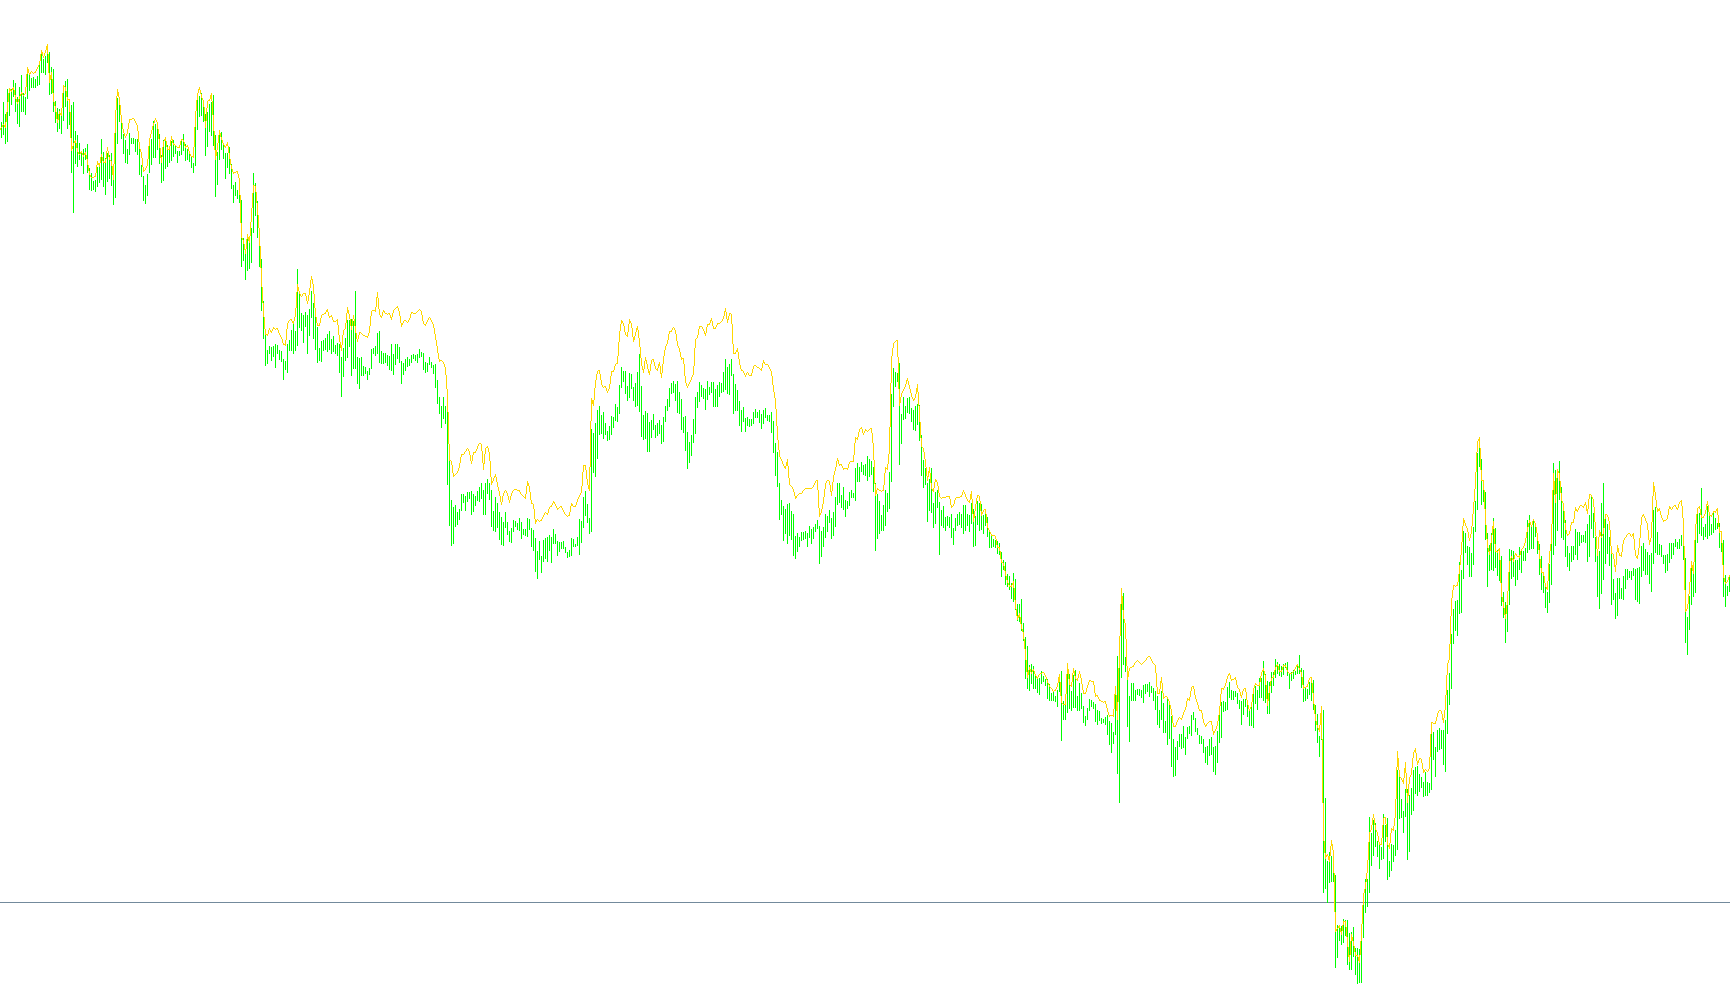
This indicator dynamically projects a geometric price channel based on identified fractal high/low pivots to detect trend exhaustion and potential reversal zones.

#MTF_shi_channel_1_003
Indicator

#MTF_shi_channel_1_003

iATR

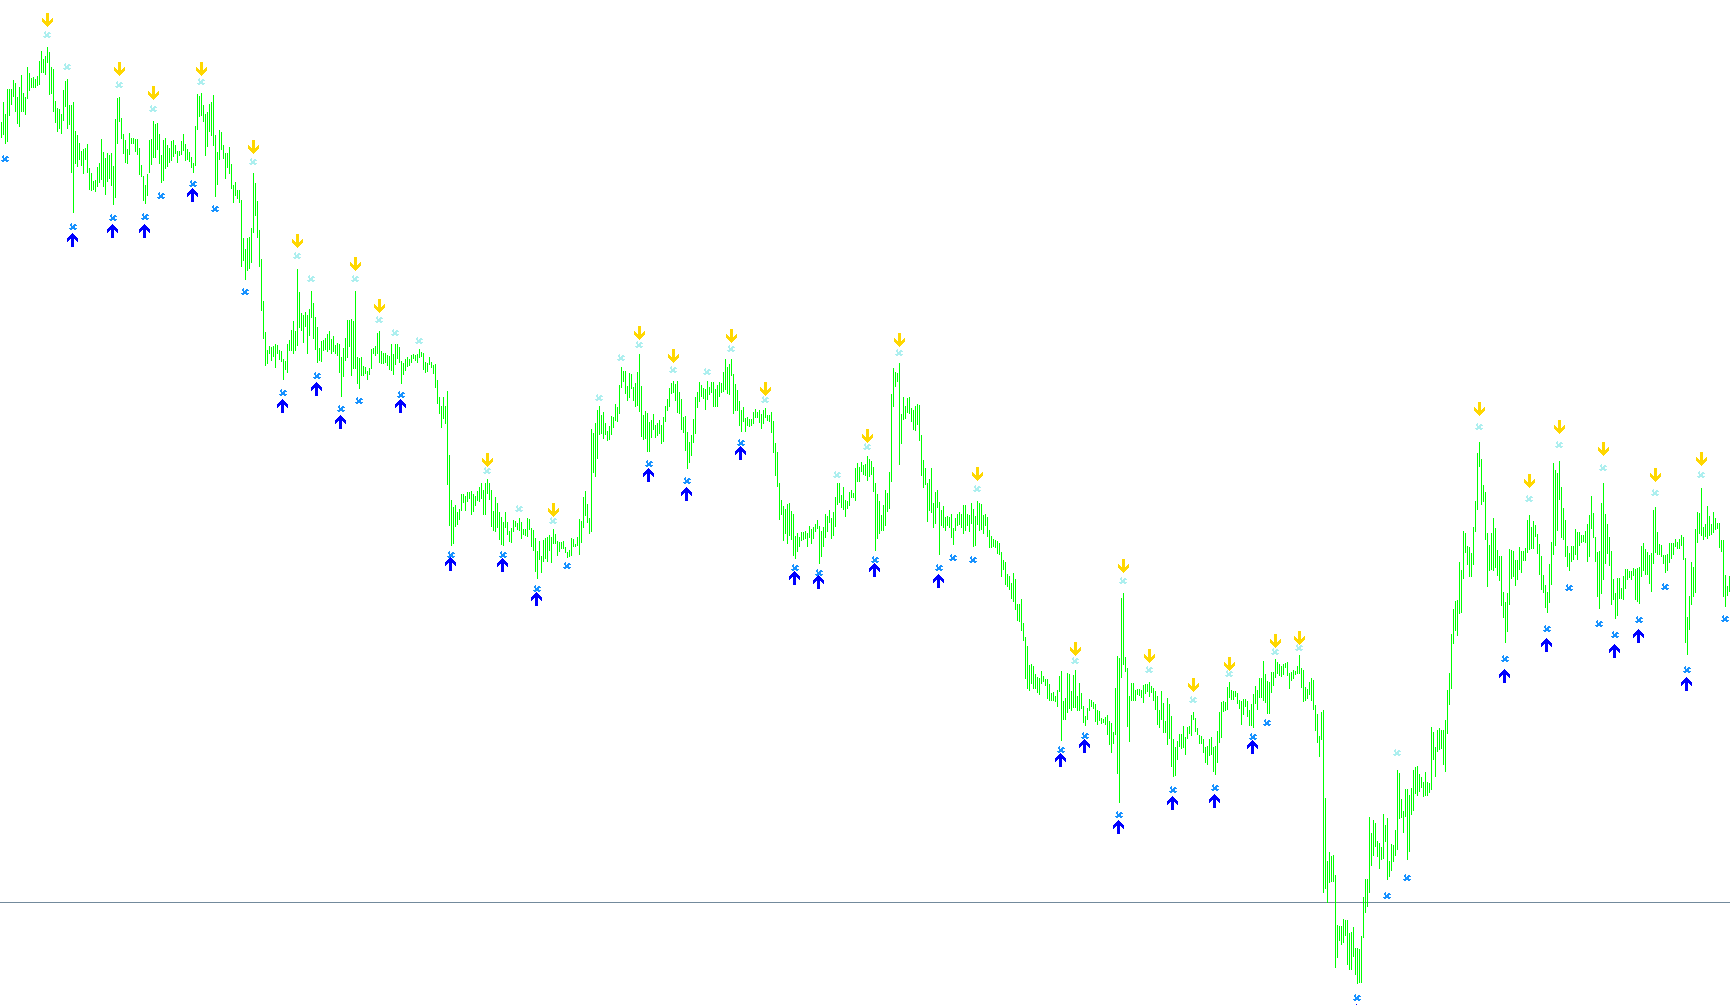
This indicator identifies price structure by connecting local fractal highs and lows to project dynamic trend channels with calculated median lines and automated signal labeling.

Indicator

#MTF_StochasticBar

iATRiStochastic
#Pretty_t3_LK_V1.2
Indicator

#Pretty_t3_LK_V1.2

iATRiMA

This indicator utilizes a triple-smoothed T3 moving average combined with an inverse Fisher transform on the rate of change to identify trend direction and intensity via a responsive RGB color shift.

#Pretty_t3_LK_V1.2_001
Indicator

#Pretty_t3_LK_V1.2_001

iATRiMA

This indicator utilizes a multi-stage recursive moving average combined with an Inverse Fisher Transform and ATR normalization to visualize real-time momentum shifts via dynamic color-coded gradients.
#Super Signal v3f
Indicator

#Super Signal v3f

iATR

This indicator identifies potential price reversals by detecting nested high and low peaks across two distinct lookback windows, utilizing Average True Range offsets to project signal arrows.

$BBS
Indicator

$BBS

iATRiMAiStdDev
+RSI-TC
Indicator

+RSI-TC

iBandsiATRiMAiRSI
+RSI-TC_v2
Indicator

+RSI-TC_v2

iBandsiATRiMAiRSI
- Alert @ MT4-LevelStop-Reverse-vB0-4
Indicator

- Alert @ MT4-LevelStop-Reverse-vB0-4

iATRiMAOnArray

This indicator identifies trend shifts by monitoring price breaches of an adaptive trailing stop line derived from smoothed ATR volatility or fixed pip offsets.

00ATR_Levels_custom[1]1test
Indicator

00ATR_Levels_custom[1]1test

iATR

This indicator calculates dynamic support and resistance levels by projecting the Average True Range from daily candles onto lower timeframes to identify potential liquidity zones.

01_zigzagvalue
Indicator

01_zigzagvalue

iATR

This indicator identifies structural market extrema by mapping recursive highs and lows to render a geometric zigzag path and automated pivot price labels.

AcceleratedMA
Indicator

AcceleratedMA

iCCIiATRiMA

This indicator synthesizes a standard Simple Moving Average with a dynamic additive component derived from the product of Average True Range and Commodity Channel Index to highlight volatility-adjusted price momentum.

Adaptative Stochastic v4
Indicator

Adaptative Stochastic v4

iATRiStochastic

This indicator dynamically scales stochastic period calculations based on the ratio of fast and slow ATR values, applying a quadratic multiplier to capture momentum shifts relative to market volatility.

ADX Crossing_alerts_v1
Indicator

ADX Crossing_alerts_v1

iATRiADX

Identifies bullish and bearish momentum shifts by detecting directional index crossovers paired with ATR-based price projections.

ADXcrosses&sound
Indicator

ADXcrosses&sound

iATRiADX

This indicator identifies trend reversals by detecting the crossover of Positive and Negative Directional Indicators (DMI) relative to a volatility-adjusted ATR buffer.

Indicator

ADX_HDSqz_mtf

iATRiADXiStdDev
Indicator

ADX_HDSqz_mtf_v1

iATRiADXiStdDev
Ahoora(chart)
Indicator

Ahoora(chart)

iATRiMAiRSIOnArray

This indicator identifies directional bias by comparing price action against high and low moving averages, then projects momentum using a composite of ATR volatility and RSI-based smoothing.

Ahoora
Indicator

Ahoora

iATRiMAiRSIOnArray

The indicator identifies trend shifts by comparing price extremes to moving averages and plots an RSI-based momentum oscillator derived from the sum of ATR volatility and price levels.

Akuma99 Storm Clouds v0-3
Indicator

Akuma99 Storm Clouds v0-3

iBandsiFractalsiATRiMA
Akuma99 Storm Clouds
Indicator

Akuma99 Storm Clouds

iBandsiFractalsiATRiMA
all_in_one_grab
Indicator

all_in_one_grab

iATRiMA

A comprehensive visual dashboard that overlays daily, weekly, and monthly pivot points, OHLC boundaries, moving averages, and real-time market analytics including ATR and spread monitoring.

Indicator

Aroon oscillator - arrows main chart

iATR
ASI
Indicator

ASI

iATR

This indicator calculates a cumulative momentum value by weighting price movement against volatility components including Average True Range, Extreme Reach, and Candle Shadow.

ATR Channels
Indicator

ATR Channels

iATRiMA

This indicator projects three distinct dynamic price bands based on linear weighted moving averages and multiple ATR multipliers to visualize market volatility extremes.

ATR Channels_v1
Indicator

ATR Channels_v1

iATRiMA

This indicator overlays a central moving average with three distinct volatility bands calculated by projecting multiple ATR multipliers to identify price extremes.

ATR Channels_v2
Indicator

ATR Channels_v2

iATRiMA

This indicator plots a dynamic central moving average flanked by three distinct tiers of ATR-based volatility bands to visualize price expansion and contraction.

ATR Darma
Indicator

ATR Darma

iATRiMAOnArray

This indicator calculates the average true range and overlays a secondary moving average to identify smoothed volatility trends and fluctuations.

ATR Levels custom
Indicator

ATR Levels custom

iATR

This indicator projects dynamic horizontal support and resistance levels by calculating Average True Range offsets from previous daily high, low, and temporal price data.

ATR Levels
Indicator

ATR Levels

iATR

This indicator calculates and plots horizontal support and resistance levels based on daily Average True Range (ATR) deviations relative to previous day's high and low price action.

Indicator

ATR Levels2

iATR
Indicator

ATR Levels4

iATR
ATR Levels_v1
Indicator

ATR Levels_v1

iATR

This indicator calculates dynamic support and resistance levels by projecting Average True Range values onto daily price data to identify key volatility boundaries.

ATR ratio
Indicator

ATR ratio

iATR

This indicator quantifies relative market turbulence by calculating the quotient of a short-term Average True Range against a long-term Average True Range to identify expansion or contraction phases.

ATR ratio_v1
Indicator

ATR ratio_v1

iATR

Quantifies relative price expansion by calculating the quotient of a short-term Average True Range against a long-term baseline to identify volatility spikes.

ATRChannel
Indicator

ATRChannel

iATR

This indicator constructs a dynamic pricing corridor by projecting Average True Range deviations from either the absolute high-low extremes or the calculated median price.

atrrange
Indicator

atrrange

iATR

This indicator identifies precise price consolidation zones and volatility contraction points by analyzing ATR variance ratios, price range expansion limits, and multi-period standard deviation consistency.

ATRStops_v1.1
Indicator

ATRStops_v1.1

iATR

This algorithm identifies trend direction by calculating rolling volatility envelopes based on Average True Range and locks the trailing support or resistance levels to prevent premature exit signals.

ATRStops_v1.1_001
Indicator

ATRStops_v1.1_001

iATR

The algorithm identifies market direction by tracking price breakouts relative to high and low extremes modified by a dynamic Average True Range multiplier.

Indicator

ATRStops_v11.1 + alert

iATR
ATRStops_v11.1
Indicator

ATRStops_v11.1

iATR

This indicator identifies trend shifts by evaluating price breaches of volatility-weighted boundaries derived from Average True Range extremes.

ATRStops_v1[1][1].1
Indicator

ATRStops_v1[1][1].1

iATR

This indicator identifies structural trend shifts by calculating price boundaries based on the Average True Range and maintaining non-decreasing floor levels for bullish trends or non-increasing ceiling levels for bearish moves.

atrvalues
Indicator

atrvalues

iATR

This indicator projects real-time Average True Range values across nine distinct timeframes simultaneously onto a single chart display.

Atr_3v1_3
Indicator

Atr_3v1_3

iATR

This indicator identifies high-intensity market activity by correlating relative Average True Range expansions with normalized volume spikes to highlight significant price momentum shifts.

Atr_3v1_3_time
Indicator

Atr_3v1_3_time

iATR

This indicator identifies market anomalies by calculating the ratio of instantaneous Average True Range and trading volume against historical hourly averages to detect significant price action intensity.

Atr_3v1_4
Indicator

Atr_3v1_4

iATR

This indicator quantifies the relationship between normalized relative volume and localized average true range to identify momentum shifts and price exhaustion.

ATR_Bands
Indicator

ATR_Bands

iATRiMA

This indicator constructs self-adjusting bands by superimposing a multiplier of the Average True Range onto an Exponential Moving Average to visualize price extremes based on current market variance.