Indicator

CatFX50_last ver

iATRiMA
Indicator

CatFX50_last ver_v1

iATRiMA
Indicator

CatFX50_nk

iATRiMA
Indicator

CatFX50_v1

iATRiMA
Indicator

CatFX50_v2

iATRiMA
CCISqueeze
Indicator

CCISqueeze

iATRiMAiStdDev

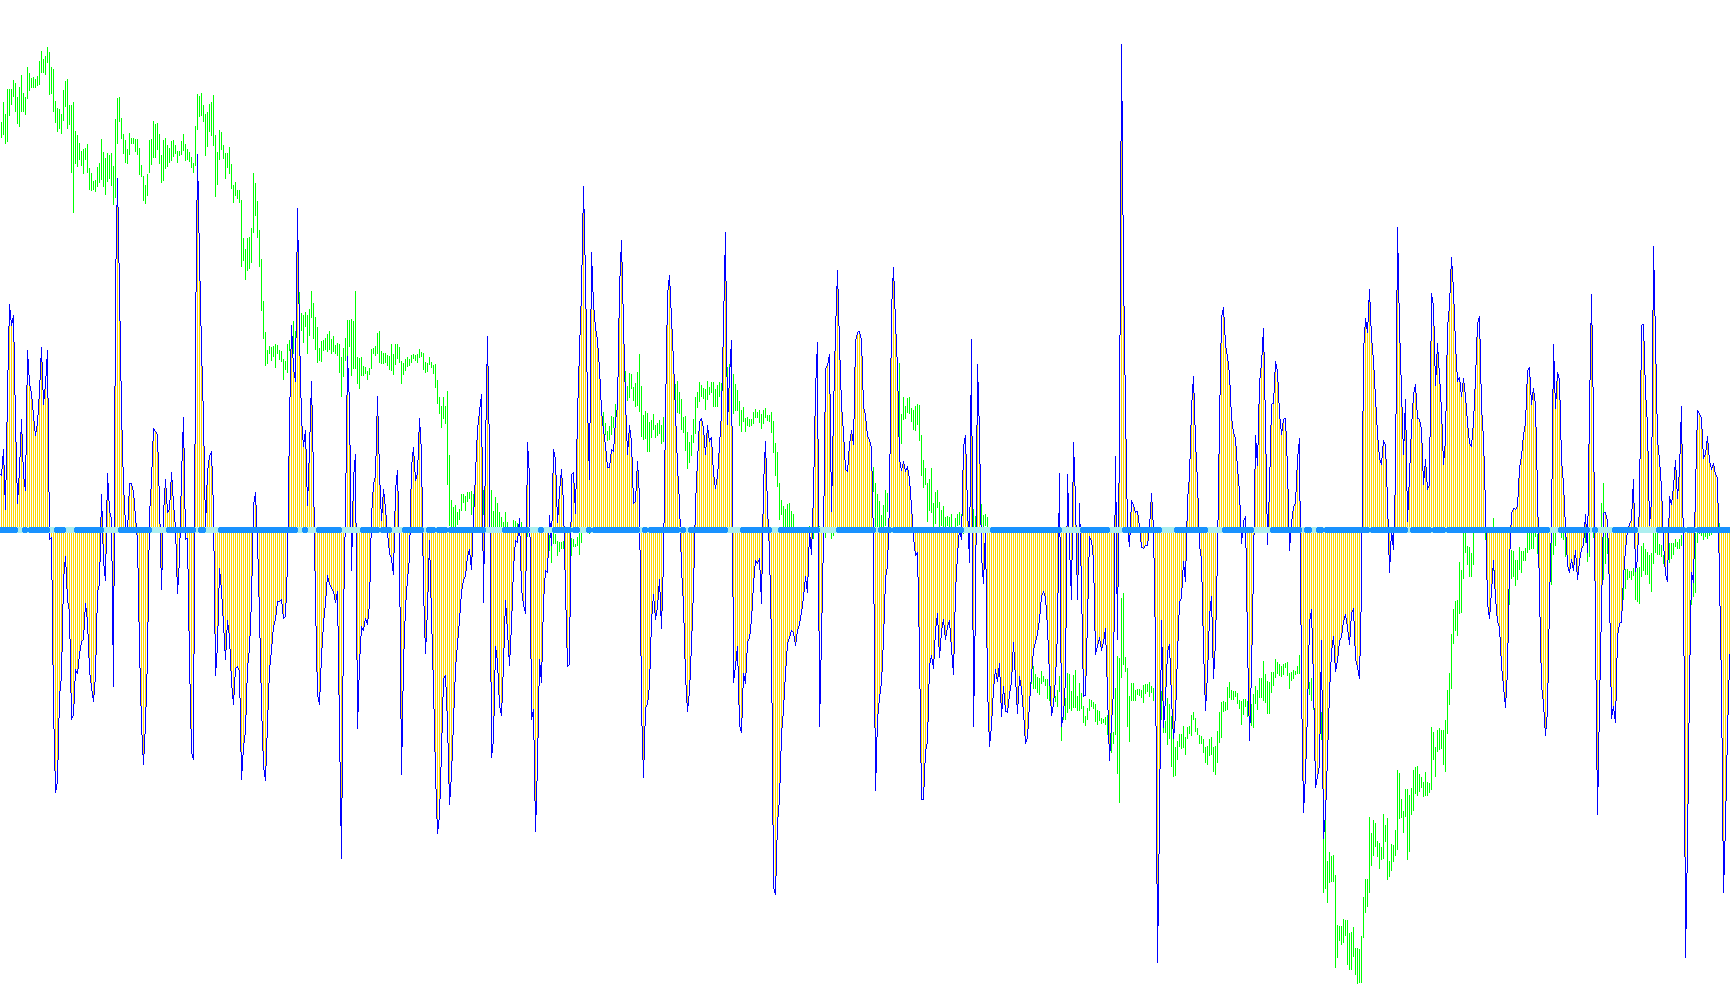
This indicator identifies market compression by measuring the ratio between Bollinger Band width and Keltner Channel range, overlaid with a Commodity Channel Index (CCI) momentum histogram.

CCI_Cross0_x3WarnSigAlertEli_MTF
Indicator

CCI_Cross0_x3WarnSigAlertEli_MTF

iCCIiATR

This indicator detects directional shifts by identifying zero-line crossovers across three distinct CCI time horizons with dynamic ATR-based signal spacing.

ChandelierExit
Indicator

ChandelierExit

iATR

Identifies trend reversal points by calculating price deviation from rolling high-low extremes scaled by the Average True Range.

ChandelierExit_v1
Indicator

ChandelierExit_v1

iATR

This indicator dynamically calculates trailing stop levels by merging high/low price extremes with ATR-based volatility multipliers to identify trend reversals.

ChandelierExit_v2
Indicator

ChandelierExit_v2

iATR

This indicator identifies trend reversals by calculating price exhaustion zones based on high/low extremes relative to a multiplied Average True Range.

ChandelierStops_v1.1
Indicator

ChandelierStops_v1.1

iATR

This indicator identifies market direction by calculating trailing support and resistance levels based on the highest highs, lowest lows, and Average True Range (ATR) volatility.

ChandelierStops_v1
Indicator

ChandelierStops_v1

iATR

This indicator identifies dynamic trend boundaries by calculating price extremes offset by a multiplier of the Average True Range to filter out market noise.

ChandelierStops_v1_v1
Indicator

ChandelierStops_v1_v1

iATR

This indicator dynamically calculates overhead and floor boundaries using Average True Range multipliers to identify trend reversals based on price penetration of volatility-adjusted extremes.

ChandelierStops_v1_v2
Indicator

ChandelierStops_v1_v2

iATR

This indicator identifies trend reversals by monitoring price breaches of dynamic boundaries calculated from the highest highs, lowest lows, and Average True Range multiplier.

Chande_Kroll_Stop_v1
Indicator

Chande_Kroll_Stop_v1

iATR

This indicator identifies structural trend boundaries by calculating rolling extreme price levels offset by a multiplier of the Average True Range.

Chande_Kroll_Stop_v1_v1
Indicator

Chande_Kroll_Stop_v1_v1

iATR

This indicator identifies dynamic support and resistance levels by calculating the highest high and lowest low over a rolling period, offset by a multiplier of the Average True Range to account for market volatility.

chanel_scalper
Indicator

chanel_scalper

iATRiMA

The logic identifies structural shifts by monitoring price breaches of mid-point ranges expanded by Average True Range volatility factors.

channel_breakout_entry_basic
Indicator

channel_breakout_entry_basic

iATR

This indicator identifies momentum shifts by detecting price breaches of nested high/low channels and dynamically projects risk boundaries using ATR-based volatility offsets.

CK_Speed
Indicator

CK_Speed

iATRiRSIOnArrayiStdDev

This indicator identifies market regime shifts by evaluating the RSI of both Average True Range and Standard Deviation relative to a central equilibrium threshold.

CloseOnTheLimit_Reverse
Indicator

CloseOnTheLimit_Reverse

iATR

Identifies price action reversals by detecting breaches of previous highs and lows while projecting entry targets based on half the Average True Range volatility.

Indicator

Color Stochastic v1.02

iATRiStochastic
Indicator

Color Stochastic v1.03

iATRiStochastic
Indicator

Color Stochastic v1.04

iATRiStochastic
Indicator

Color Stochastic v1.04d test on alert on arrow

iATRiStochastic
Indicator

Color Stochastic v1.04d test on alert on arrow_001

iATRiStochastic
Indicator

Color Stochastic v1[1].02

iATRiStochastic
Commentator
Indicator

Commentator

iACiCCIiDeMarkeriATR
Commentator_v1
Indicator

Commentator_v1

iACiCCIiDeMarkeriATR
Commentator_v2
Indicator

Commentator_v2

iACiCCIiDeMarkeriATR
CurrentInfo
Indicator

CurrentInfo

iATR

This indicator calculates multi-day average price ranges, current volatility metrics, and real-time account performance statistics based on daily candle data.

Damiani_volatmeter
Indicator

Damiani_volatmeter

iATRiStdDev

This indicator identifies high-intensity market movements by calculating the ratio between short-term and long-term Average True Ranges while filtering for signal-to-noise thresholds.

Damiani_volatmeter2.i
Indicator

Damiani_volatmeter2.i

iATRiStdDev

This indicator calculates a volatility quotient by comparing short-term ATR against long-term ATR and standard deviation metrics to filter for high-momentum market expansion.

Damiani_volatmeterNoInputs
Indicator

Damiani_volatmeterNoInputs

iATRiStdDev

The indicator quantifies market intensity by calculating the ratio between short-term and long-term Average True Range while applying a dynamic standard deviation threshold to filter out non-tradeable noise.

Damiani_volatmeter_v1
Indicator

Damiani_volatmeter_v1

iATRiStdDev

This indicator quantifies market momentum by calculating the ratio between short-term and long-term Average True Ranges while applying a standard deviation threshold to isolate high-probability trade signals from market noise.

Damiani_volatmeter_v2
Indicator

Damiani_volatmeter_v2

iATRiStdDev

The indicator identifies high-probability trading zones by calculating the ratio between short-term and long-term Average True Range (ATR) and comparing it against a dynamic standard deviation threshold to filter out market noise.

Damiani_volatmeter_v3
Indicator

Damiani_volatmeter_v3

iATRiStdDev

The logic calculates a relative volatility coefficient by comparing short-term ATR to long-term ATR and filters actionable signals based on a dynamic standard deviation threshold.

Damiani_Volt
Indicator

Damiani_Volt

iATRiStdDev

The indicator identifies high-momentum entries by comparing the ratio of short-term Average True Range to long-term ATR against a dynamic standard deviation threshold.

Damiani_Volt_v1
Indicator

Damiani_Volt_v1

iATRiStdDev

This indicator identifies high-momentum market entries by comparing a normalized Average True Range against a dynamic Standard Deviation threshold to detect significant price expansion.

delta-stop
Indicator

delta-stop

iATRiMAOnArray

The indicator calculates a dynamic price floor or ceiling by applying a multiplier to smoothed Average True Range volatility to track structural price shifts.

dex_2Trales_V1
Indicator

dex_2Trales_V1

iATRiStdDev

This indicator calculates price boundaries by blending historical daily range averages with real-time expansion of volatility using Standard Deviation or ATR metrics.

divergencepetr_s7
Indicator

divergencepetr_s7

iADiACiATRiADX
Indicator

Divergence_Petr

iADiACiATRiADX
Doda-Trend
Indicator

Doda-Trend

iATRiStdDev

The logic identifies market regimes by comparing current Average True Range (ATR) against the Exponential Moving Average of Standard Deviation to distinguish between consolidation and momentum.

DT-ZigZag-ATR
Indicator

DT-ZigZag-ATR

iATR

This indicator identifies price reversals by detecting ZigZag pivot points and projecting dynamic entry boundaries based on the Average True Range multiplier.

DT-ZigZag-ATR_v1
Indicator

DT-ZigZag-ATR_v1

iATR

This indicator identifies structural pivot points using the standard ZigZag algorithm and projects dynamic support and resistance levels based on a volatility-weighted Average True Range multiplier.

DT-ZigZag-ATR_v2
Indicator

DT-ZigZag-ATR_v2

iATR

Identifies structural price pivot points by dynamically calculating distance from ZigZag peaks using a multiplier of the Average True Range.

duct
Indicator

duct

iATR

This indicator identifies significant structural pivot points to project dual linear trend boundaries and an equilibrium centerline for momentum analysis.

FDM Oscillator
Indicator

FDM Oscillator

iATRiStochastic

This indicator synthesizes stochastic momentum data across selectable timeframes to identify overextended price levels and provide visual signals for trend exhaustion.

FixedChartScale
Indicator

FixedChartScale

iATRiMA

This indicator dynamically adjusts the fixed visual price boundaries of a trading chart by calculating margins based on price extremes and relative median averages.

fq_head_fake
Indicator

fq_head_fake

iATR

Identifies bullish or bearish trend reversals by detecting significant price spikes that fail to sustain momentum against previous structural lows or highs.