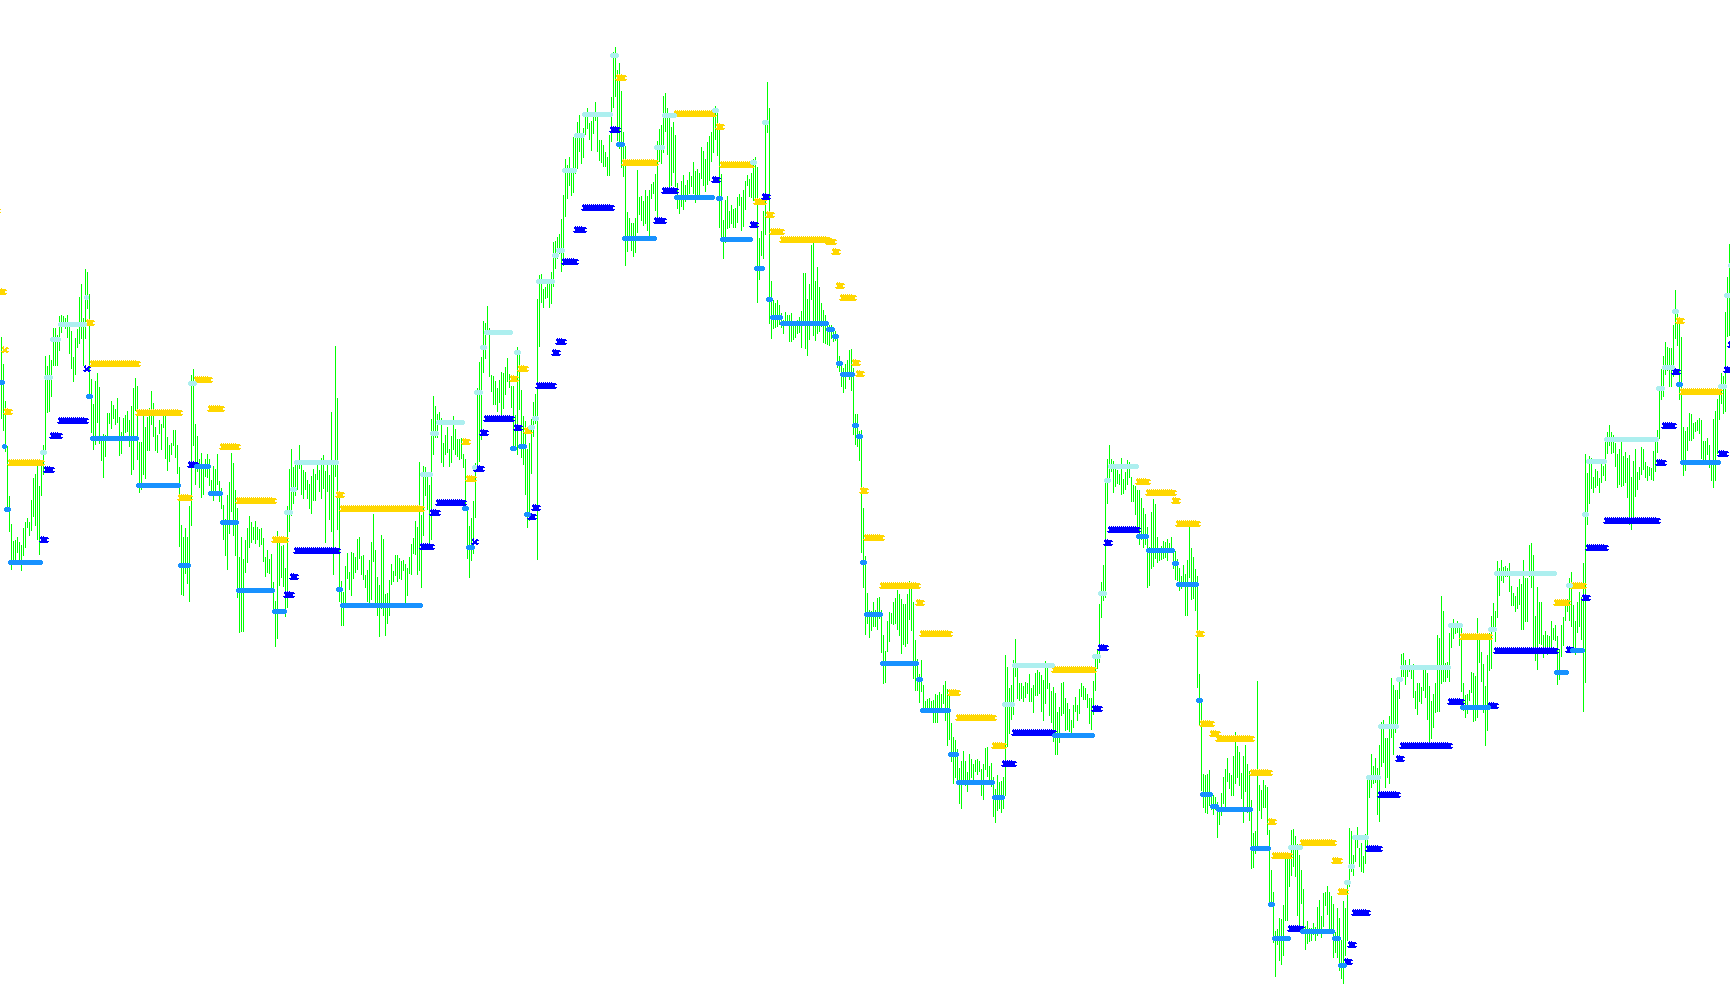
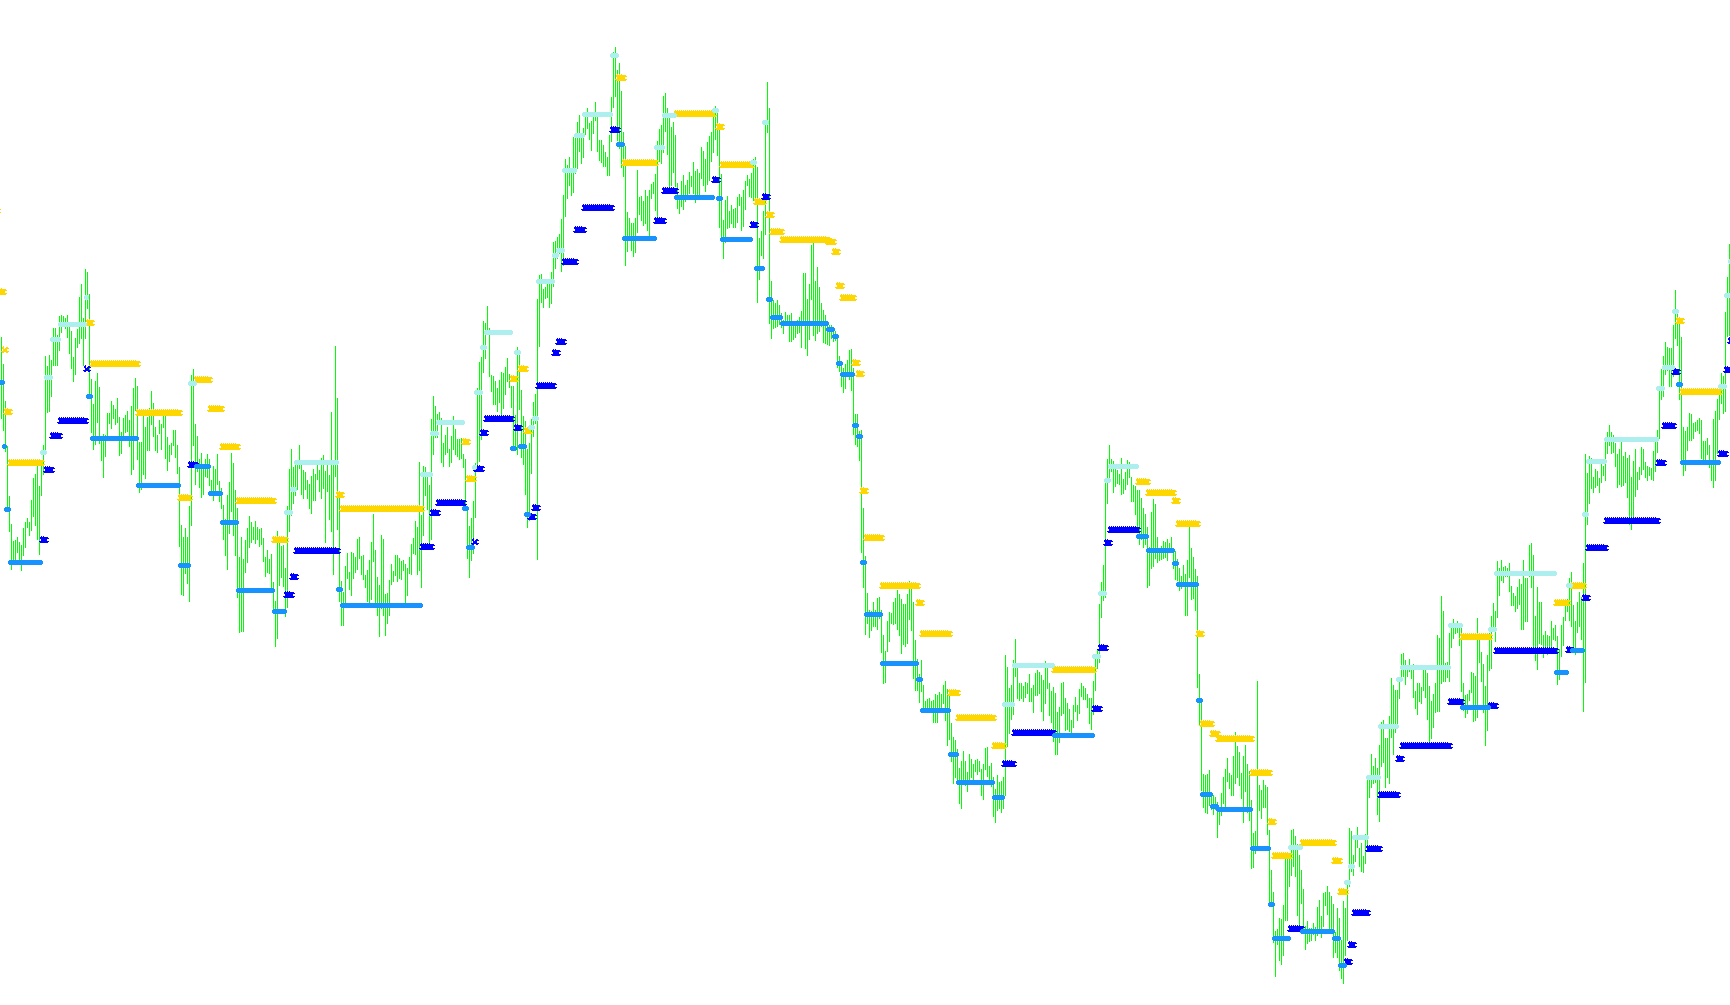
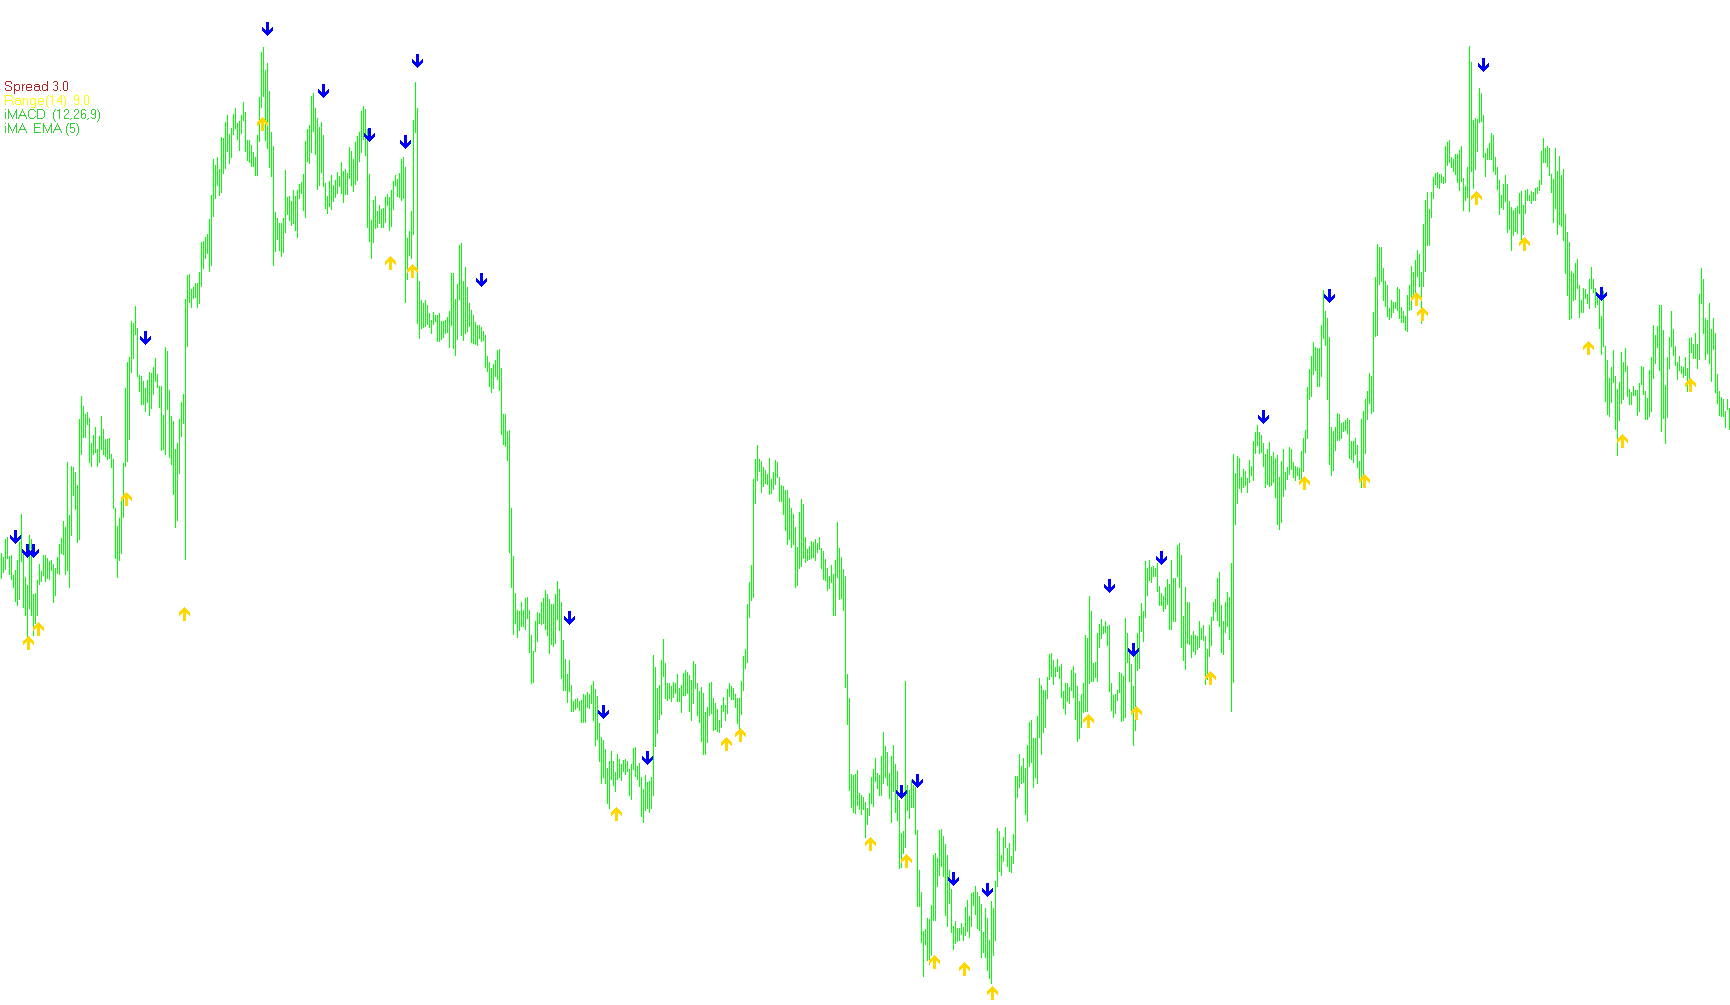
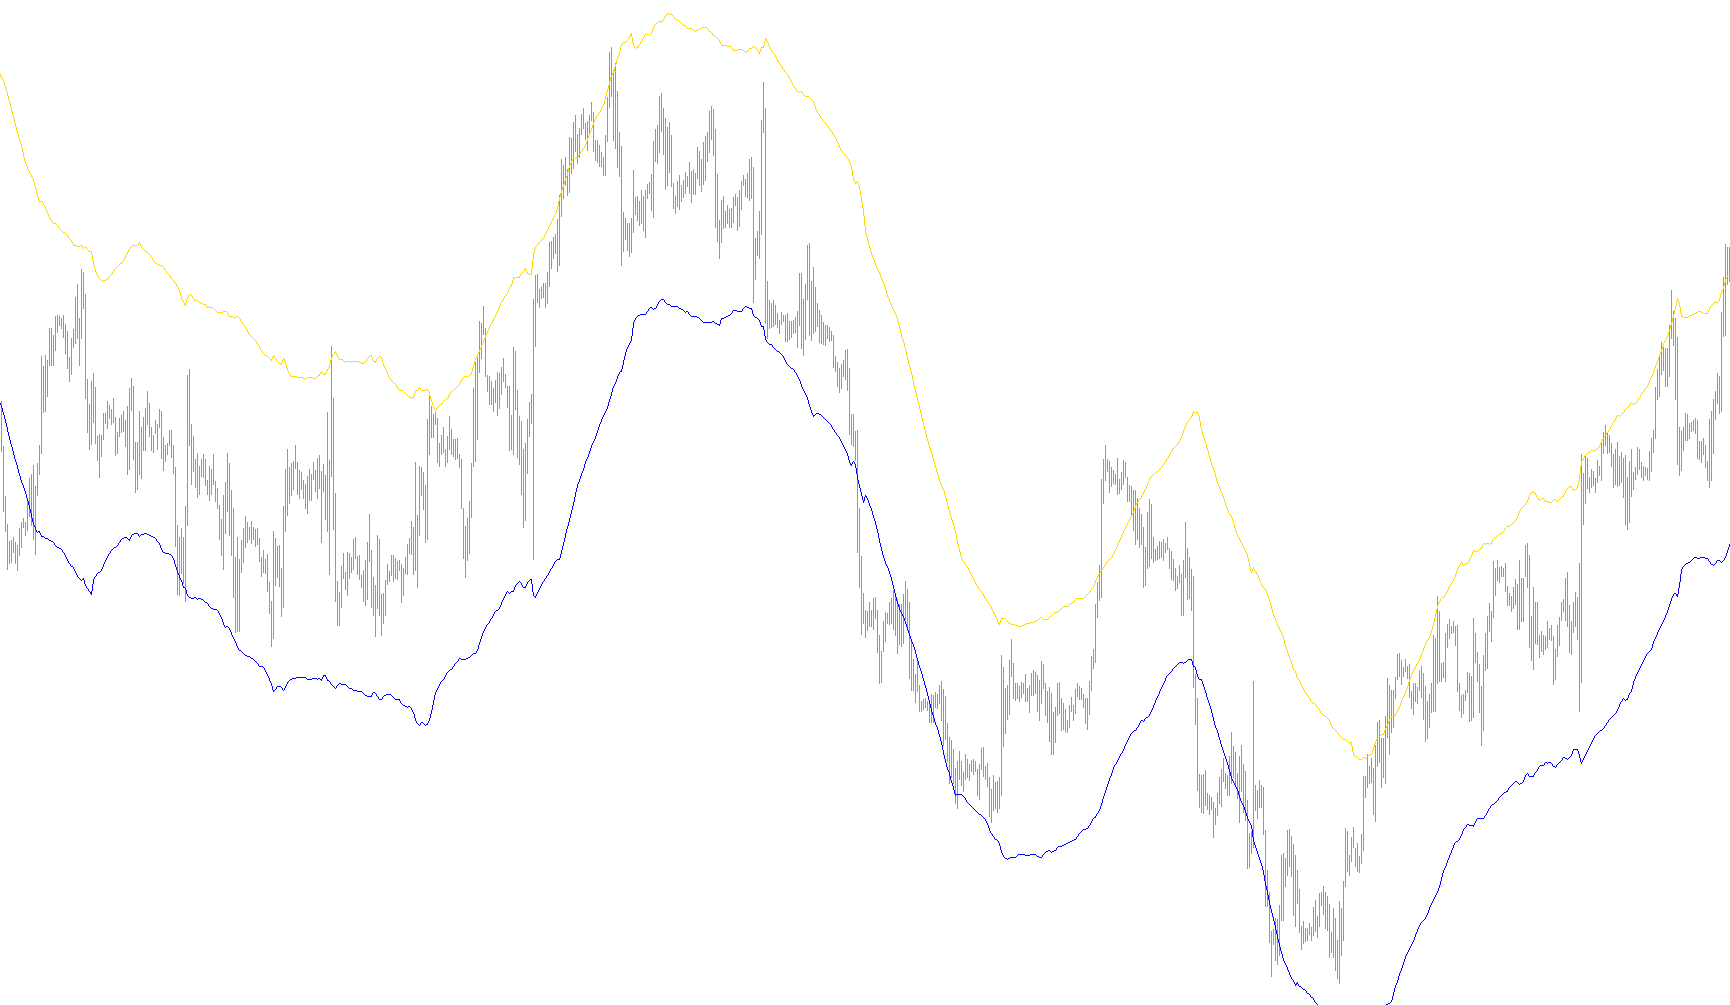
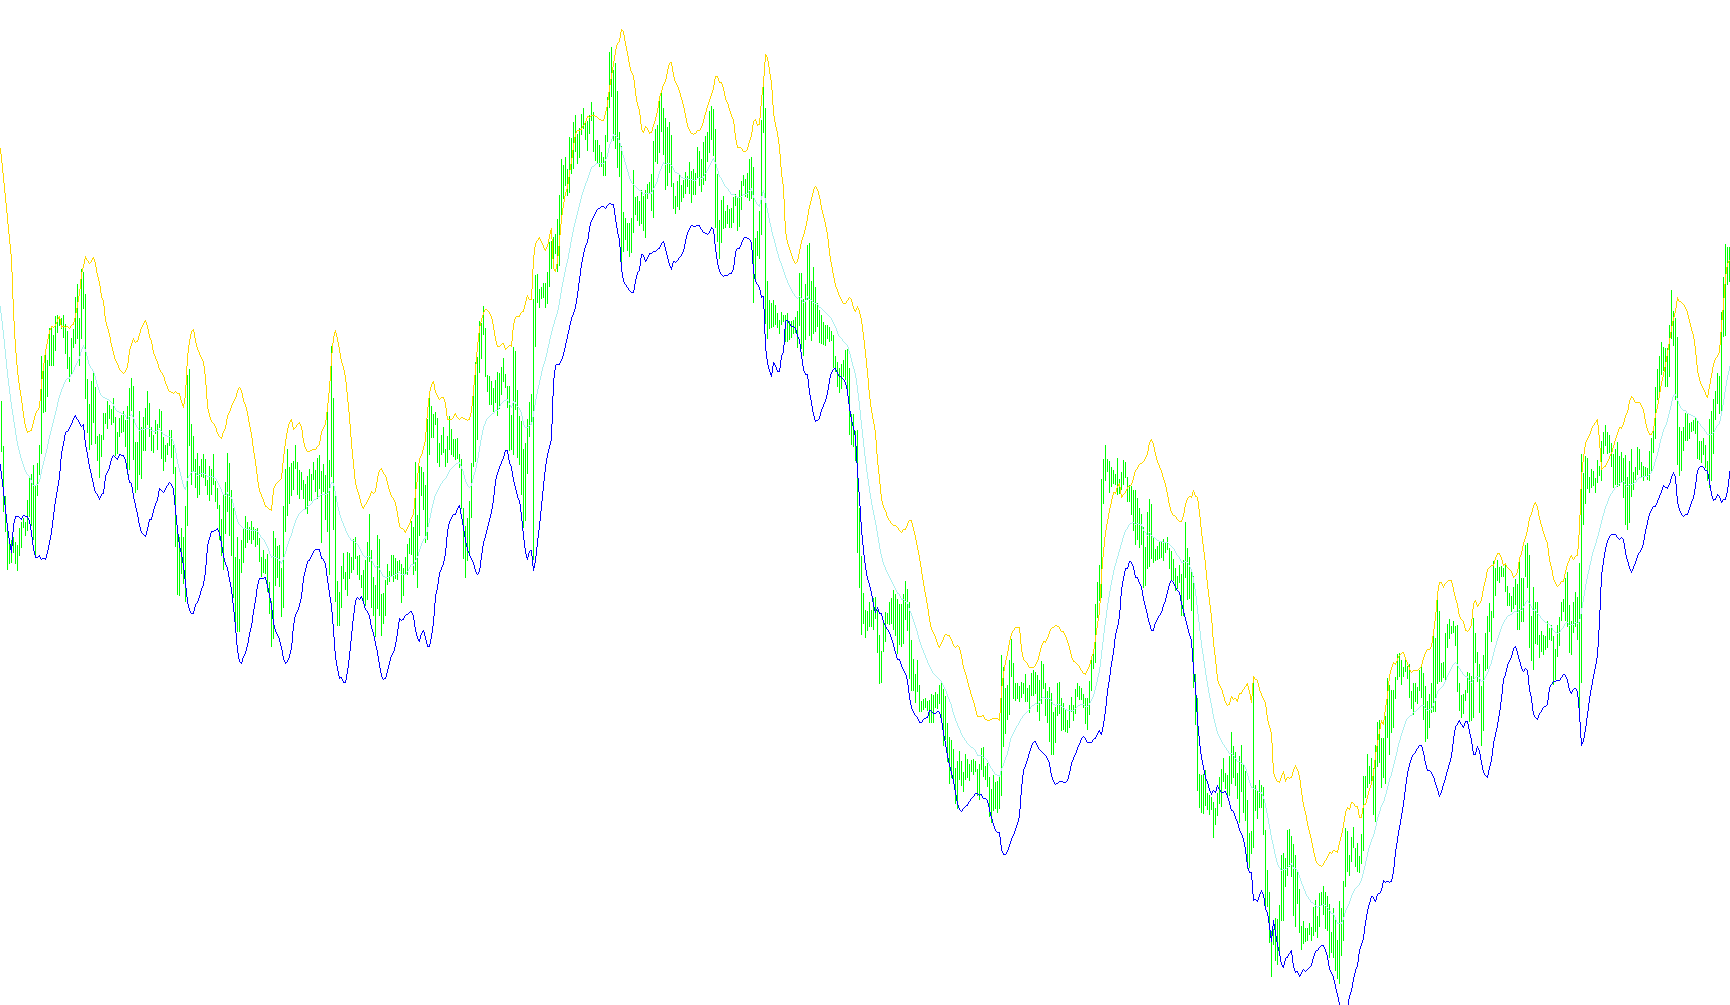
FractalsJPYDNv2
Indicator

FractalsJPYDNv2

iFractalsiATR
FractalsJPYUPv2
Indicator

FractalsJPYUPv2

iFractalsiATR
FX Sniper's Chandelier
Indicator

FX Sniper's Chandelier

iATR

This indicator calculates a trend-following protective stop loss by dynamically adjusting price levels based on a recursive Chandelier Exit algorithm combined with Average True Range (ATR) volatility.

FX Sniper's Chandelier_v1
Indicator

FX Sniper's Chandelier_v1

iATR

This indicator calculates a trailing stop-loss level by dynamically adjusting price boundaries based on the Average True Range (ATR) and historical price extremes.

FXA0 - RSI Crossing 50 plus ATR ver1.2
Indicator

FXA0 - RSI Crossing 50 plus ATR ver1.2

iATRiRSI

This indicator identifies bullish and bearish reversals by monitoring RSI crossovers at the 50-level midpoint while dynamically projecting entry targets and stop-losses based on ATR volatility scaling.

FXA0 - RSI Crossing 50 plus ATR ver1
Indicator

FXA0 - RSI Crossing 50 plus ATR ver1

iATRiRSI

This indicator identifies trend reversals and expansionary momentum by detecting Relative Strength Index crossings at the 50 equilibrium, while projecting ATR-based volatility targets and profit-taking levels.

FX_Snipers_Ergodic_CCI_Trigger_Signals
Indicator

FX_Snipers_Ergodic_CCI_Trigger_Signals

iATR

This indicator identifies trend reversals by detecting crossovers between the Ergodic CCI signal and its primary output, plotting directional arrows based on ATR-adjusted volatility thresholds.

Gideon's_ATR
Indicator

Gideon's_ATR

iATRiMAOnArray

This indicator quantifies relative market volatility by calculating the quotient of a short-term Average True Range over a long-term Average True Range, followed by a Smoothed Moving Average of that ratio.

Gideon's_ATR_v1
Indicator

Gideon's_ATR_v1

iATRiMAOnArray

This indicator quantifies market instability by calculating the quotient of short-term versus long-term Average True Ranges and smoothing the resulting ratio via a Simple Moving Median Average.

Hamyar Calculate
Indicator

Hamyar Calculate

iATR

This indicator computes dynamic pivot points based on high and low extremes while simultaneously capturing Average True Range (ATR) values across five distinct timeframes to analyze multi-dimensional price action.

Indicator

Hamyar-V2

iACiATRiMAiStdDev
harami_ma_rsi_macd
Indicator

harami_ma_rsi_macd

iATRiMACDiMAiRSI

This indicator identifies potential trend reversals by detecting Harami candlestick patterns validated through concurrent Moving Average, RSI momentum, and MACD trend filters.

HeikenAshiIdea
Indicator

HeikenAshiIdea

iATR

This automated trading system identifies momentum shifts by validating Heiken Ashi candle patterns against ATR-based volatility expansion to execute pending limit orders.

HLCrossSig for WPR
Indicator

HLCrossSig for WPR

iATRiWPRiMA

This indicator identifies trend reversal points by synchronizing high/low breakouts with Heiken Ashi price action filters and Williams %R overbought/oversold thresholds.

Indicator

HMA_Modified_sigalert

iATRiMAiMAOnArray
Indicator

HMA_Modified_sigalert_001

iATRiMAiMAOnArray
Hull_Style_ATR
Indicator

Hull_Style_ATR

iATRiMAOnArray

This indicator synthesizes an accelerated ATR calculation with a multi-method moving average to smooth volatility fluctuations and identify momentum shifts.

Hull_Style_ATR_v1
Indicator

Hull_Style_ATR_v1

iATRiMAOnArray

This indicator calculates a volatility metric by applying a Hull Moving Average transformation to an ATR-based calculation to filter noise and identify momentum trends.

Indicator

i-MA-ATR-ROC

iATRiMA
Indicator

Ind-Fractals-1b

iATR
Ind-NRTR-1
Indicator

Ind-NRTR-1

iATR

This indicator identifies trend shifts by monitoring price breaches of ATR-based volatility boundaries and dynamically updates support/resistance levels.

Ind-NRTR-3Period
Indicator

Ind-NRTR-3Period

iATR

This indicator identifies directional momentum by dynamically adjusting volatility-based support and resistance levels across H1, H4, and D1 timeframes.

Ind-NRTR
Indicator

Ind-NRTR

iATR

This indicator identifies dynamic trend reversals by monitoring price breaches of volatility-adjusted ceilings and floors derived from ATR calculations.

Ind-NRTR_v1
Indicator

Ind-NRTR_v1

iATR

This indicator identifies trend shifts by calculating volatility-adjusted price boundaries and detecting breakout signals based on ATR-scaled buffers.

indi2csv
Indicator

indi2csv

iCCIiATRiMACDiRSI

Synchronizes historical price action and multiple technical oscillators into a structured CSV format for external quantitative analysis.

indicatorarrows
Indicator

indicatorarrows

iMACDiOsMAiMAiStochastic
InstTrendLine_v1
Indicator

InstTrendLine_v1

iATRiMA

An advanced trend identification system utilizing a multi-stage signal processing pipeline involving complex smoothing, Hilbert transform-based cycle detection, and notch filters to isolate dominant market movements from noise.

iStochTxt
Indicator

iStochTxt

iATRiStochastic

This indicator identifies momentum shifts by detecting Stochastic main line crossovers relative to a user-defined volatility-adjusted threshold while overlaying price and timestamp labels.

ivchannel_breakout_basic
Indicator

ivchannel_breakout_basic

iATR

Identifies trend reversals by detecting price breaches of nested high-low channels while dynamically projecting stop-loss levels based on ATR volatility.

i_dayatr_v1_1
Indicator

i_dayatr_v1_1

iATR

Calculates a rolling Average True Range by dynamically identifying and counting the specific number of daily candles within a user-defined timeframe.

JJN-Bee
Indicator

JJN-Bee

iATR

This indicator identifies trend reversals by detecting price action pierces through the previous candle's open level, projecting dynamic entry, take-profit, and stop-loss zones based on Average True Range volatility.

JJN-Scalper
Indicator

JJN-Scalper

iATR

This indicator identifies high-probability reversal zones by detecting price breaches of the nearest significant opposing candle's open price while utilizing Average True Range for dynamic volatility-based profit and loss targets.

JMA BBSQUEEZE
Indicator

JMA BBSQUEEZE

iATRiStdDev

This indicator identifies market compression by comparing linear regression slopes against a volatility ratio derived from standard deviation and average true range.

K-#MTF_shi_channel_1[1].1
Indicator

K-#MTF_shi_channel_1[1].1

iATR

This indicator identifies structural price channels by connecting recursive fractal highs and lows to project dynamic trend boundaries and median equilibrium lines.

Kase CD Peak
Indicator

Kase CD Peak

iATRiMAOnArrayiStdDevOnArray

This indicator quantifies price action symmetry by normalizing high-low spreads against ATR and applying multi-stage smoothing to identify momentum shifts and volatility extremes.

Indicator

KaseCD Peak oscilator

iATRiMA
KasePeakOscilator_v1
Indicator

KasePeakOscilator_v1

iATRiMAOnArrayiStdDevOnArray

This indicator identifies trend reversals by calculating a relative high-low variance normalized by volatility and filtering momentum shifts through moving average deviations.

KC
Indicator

KC

iATRiMA

This indicator generates a dynamic corridor by offsetting an Exponential Moving Average by a multiple of the Average True Range to visualize price volatility limits.

KC_v1
Indicator

KC_v1

iATRiMA

This indicator calculates a dynamic trading channel by offsetting an Exponential Moving Average by a multiplier of the Average True Range to identify volatility-based extremes.

KC_v2
Indicator

KC_v2

iATRiMA

This indicator projects a dynamic trading corridor by calculating the deviation of an Exponential Moving Average based on a multiplier of the Average True Range.

Keltner Channels B
Indicator

Keltner Channels B

iATRiMA

This indicator calculates a centralized moving average baseline flanked by upper and lower boundaries derived from customized range-based volatility offsets.

Keltner Channels F
Indicator

Keltner Channels F

iATRiMA

This indicator calculates a central moving average flanked by upper and lower boundaries derived from the product of K-factor and either Average True Range or custom range variance.

Keltner Channels1
Indicator

Keltner Channels1

iATRiMA

This indicator projects a multi-layered channel by calculating a moving average baseline and expanding it based on either ATR values or the mean price range to visualize market expansion.

Keltner_ATR_Band mt4
Indicator

Keltner_ATR_Band mt4

iATRiMA

This indicator calculates dynamic price boundaries by projecting a multiple of the Average True Range onto a Simple Moving Average to identify extreme volatility deviations.

Keltner_ATR_Band mt4_v1
Indicator

Keltner_ATR_Band mt4_v1

iATRiMA

The indicator plots upper and lower bounds by applying a configurable multiplier of the Average True Range to a Simple Moving Average baseline.

Keltner_ATR_Band
Indicator

Keltner_ATR_Band

iATRiMA

This indicator maps price boundaries by calculating the sum of a Simple Moving Average and the product of a multiplier against the Average True Range.

Keltner_ATR_Bands
Indicator

Keltner_ATR_Bands

iATRiMA

This indicator plots dynamic upper and lower boundaries by offsetting a Simple Moving Average with a multiplier of the Average True Range to identify extreme price excursions.

Keltner_ATR_Band_v1
Indicator

Keltner_ATR_Band_v1

iATRiMA

This indicator projects dynamic upper and lower boundaries by offsetting a Simple Moving Average with a multiplier of the Average True Range to identify extreme price deviations.

Keltner_Chanel
Indicator

Keltner_Chanel

iATRiMA

This indicator generates a dynamic trading channel by projecting an Exponential Moving Average boundary outward based on a multiple of the Average True Range.

kino_2ATRaboveLimit
Indicator

kino_2ATRaboveLimit

iATR

The indicator classifies market volatility by comparing two distinct Average True Range periods against a predefined numerical limit to identify synchronized high, low, or divergent volatility states.