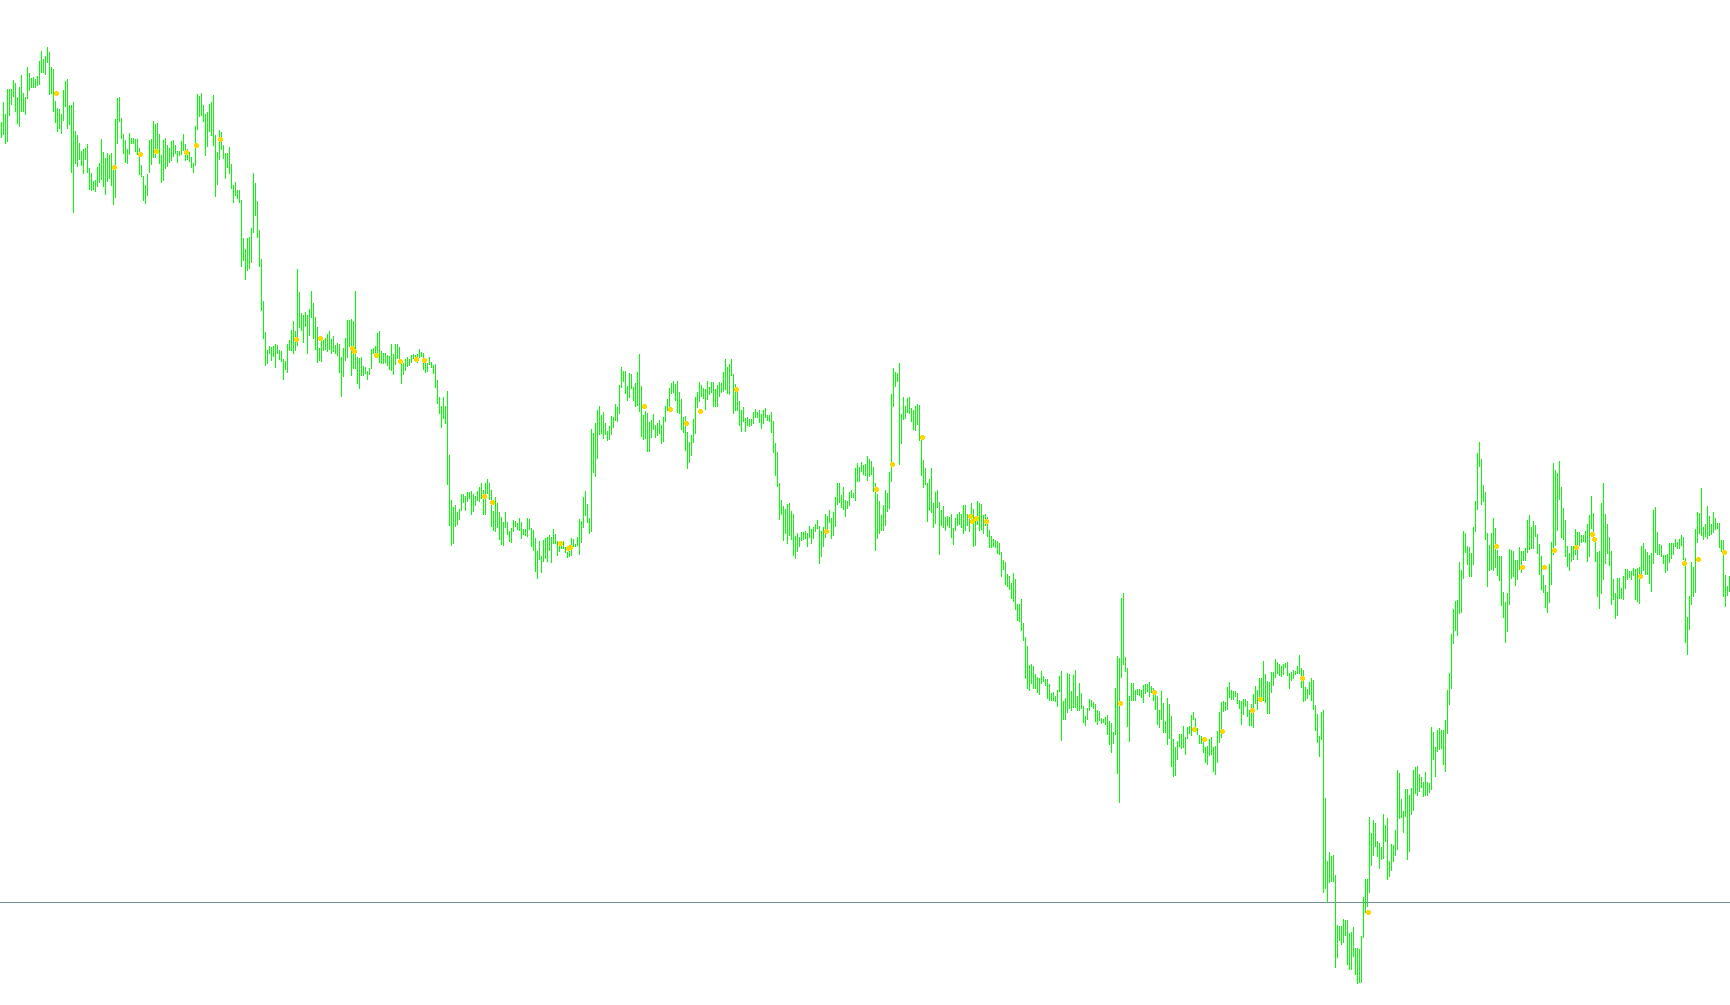
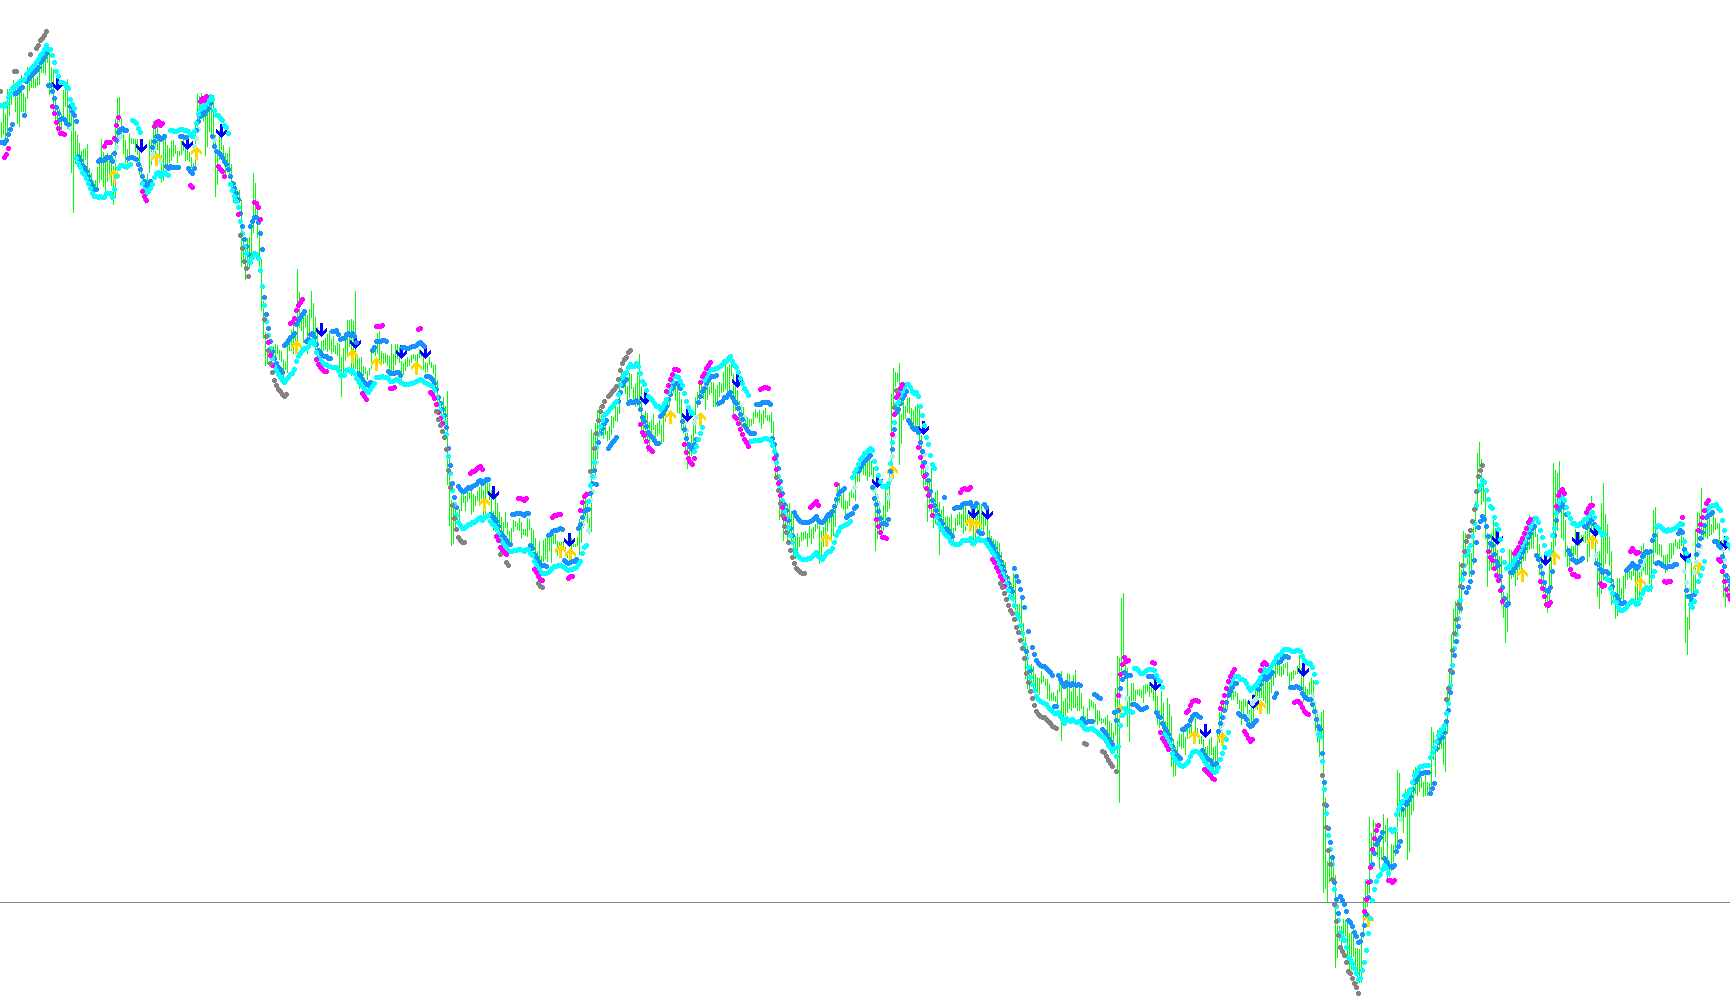
#Pretty_t3_LK_V1.2
Indicator

#Pretty_t3_LK_V1.2

iATRiMA

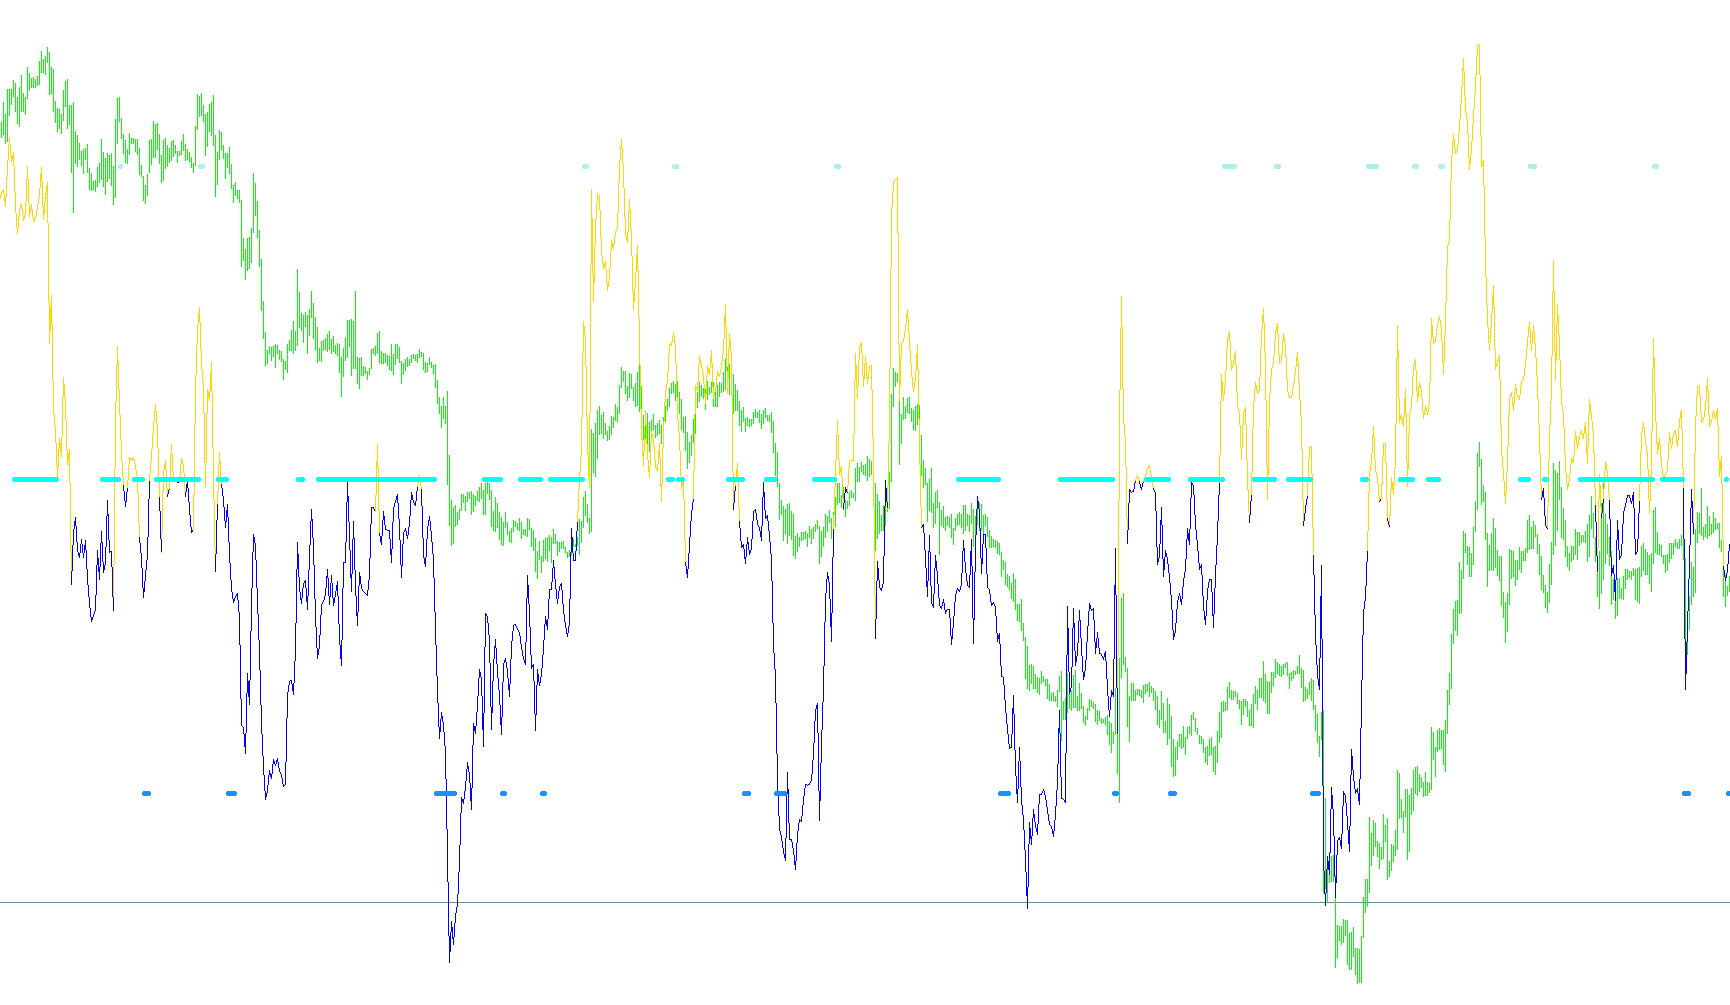
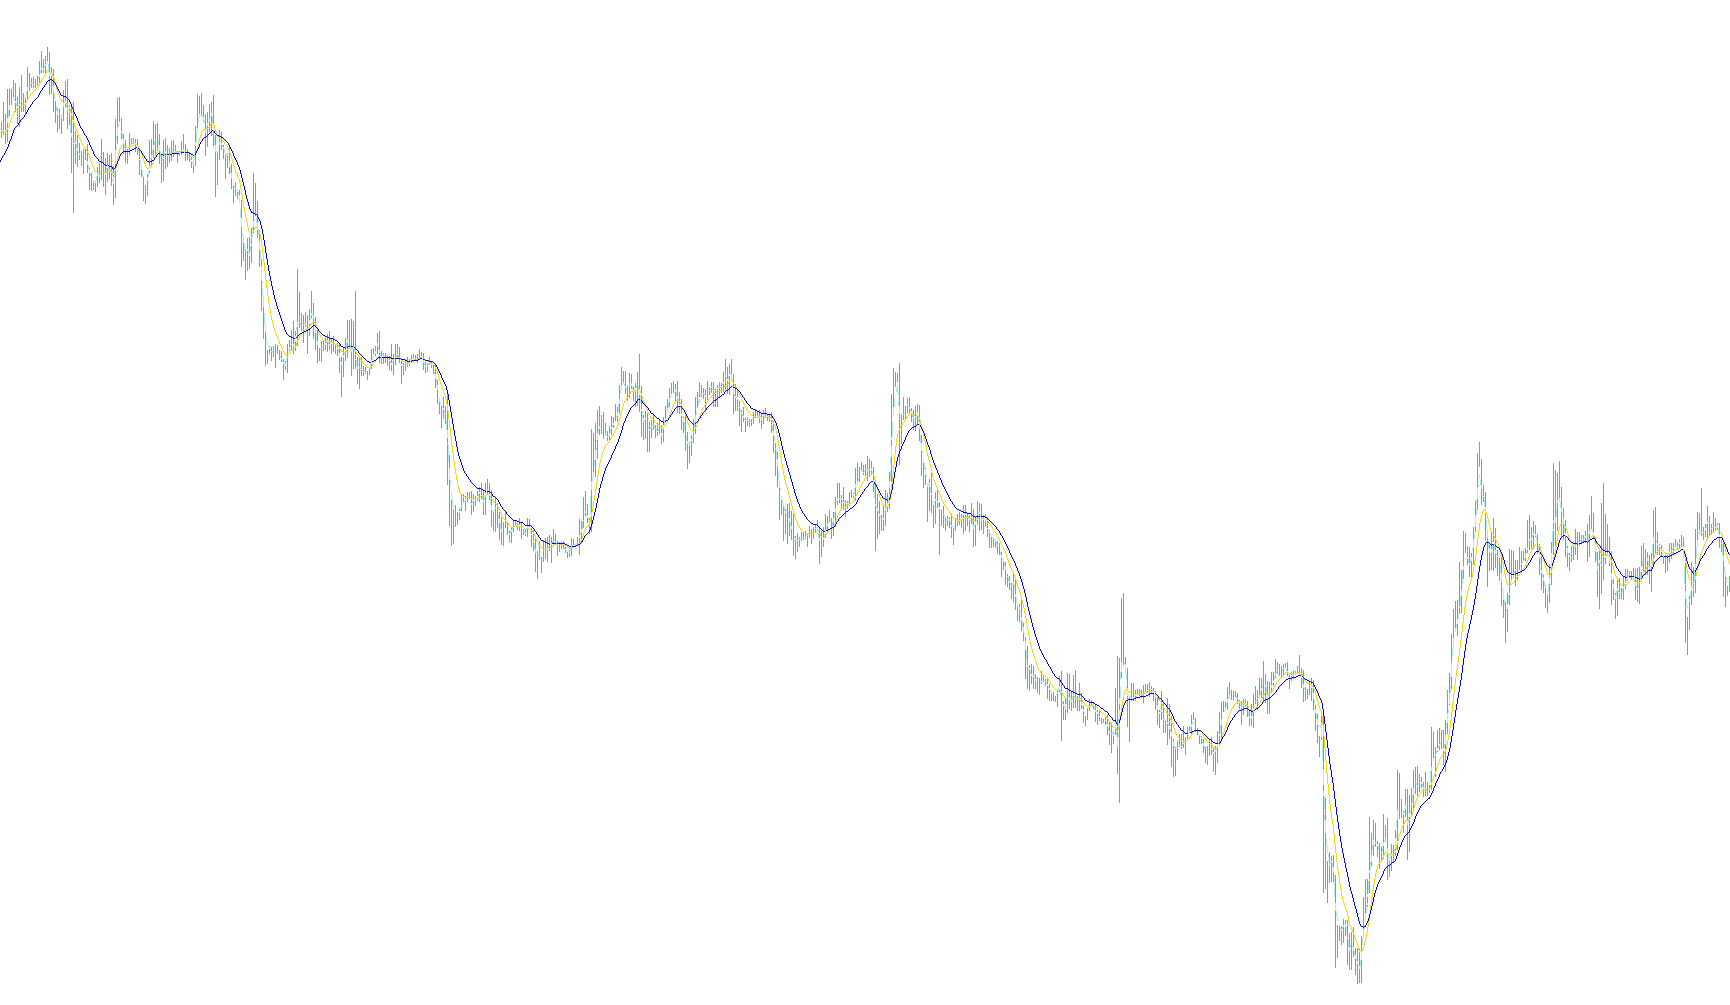
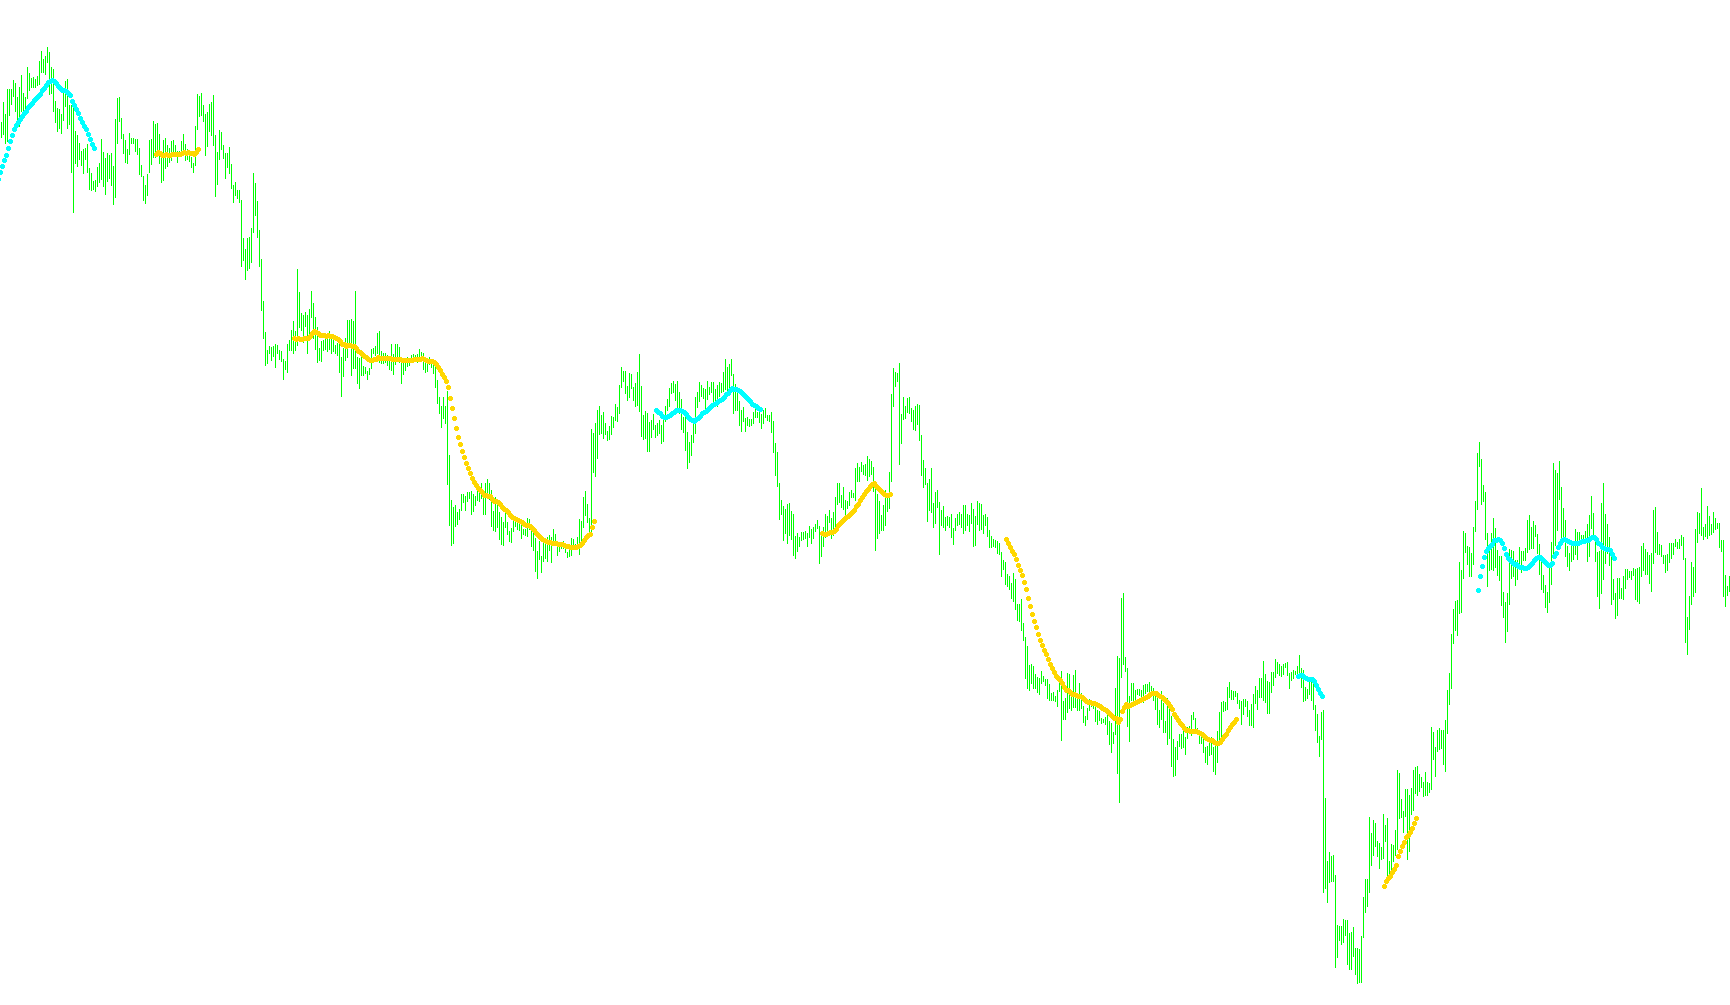
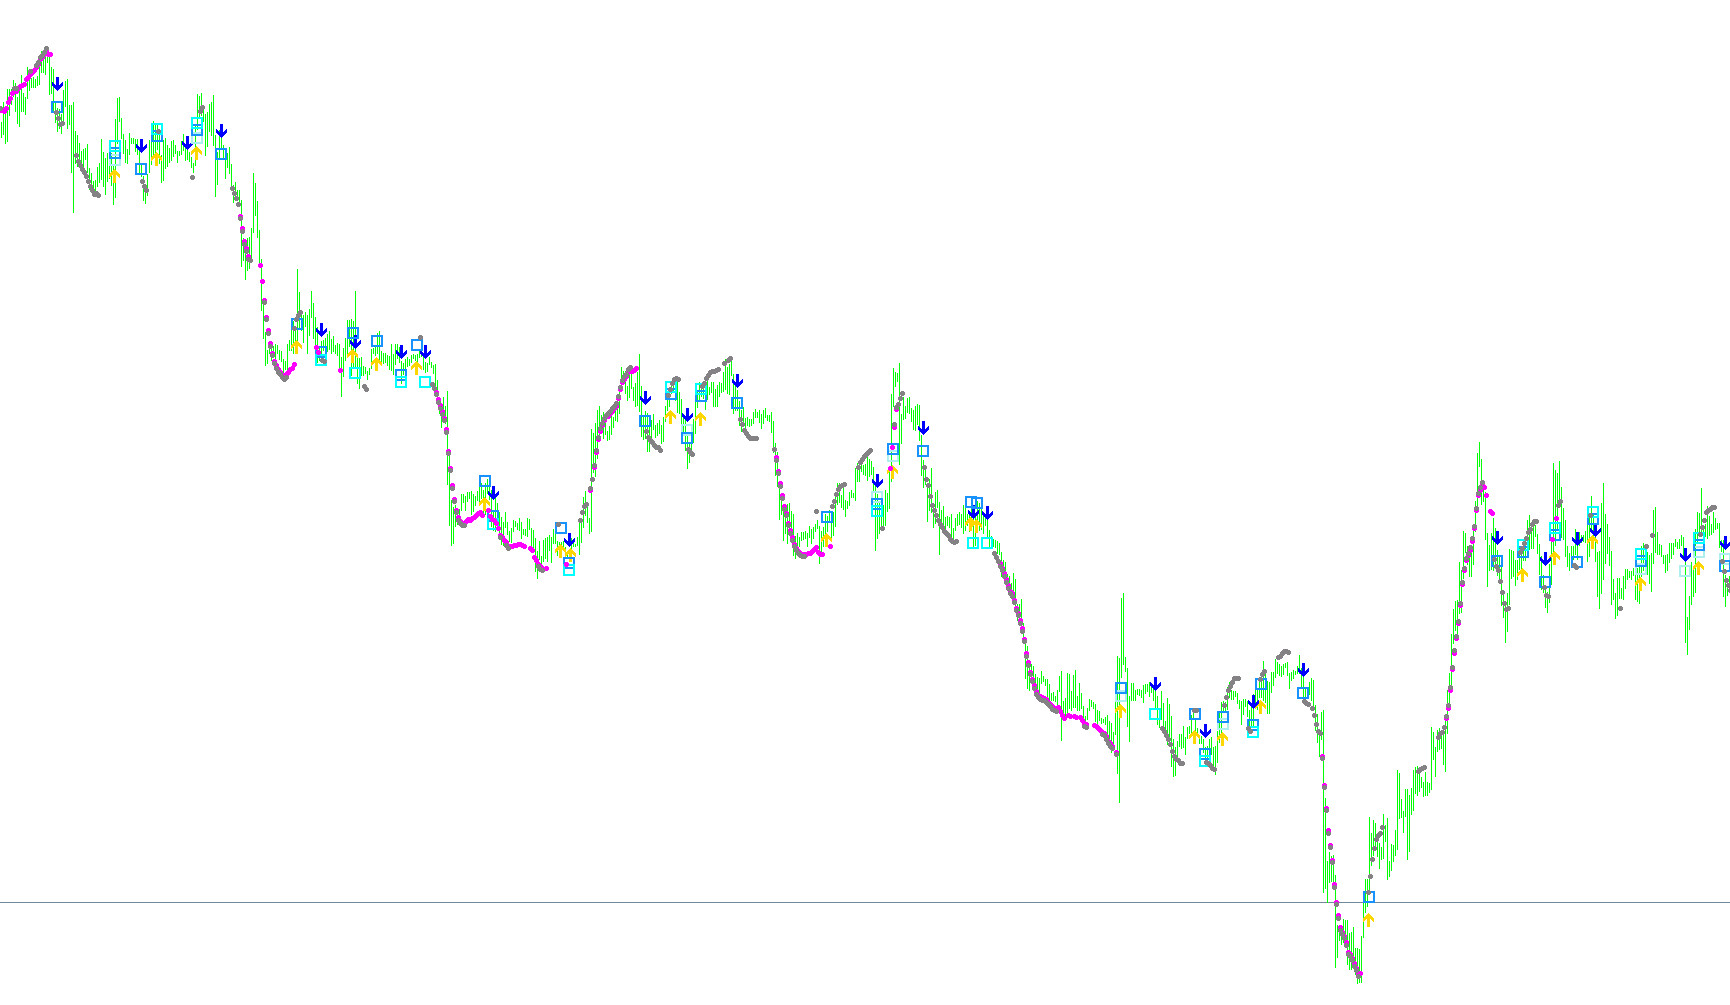
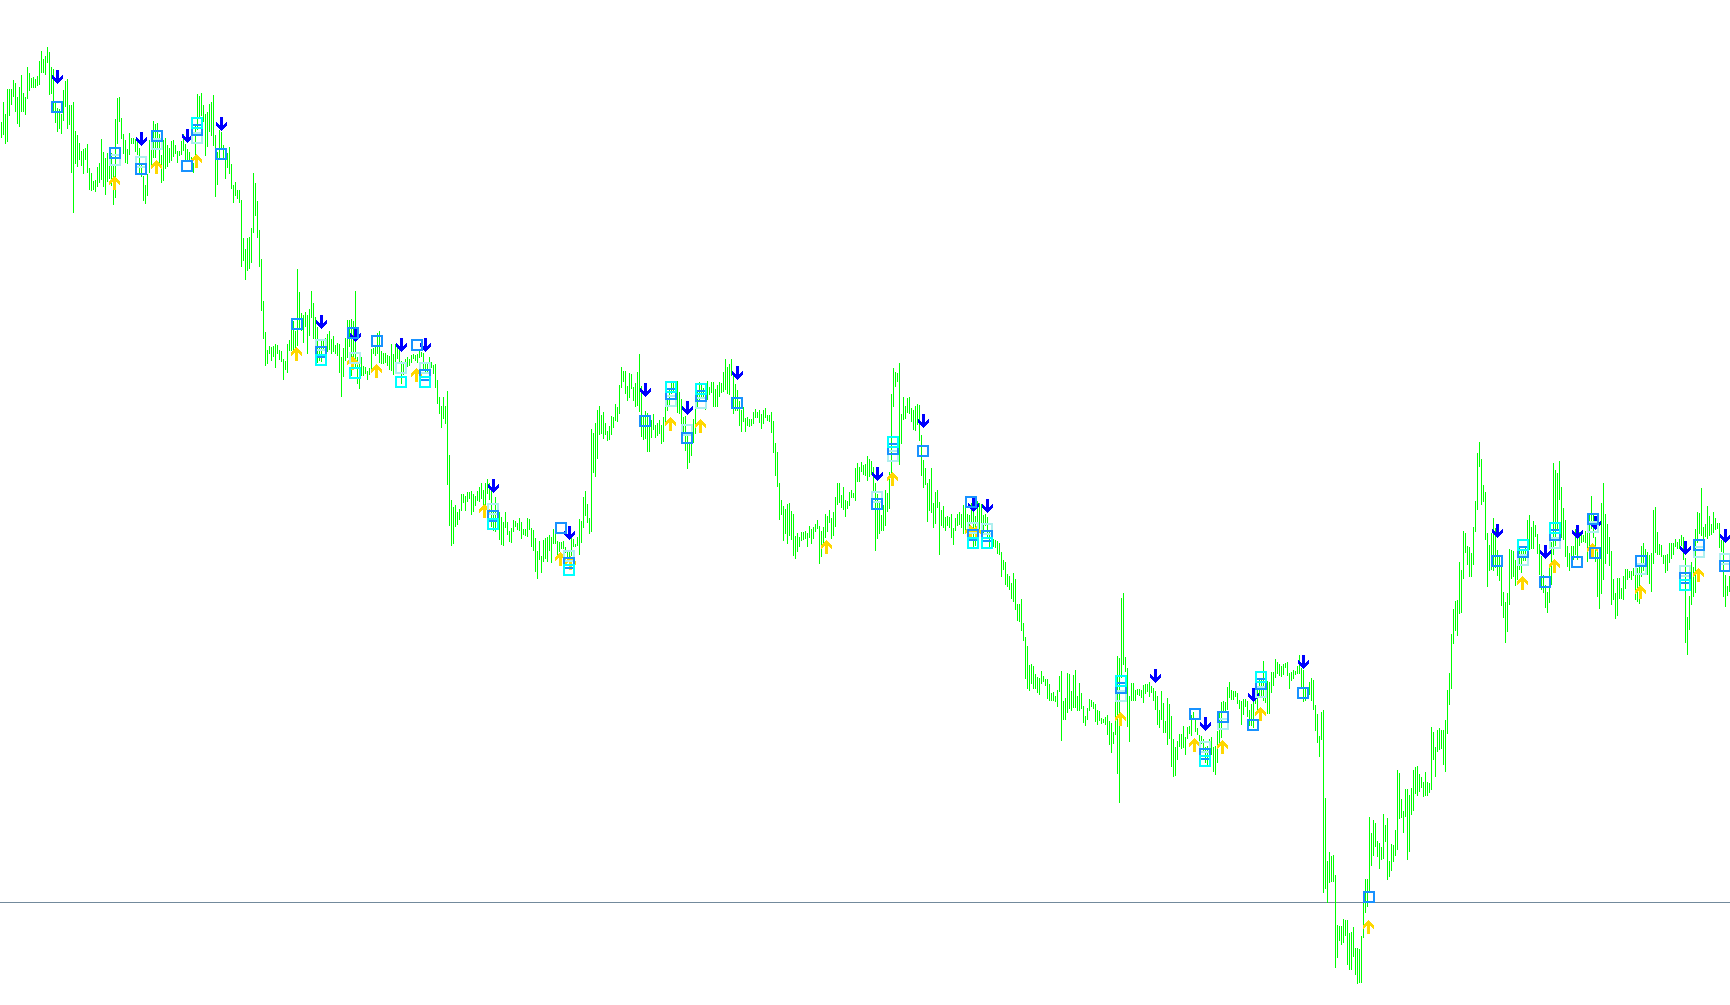
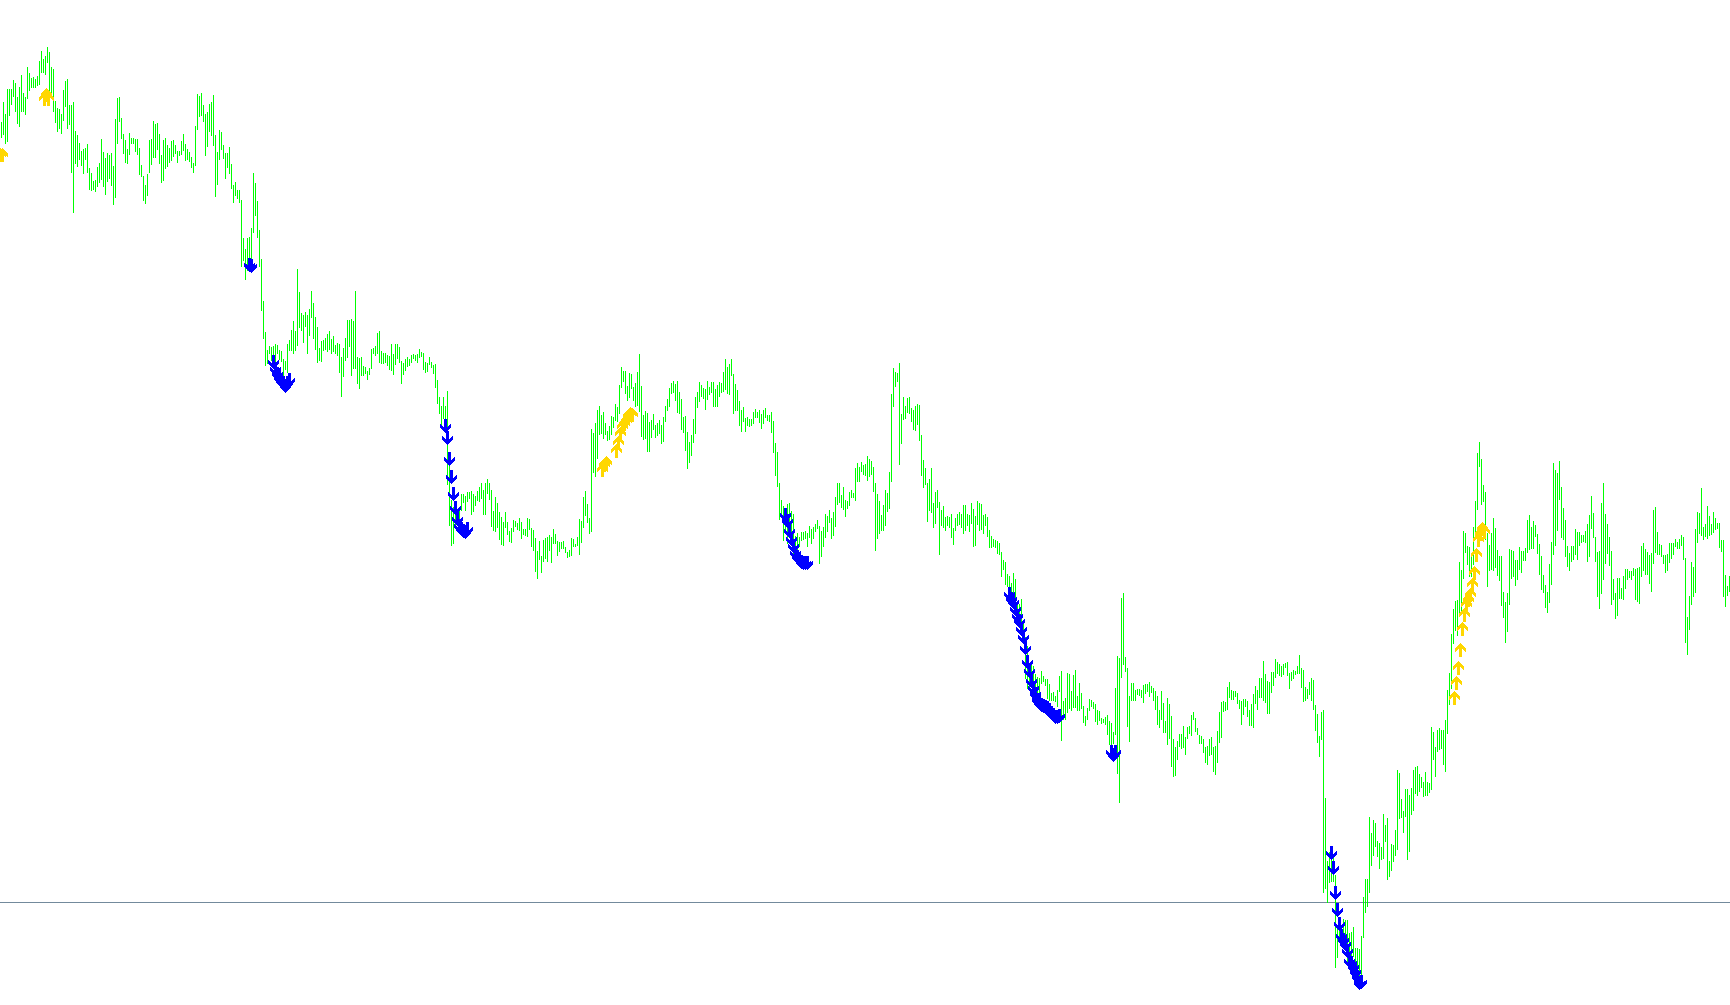
This indicator utilizes a triple-smoothed T3 moving average combined with an inverse Fisher transform on the rate of change to identify trend direction and intensity via a responsive RGB color shift.

#Pretty_t3_LK_V1.2_001
Indicator

#Pretty_t3_LK_V1.2_001

iATRiMA

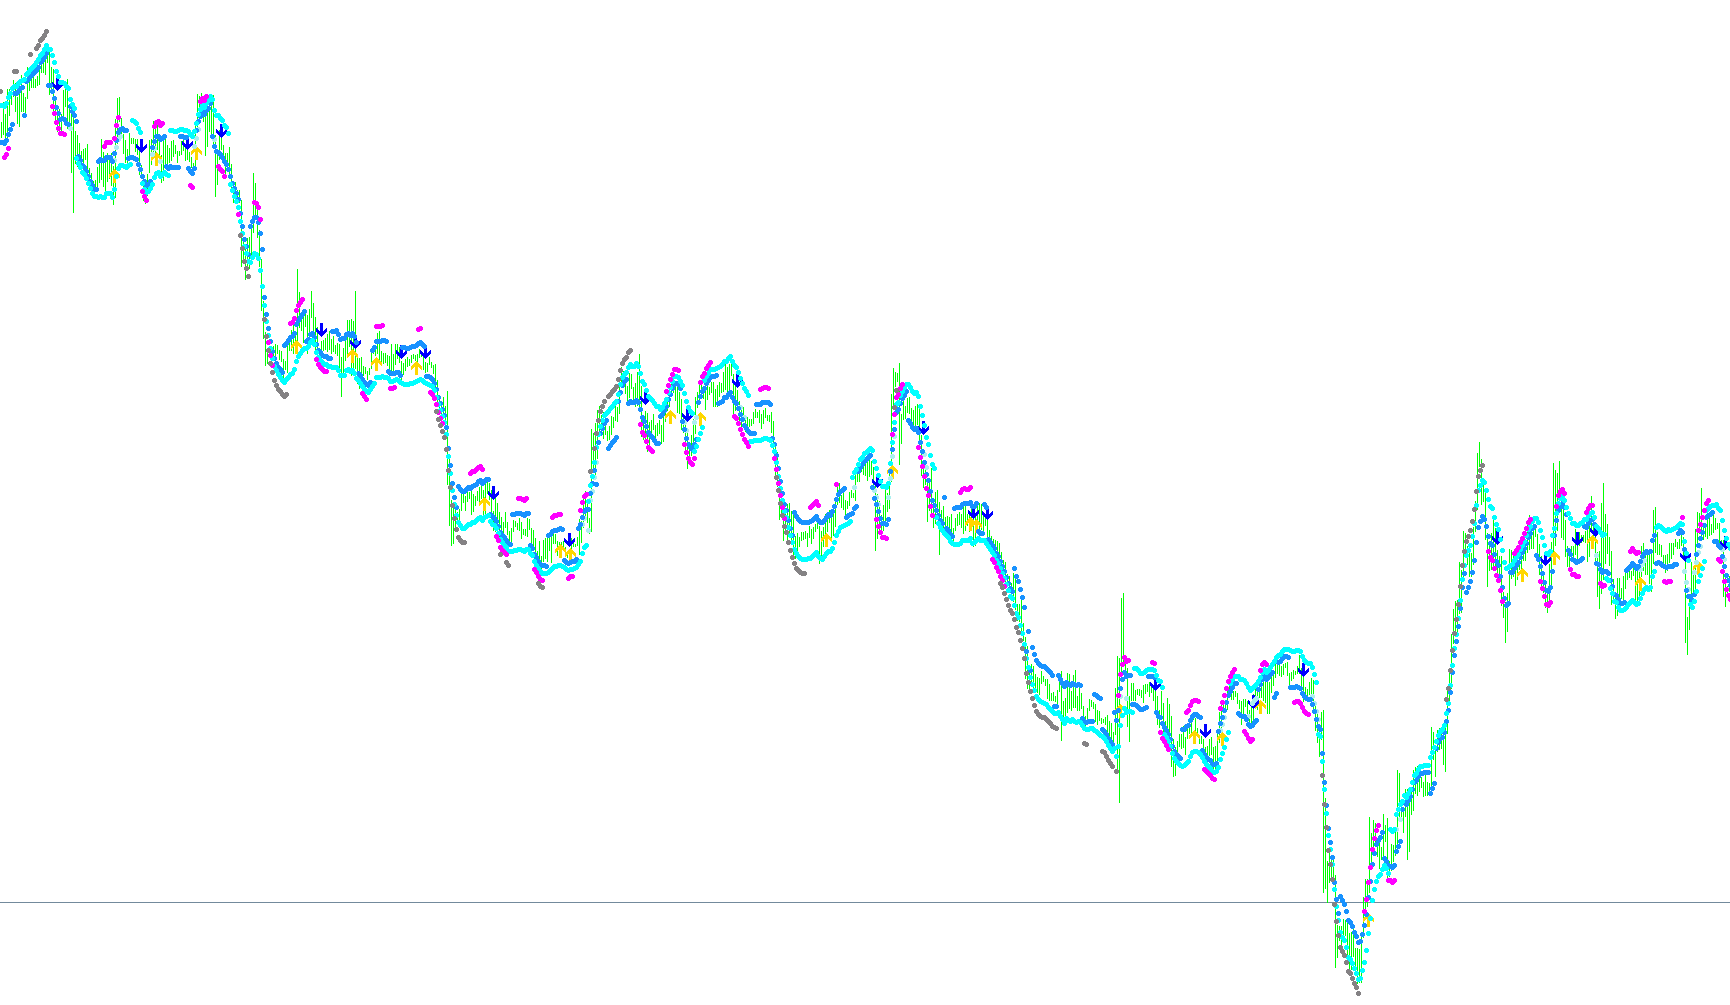
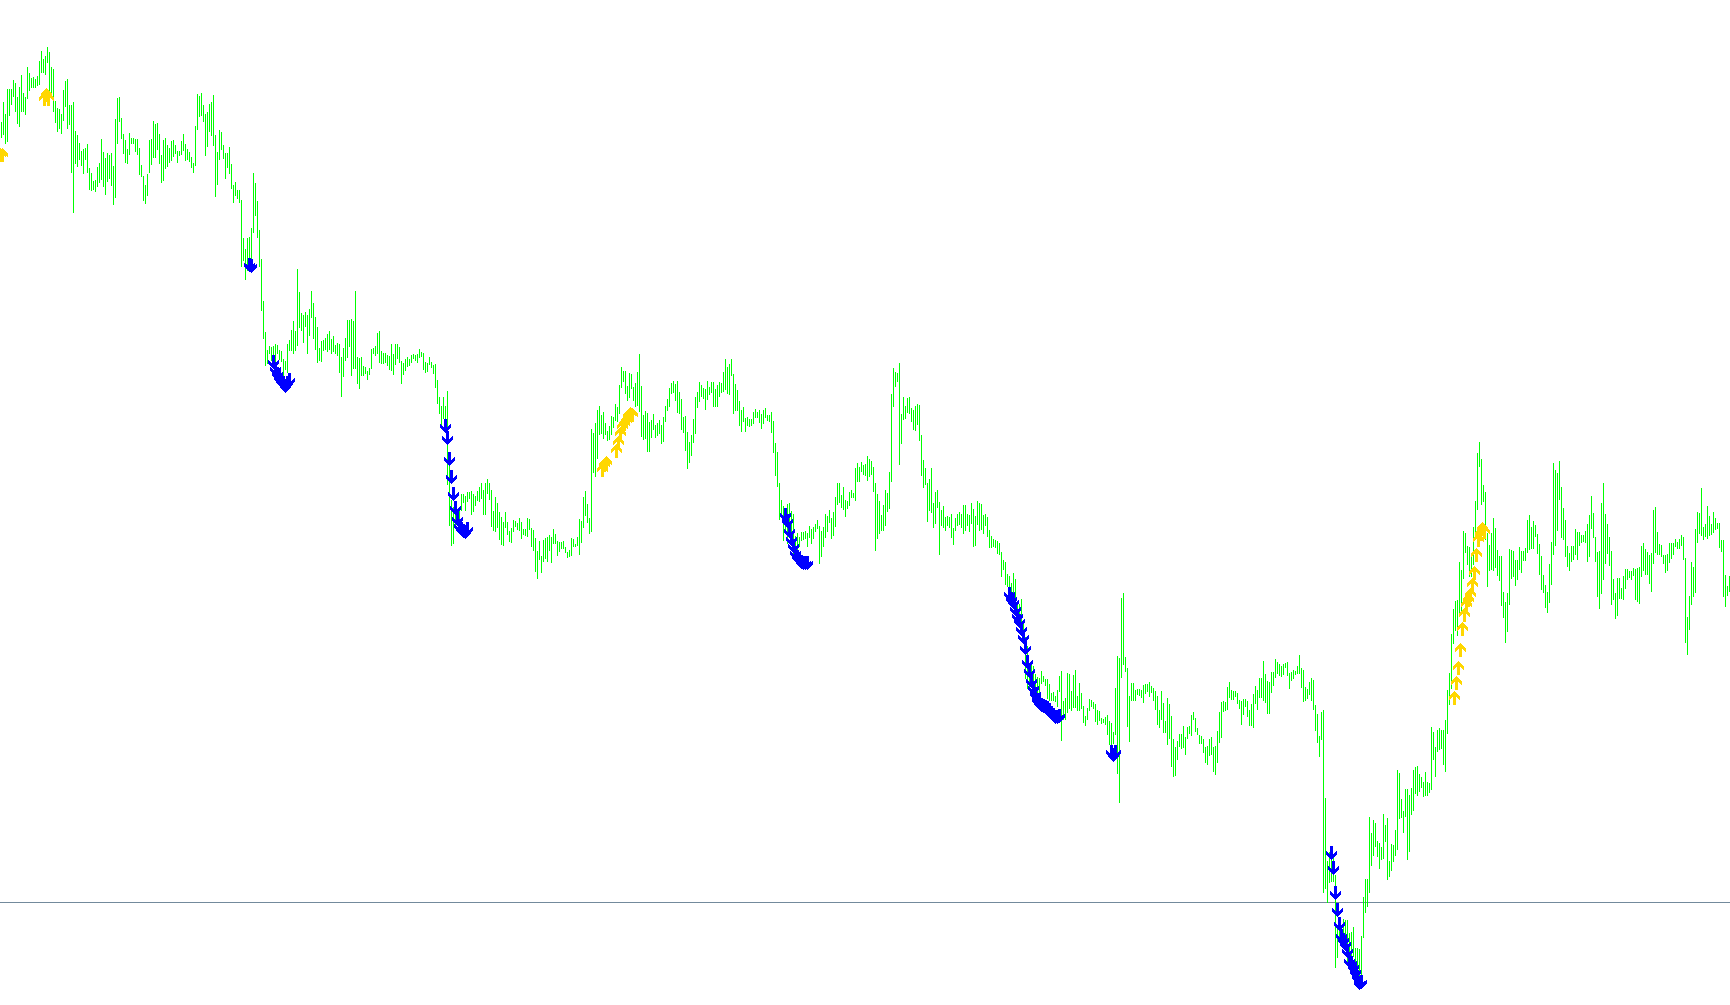
This indicator utilizes a multi-stage recursive moving average combined with an Inverse Fisher Transform and ATR normalization to visualize real-time momentum shifts via dynamic color-coded gradients.

#WSS943!INDICATOR-6
Indicator

#WSS943!INDICATOR-6

iMACDiADXiMAiRSI
#_FullSSA_normalize
Indicator

#_FullSSA_normalize

iMAiStdDev

This indicator applies a singular spectrum decomposition to normalized price deviations to identify non-linear trend reversals via extreme local maxima and minima.

#_LinRegres_Neuro_GA
Indicator

#_LinRegres_Neuro_GA

iMAiStdDev

This indicator utilizes a genetic algorithm to optimize the weights of a two-layer artificial neural network that processes multiple linear regression slopes to generate smoothed trend signals.

$BBS
Indicator

$BBS

iATRiMAiStdDev
$BIAS
Indicator

$BIAS

iMA

This indicator quantifies market sentiment by comparing the current closing price against a fast exponential moving average to determine directional strength and trend progression.

(Plagiat)
Indicator

(Plagiat)

iMAiMAOnArray

This indicator calculates a smoothed momentum signal by applying a weighted moving average to the difference between two nested Hull-style moving averages to identify trend reversals.

Indicator

(T_S_R) SIGNAL Alert Alarm GMT_Shift

iMA
Indicator

(T_S_R) SIGNAL Alert_Alarm #7

iMA
(T_S_R)-Daily Range Calculator
Indicator

(T_S_R)-Daily Range Calculator

iMA

This indicator calculates multi-period daily price ranges to derive an average volatility metric, projecting potential room for movement and suggesting optimal stop-loss levels based on a user-defined risk-to-reward ratio.

(T_S_R)-Daily Range Calculator
Indicator

(T_S_R)-Daily Range Calculator

iMA

This indicator calculates rolling average daily ranges across multiple timeframes to project real-time potential price movement and determine risk-adjusted stop-loss coordinates.

Indicator

(T_S_R)-Daily Range Display#4_TEXTSHIFT

iMA
Indicator

(T_S_R)-DATA WINDOW#2

iMA
(T_S_R)-Execute Line 2
Indicator

(T_S_R)-Execute Line 2

iMAiMAOnArray

This indicator calculates the trend trajectory by processing the variance between dual weighted moving averages to generate a smoothed directional slope.

(T_S_R)range2
Indicator

(T_S_R)range2

iMA

This indicator calculates multi-period daily price ranges to project potential volatility and dynamically determine risk-adjusted stop-loss levels based on a user-defined reward-to-risk ratio.

(T_S_R)range2 _new
Indicator

(T_S_R)range2 _new

iMA

This indicator calculates multi-period daily price ranges to project potential overhead room and determine automated stop-loss levels based on a user-defined risk-to-reward ratio.

Indicator

+JoGET#58+

iMAiMAOnArrayiStdDevOnArray
+RSI-TC
Indicator

+RSI-TC

iBandsiATRiMAiRSI
+RSI-TC_v2
Indicator

+RSI-TC_v2

iBandsiATRiMAiRSI
-- Heiken_Ashi_Ma_T3
Indicator

-- Heiken_Ashi_Ma_T3

iMA

This indicator synthesizes T3 moving average smoothing with Heiken Ashi price action logic to identify trend reversals through momentum shift crossovers.

-- Heiken_Ashi_Ma_T3_002
Indicator

-- Heiken_Ashi_Ma_T3_002

iMA

This indicator synthesizes T3 moving average smoothing with Heiken Ashi price action logic to identify trend reversals through momentum-shifted price candles.

0 MA_of_MA cw
Indicator

0 MA_of_MA cw

iMAiMAOnArray

The indicator calculates a primary moving average and then applies two successive secondary moving averages onto that initial series to smooth out noise and identify long-term trend momentum.

Indicator

00test_0S7ma_rsi

iMAiRSIOnArrayiStochastic
Indicator

0MasTrend_C

iMA
0_-_ma_candles_two_colors
Indicator

0_-_ma_candles_two_colors

iMA

This indicator paints candlestick wicks and bodies in different colors based on whether a faster moving average (MA) is above or below a slower moving average.

0_MoR_signalTable_test1
Indicator

0_MoR_signalTable_test1

iWPRiMA
100ma_qual
Indicator

100ma_qual

iMA

This indicator identifies structural momentum by detecting specific directional crossovers between 25-period and 100-period linear weighted moving averages, filtering for sustained trend maturity over a 30-bar threshold.

100ma_qual_v1
Indicator

100ma_qual_v1

iMA

This indicator identifies structural trend shifts by detecting momentum crossovers between 25-period and 100-period Linear Weighted Moving Averages, filtering for high-confidence signals through a 30-bar duration requirement.
10Min_01
Indicator

10Min_01

iMACDiMAiRSIiStochastic

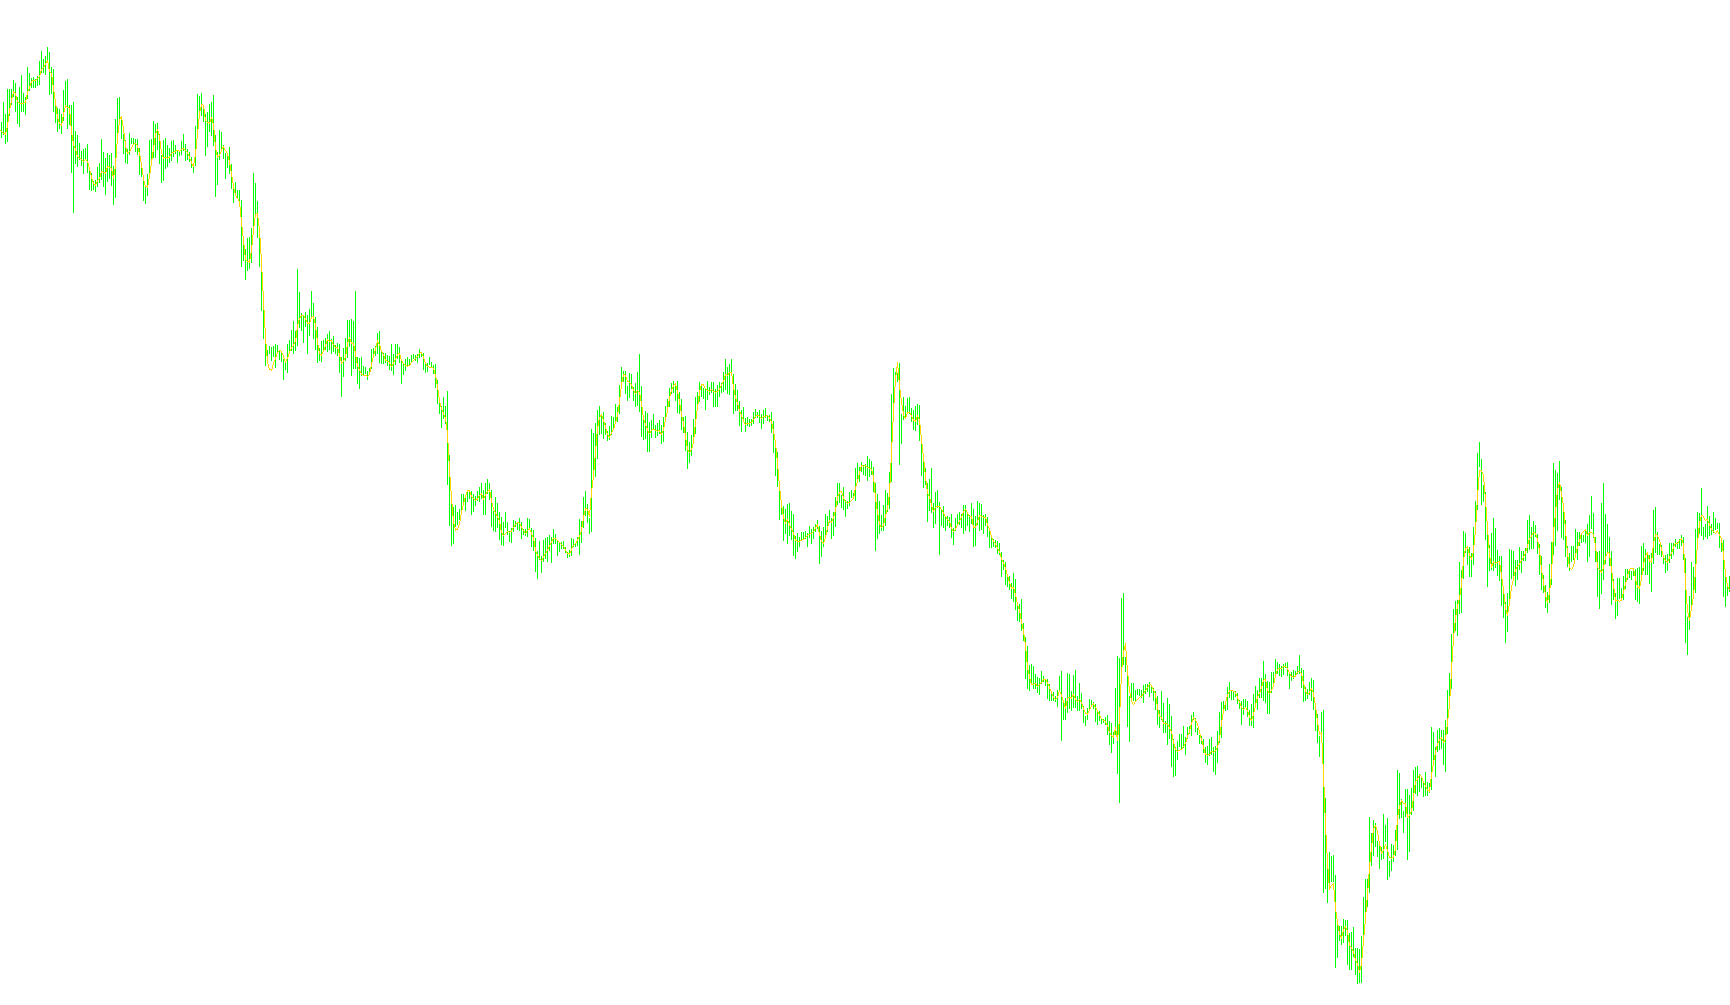
Identifies market inflection points by detecting momentum crossovers between weighted and simple moving averages across multiple oscillators.
10Min_011
Indicator

10Min_011

iMACDiMAiRSIiStochastic

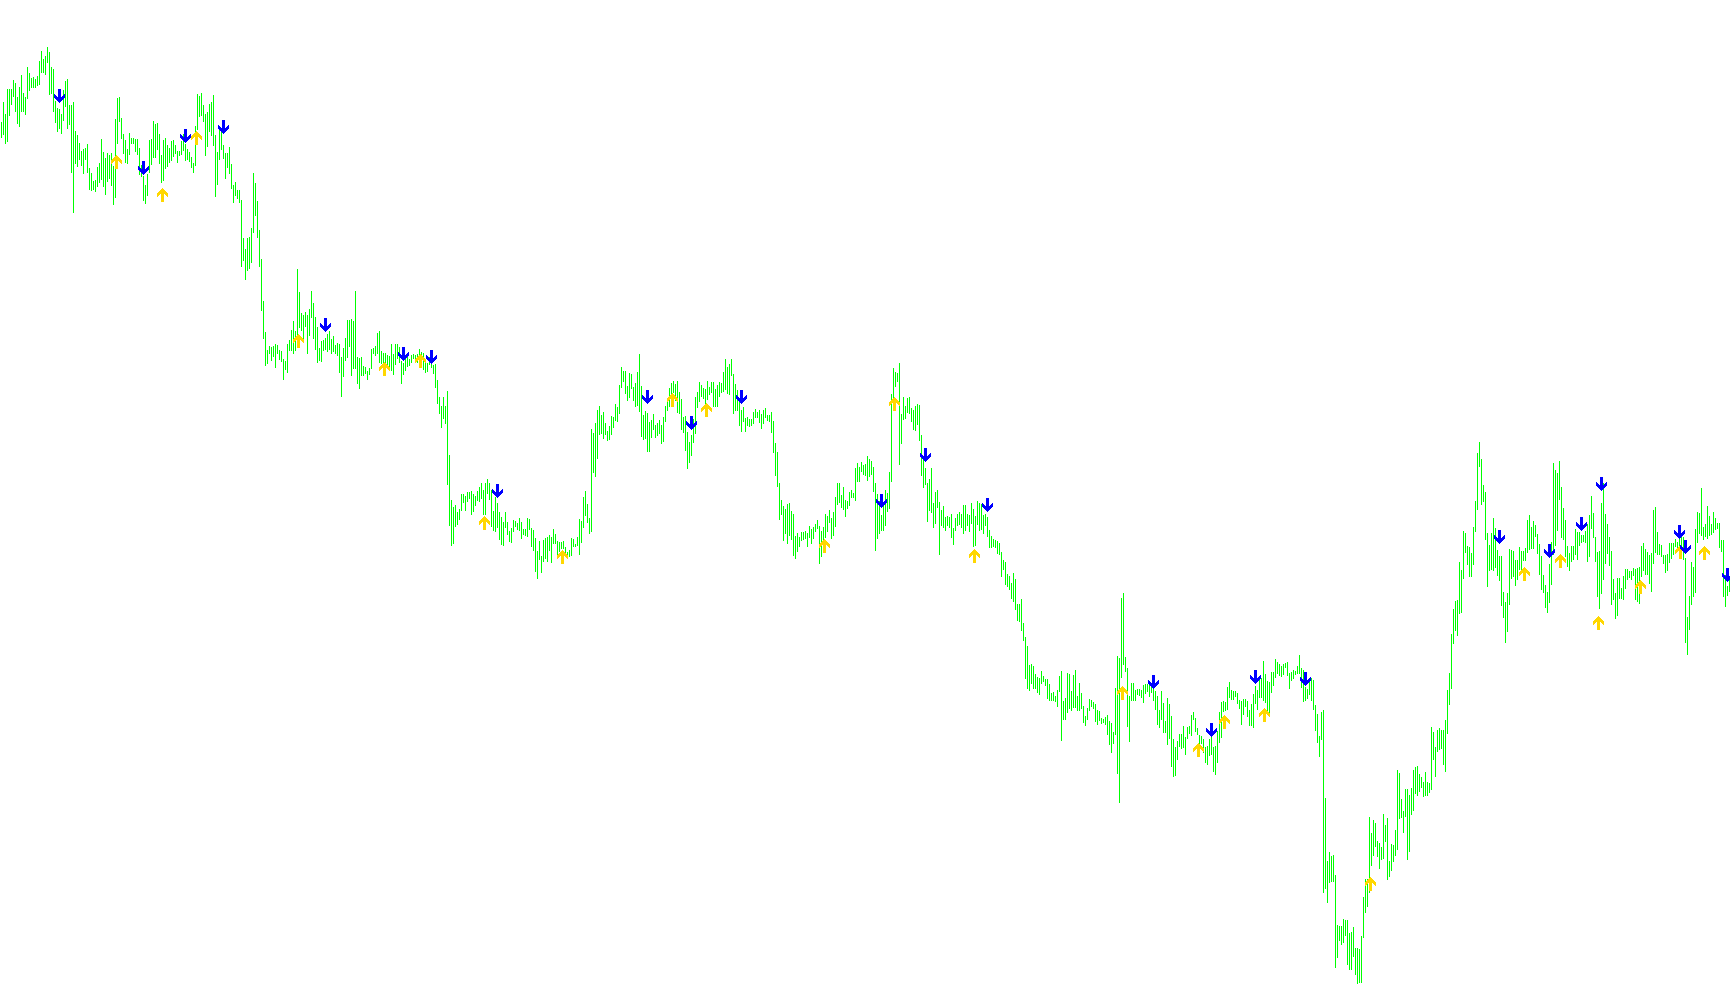
This indicator identifies trend reversals by detecting Weighted Moving Average crossovers synchronized with Stochastic, RSI, and MACD momentum filters.

10Min_011a
Indicator

10Min_011a

iMACDiMAiRSIiStochastic

This indicator identifies high-probability trade entries by synthesizing weighted moving average crossovers, RSI momentum shifts, and stochastic oscillator divergences.

10Min_011a_v1
Indicator

10Min_011a_v1

iMACDiMAiRSIiStochastic

This indicator identifies bullish and bearish entries by synchronizing moving average crossovers with RSI volatility thresholds, Stochastic momentum spreads, and MACD signal polarity.

10Min_011a_v2
Indicator

10Min_011a_v2

iMACDiMAiRSIiStochastic

This indicator identifies high-probability entry points by synchronizing Weighted/Simple Moving Average crossovers with RSI momentum shifts, MACD trend positioning, and Stochastic oscillator extremes.

10Min_011_v1
Indicator

10Min_011_v1

iMACDiMAiRSIiStochastic

This indicator identifies high-probability trend reversals by synchronizing weighted moving average crossovers with momentum shifts from Stochastic, RSI, and MACD oscillators.

10Min_012
Indicator

10Min_012

iMACDiMAiRSIiStochastic

This indicator identifies trend reversal points by synchronizing Weighted Moving Average crossovers with RSI threshold shifts, Stochastic main/signal positioning, and MACD signal line polarity.

10Min_012_v1
Indicator

10Min_012_v1

iMACDiMAiRSIiStochastic

This indicator identifies high-probability trend reversals by synchronizing Weighted Moving Average crossovers with RSI momentum shifts, Stochastic oscillator alignment, and MACD signal position.

10Min_01_v1
Indicator

10Min_01_v1

iMACDiMAiRSIiStochastic

Identifies high-probability momentum shifts by detecting the precise intersection of Linear Weighted and Simple Moving Averages.

10Min_2ind
Indicator

10Min_2ind

iMAiRSIiStochastic

This indicator identifies trend reversals by detecting Weighted Moving Average crossovers relative to Simple Moving Averages, filtered through Stochastic momentum shifts and RSI strength thresholds.

10Min_2ind_v1
Indicator

10Min_2ind_v1

iMAiRSIiStochastic

This indicator identifies momentum shifts by detecting Weighted Moving Average crossovers against Simple Moving Averages, filtered through RSI threshold breaches and Stochastic Main/Signal polarity.

10Min_RsiSto_01
Indicator

10Min_RsiSto_01

iMACDiMAiRSIiStochastic

This indicator identifies high-probability reversals by detecting simultaneous extreme overbought and oversold conditions across consecutive RSI and Stochastic oscillators.

10Min_RsiSto_01_v1
Indicator

10Min_RsiSto_01_v1

iMACDiMAiRSIiStochastic

This indicator identifies high-probability reversal zones by detecting sustained RSI overbought/oversold conditions synchronized with extreme Stochastic oscillator thresholds.

10nonlag
Indicator

10nonlag

iMA

This indicator calculates a low-latency moving average by applying a cosine-based weighting coefficient combined with a standard deviation threshold to filter out noise and visualize momentum shifts.

18_28Cross
Indicator

18_28Cross

iMA

This indicator identifies trend reversals by detecting simultaneous bullish or bearish crossovers between two customizable moving averages using a price-range offset for signal visualization.

1_Min_MicroTrading
Indicator

1_Min_MicroTrading

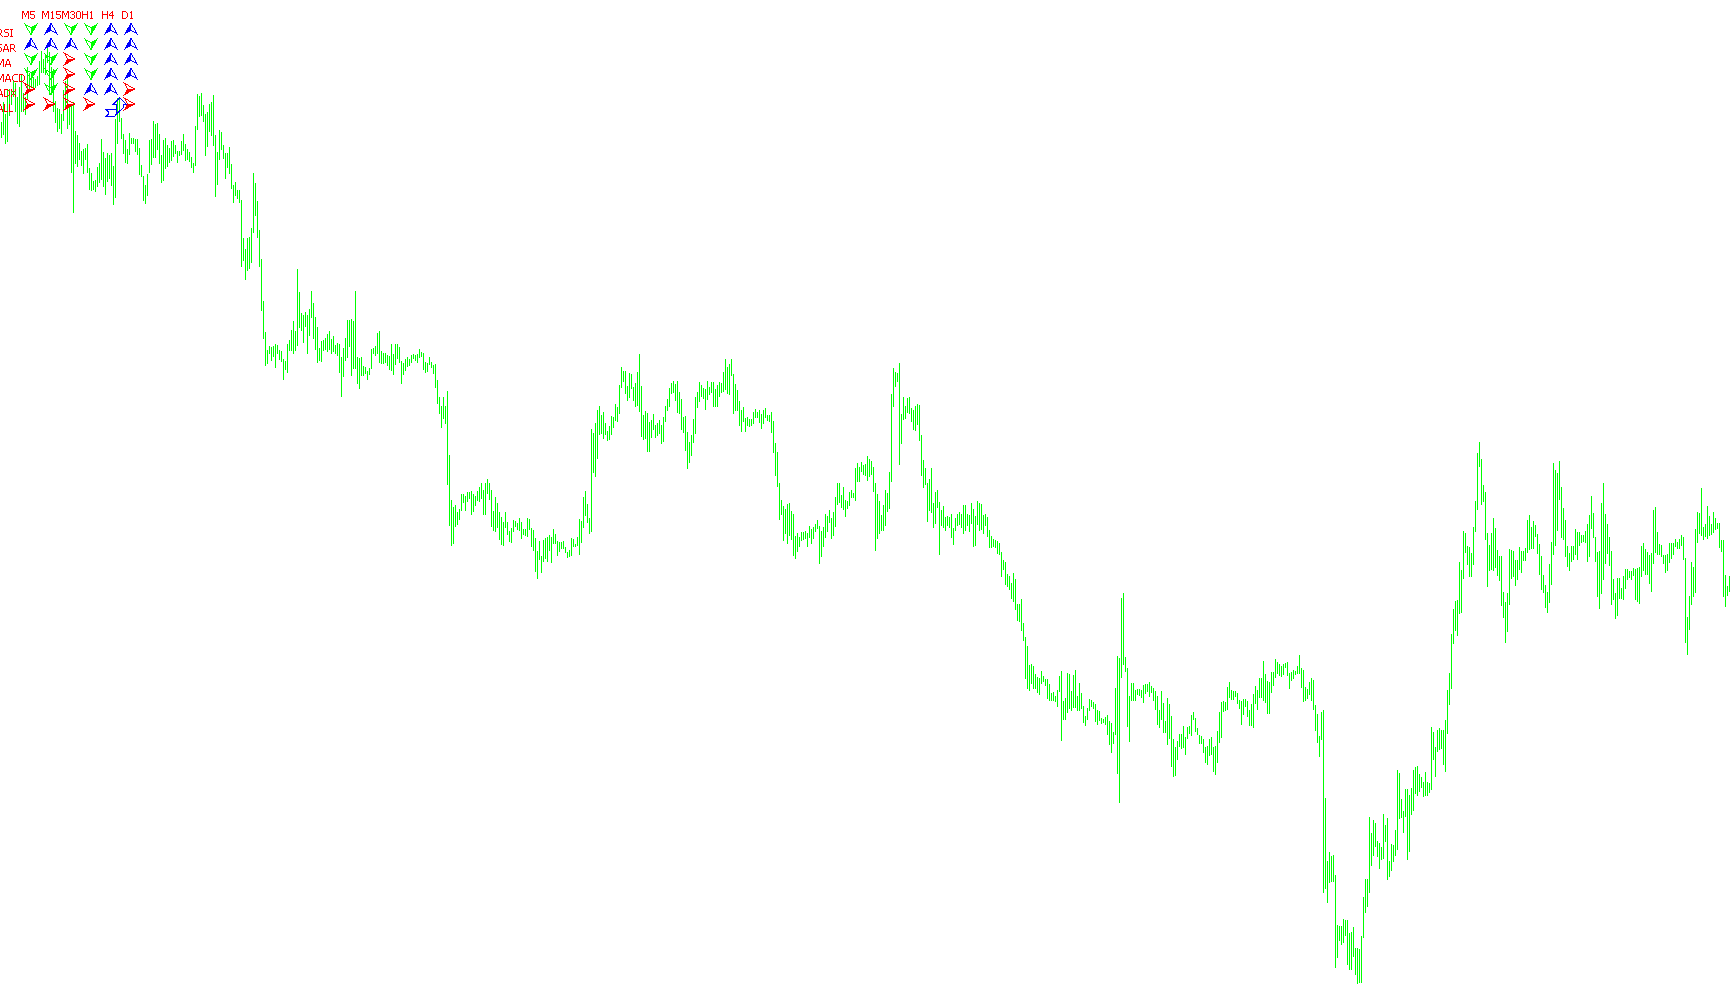
iMACDiADXiMA

This indicator aggregates real-time signals from RSI, Parabolic SAR, Moving Averages, MACD, and ADX across six distinct timeframes to identify synchronized trend confirmations.

2
Indicator

2

iMA

Identifies specific price points where moving average trajectories flip positions using visual arrow signals placed above or below the candle range.

22-FIBTunnel
Indicator

22-FIBTunnel

iMA

This indicator projects dynamic support and resistance zones by offsetting a 233-period Exponential Moving Average with specific Fibonacci sequence intervals.

2MA Crossover
Indicator

2MA Crossover

iMA

Detects precise bullish and bearish momentum shifts by identifying the crossover of two customizable moving average types with integrated visual markers and push notifications.

2MA Crossover2-mtf
Indicator

2MA Crossover2-mtf

iMA

This indicator identifies trend reversals by detecting the precise intersection of two customizable moving averages and plots directional arrows with real-time visual and electronic alerts.

2MA CrossoverWithPrice
Indicator

2MA CrossoverWithPrice

iMA

This indicator identifies precise trend reversals by detecting the intersection of two customizable moving averages and projects visual markers based on local price volatility.