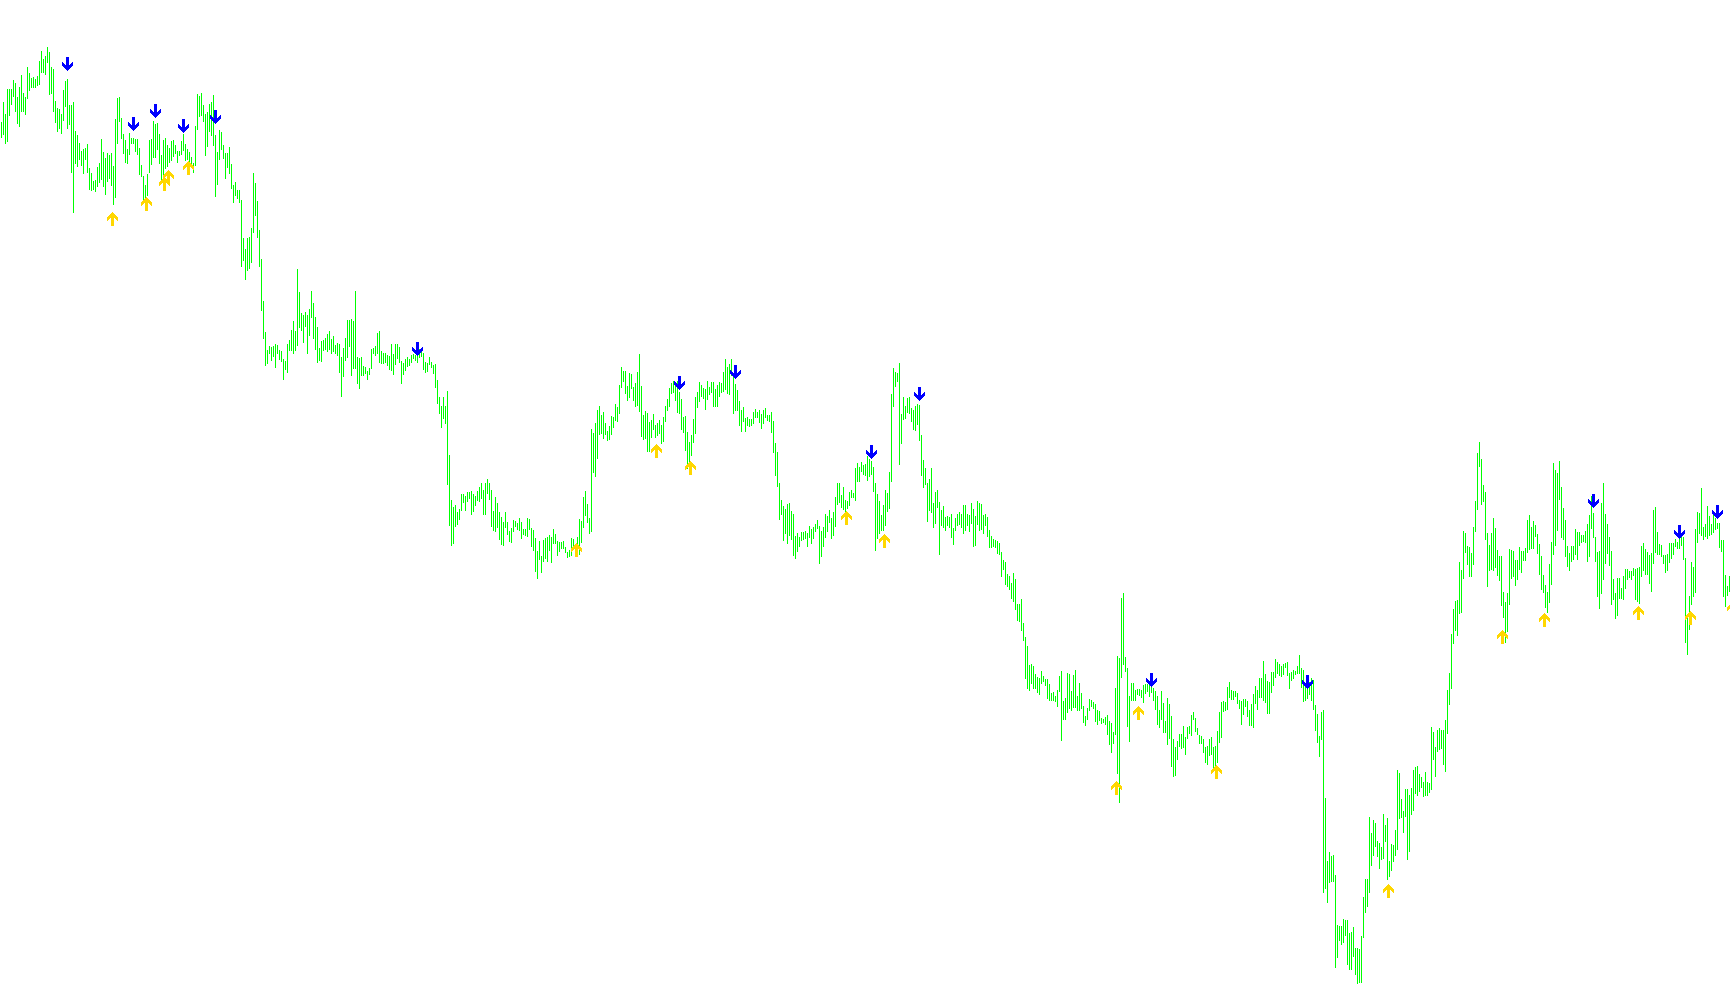
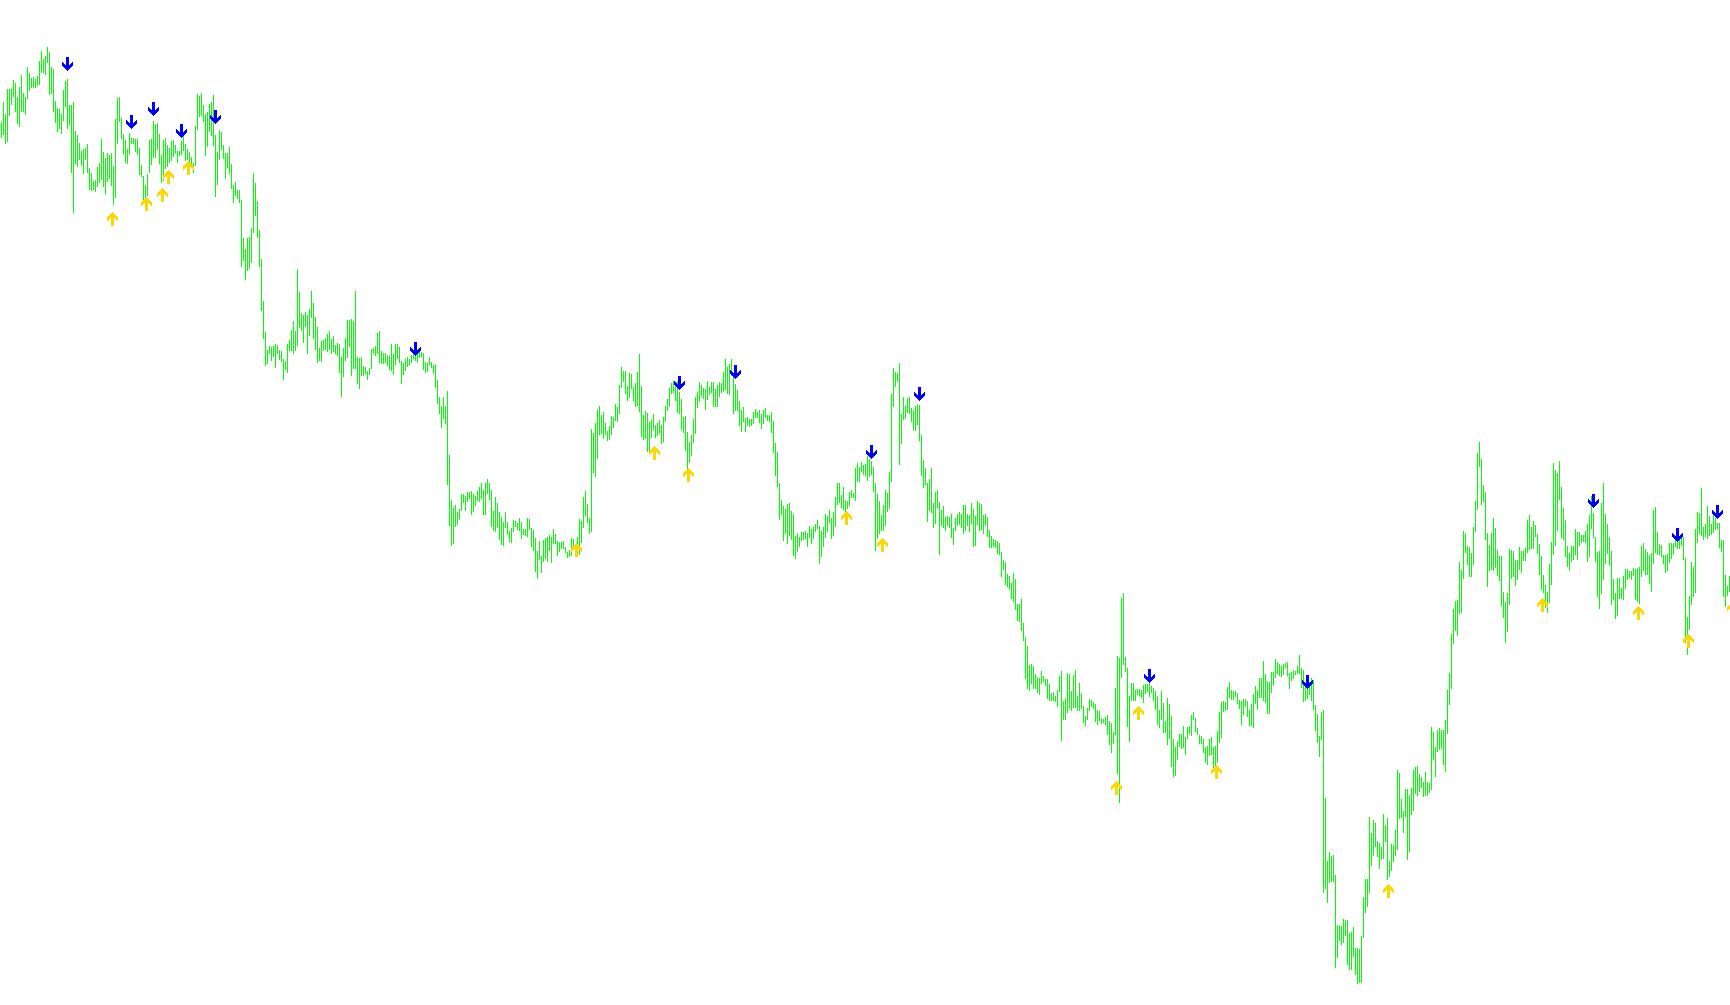
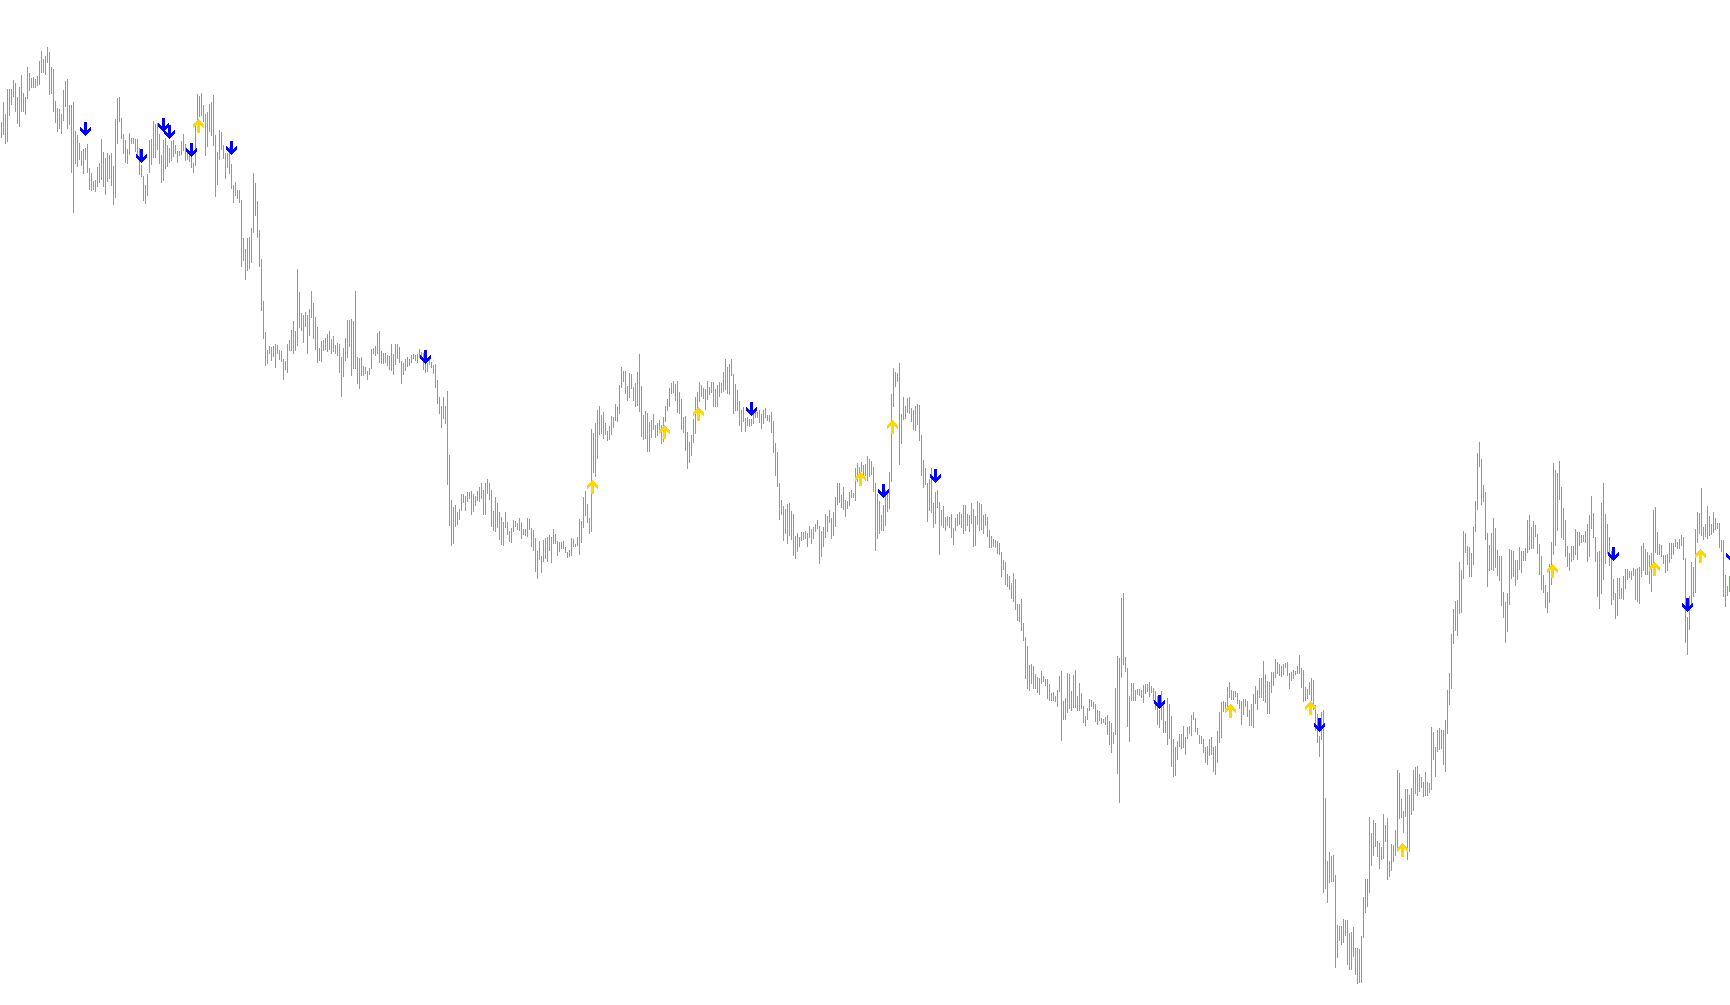
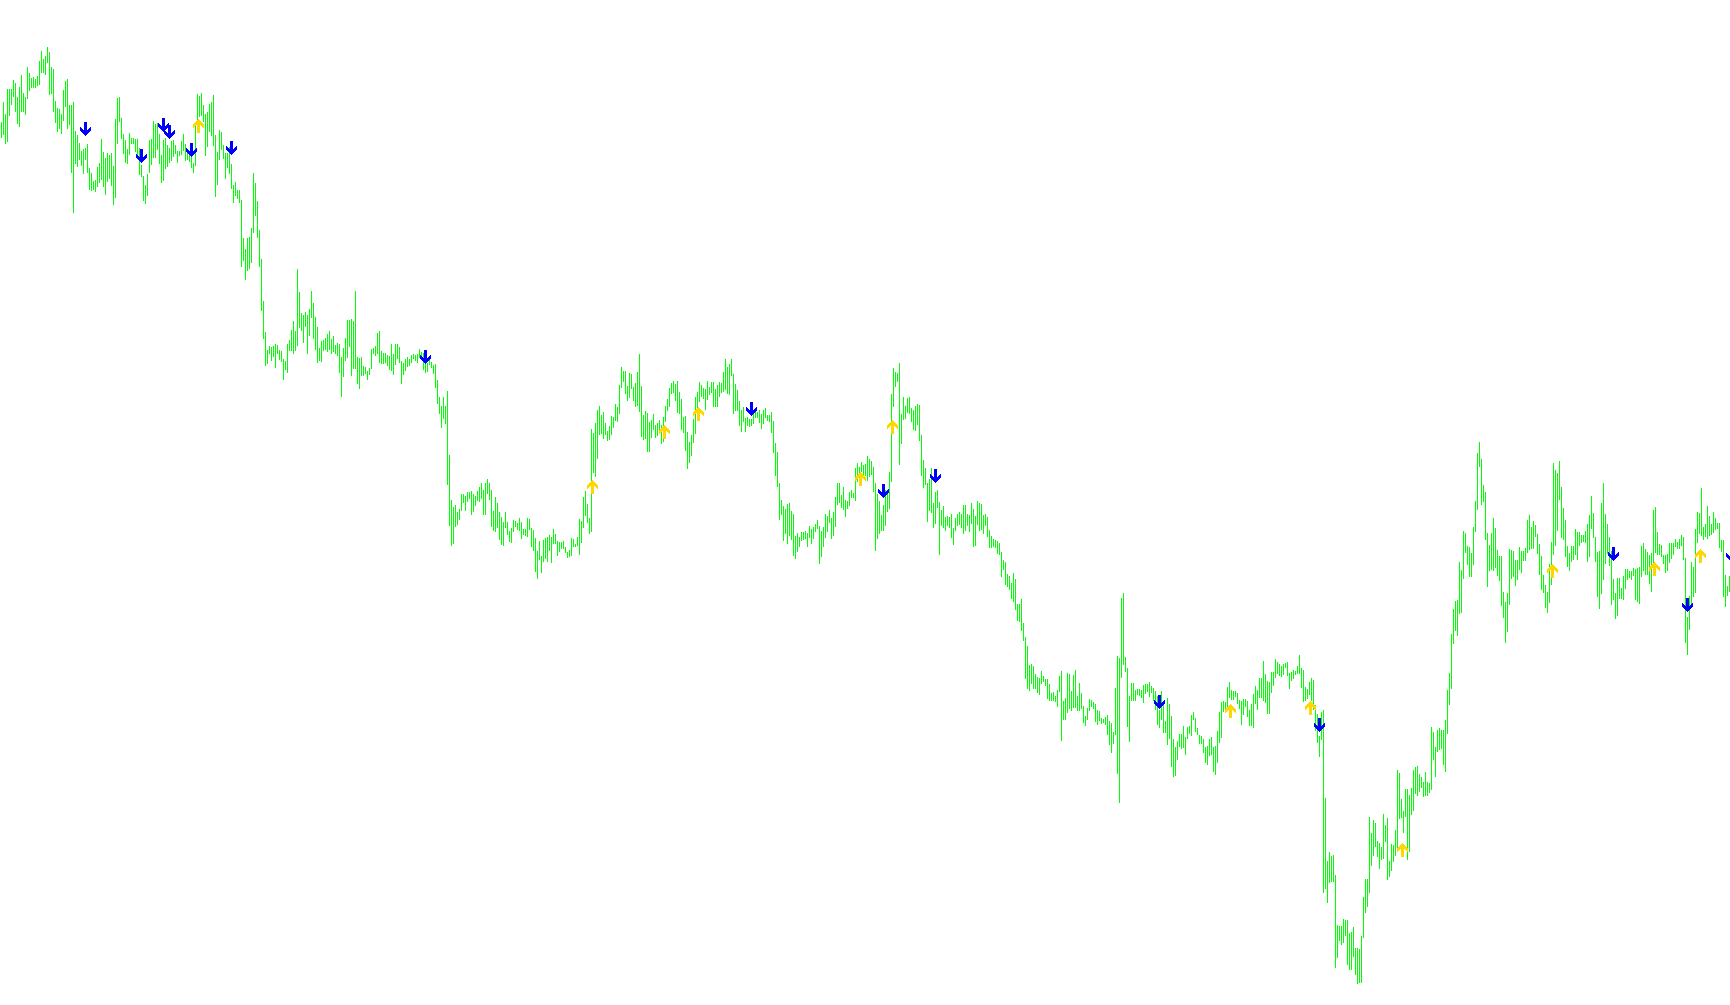
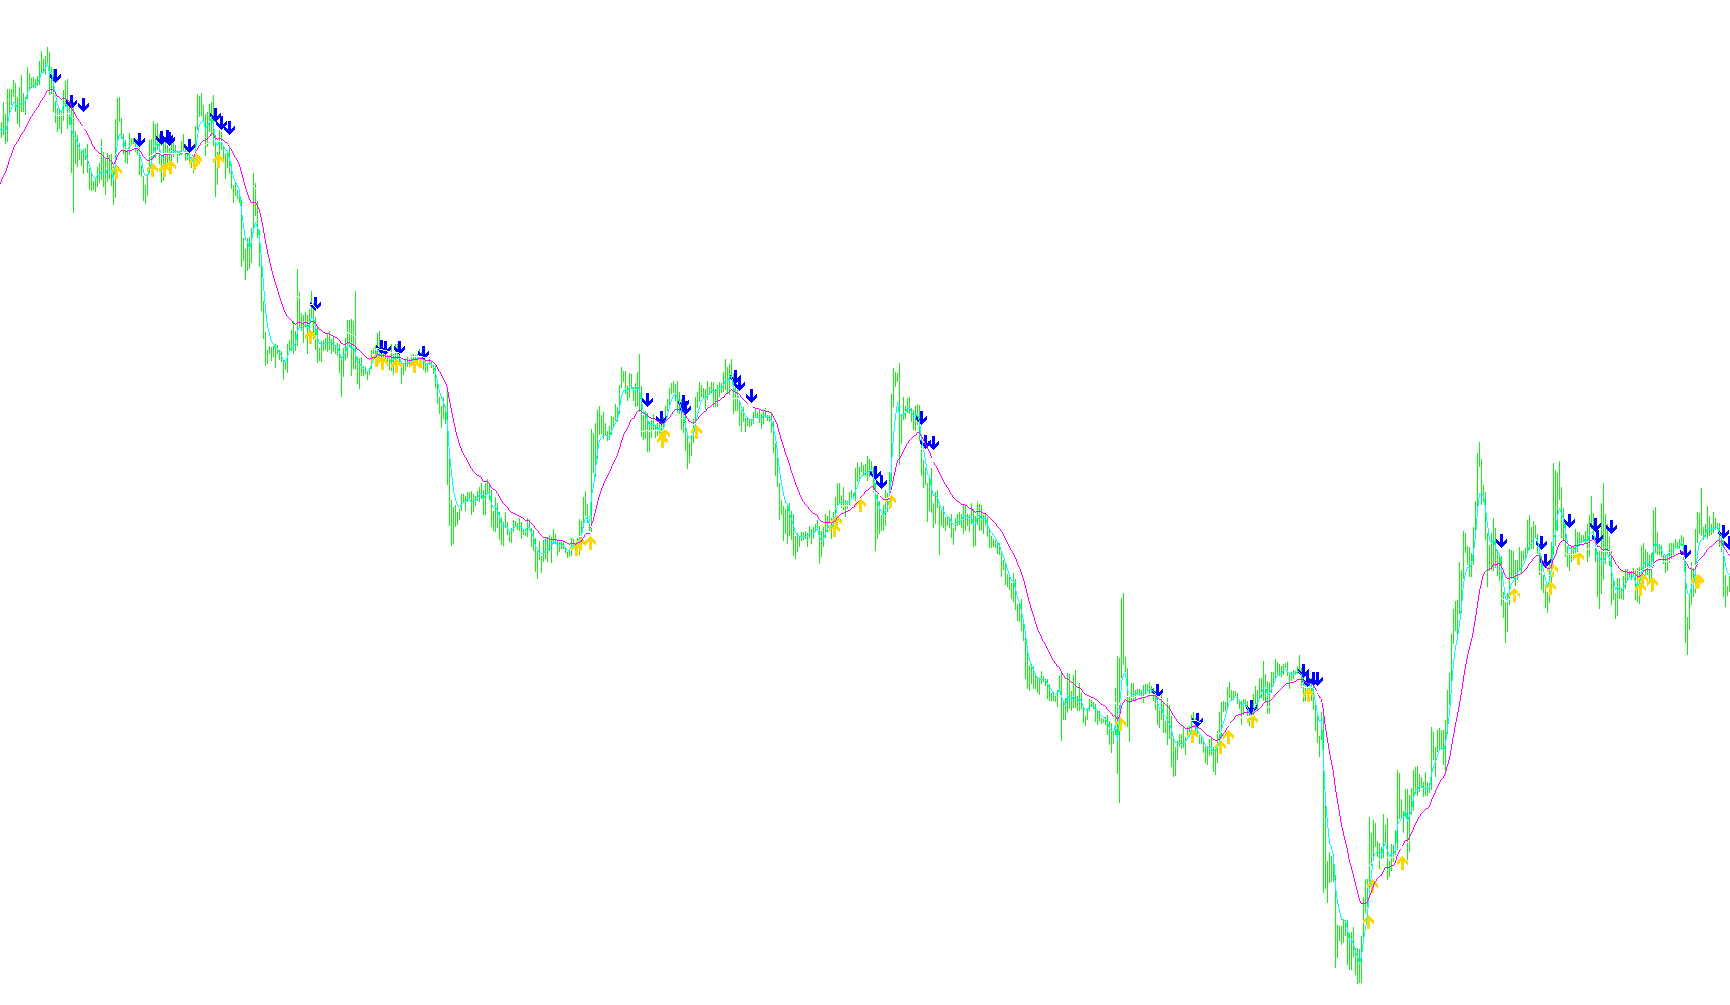
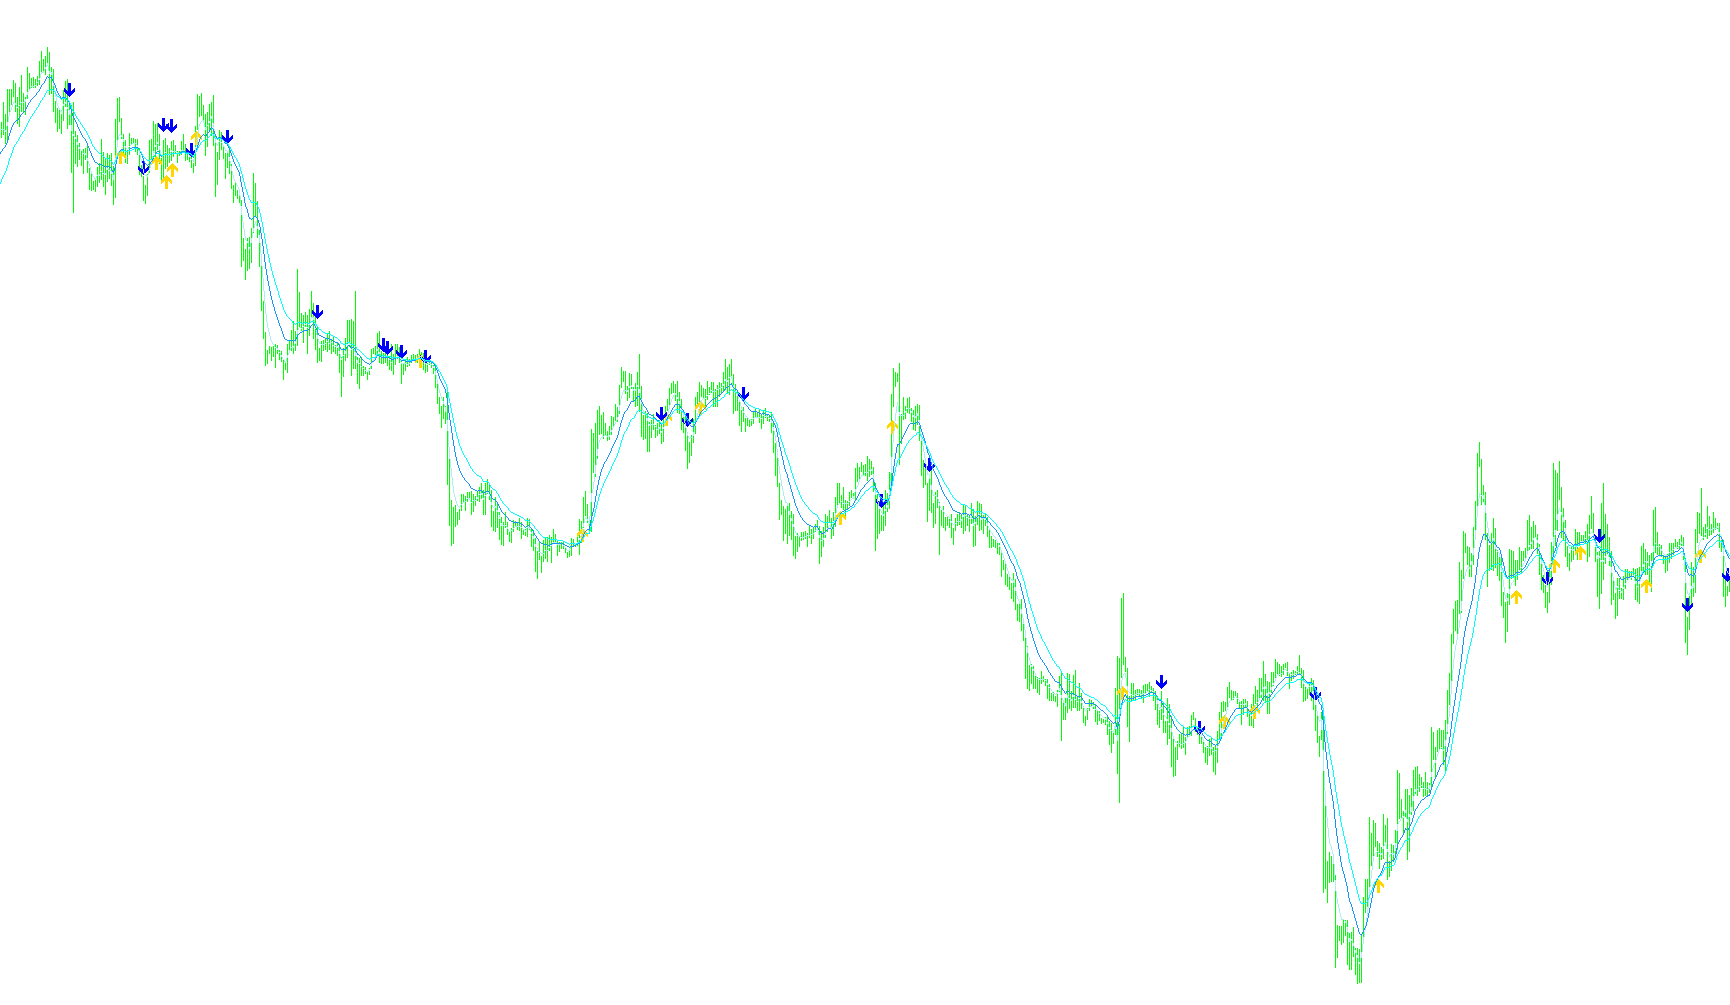
2MA CrossoverWithPrice_002
Indicator

2MA CrossoverWithPrice_002

iMA

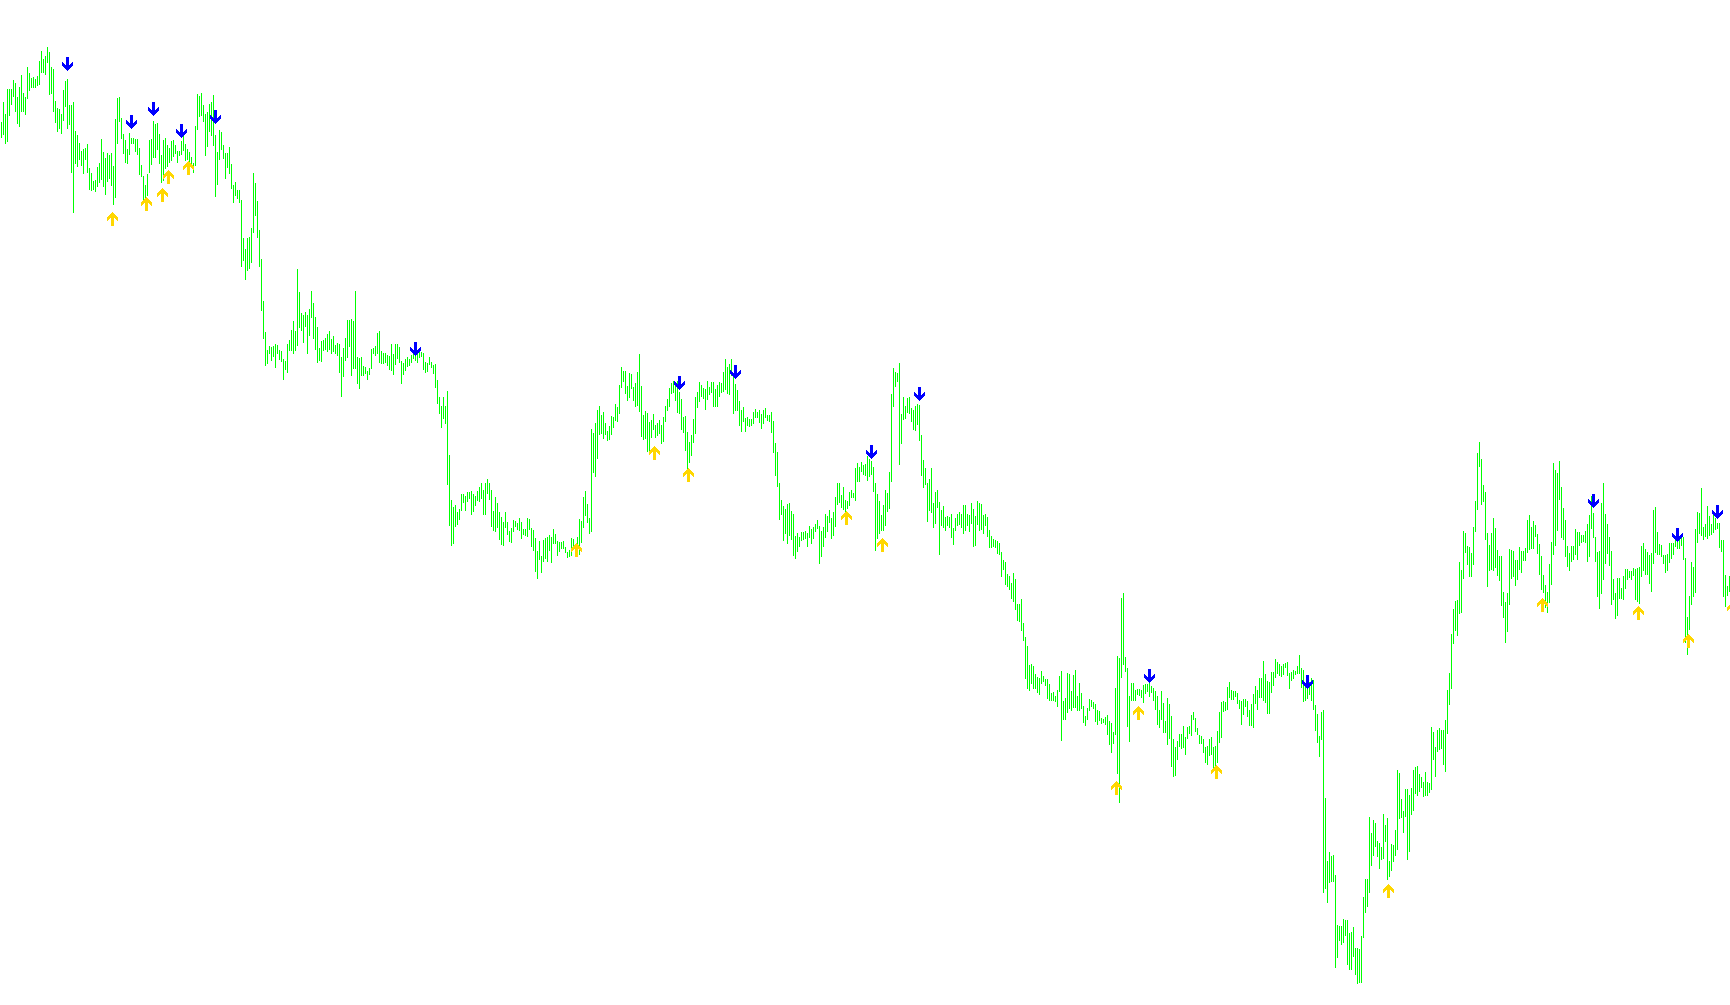
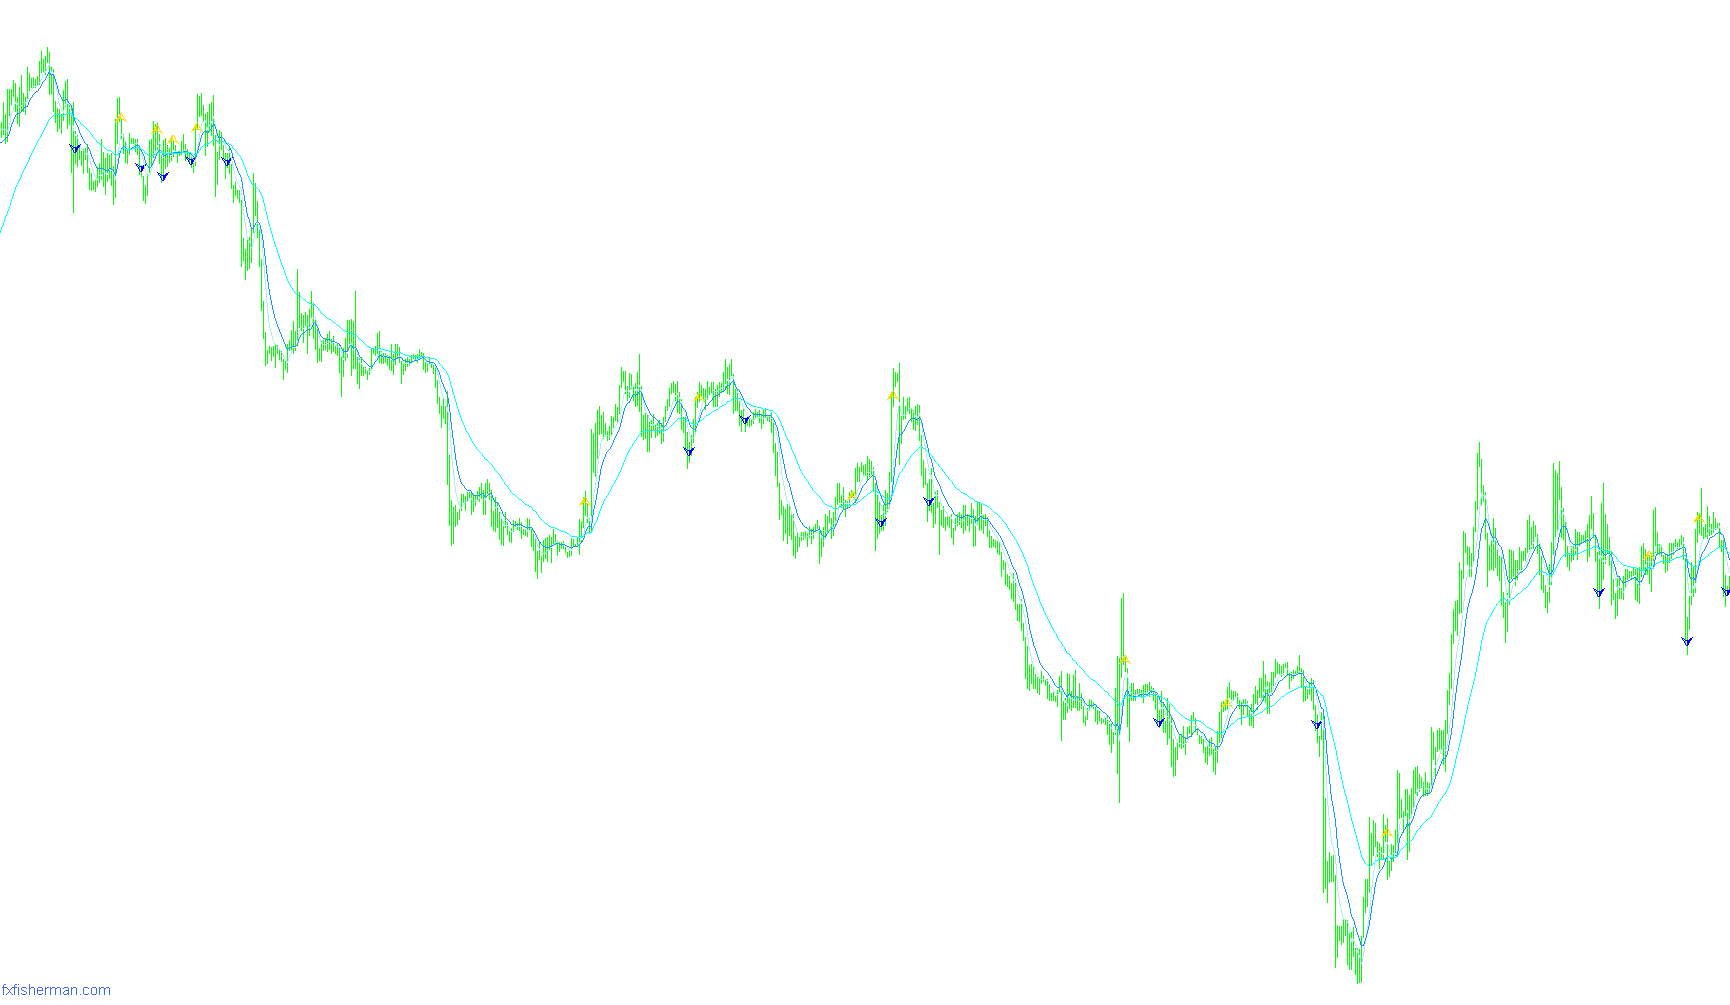
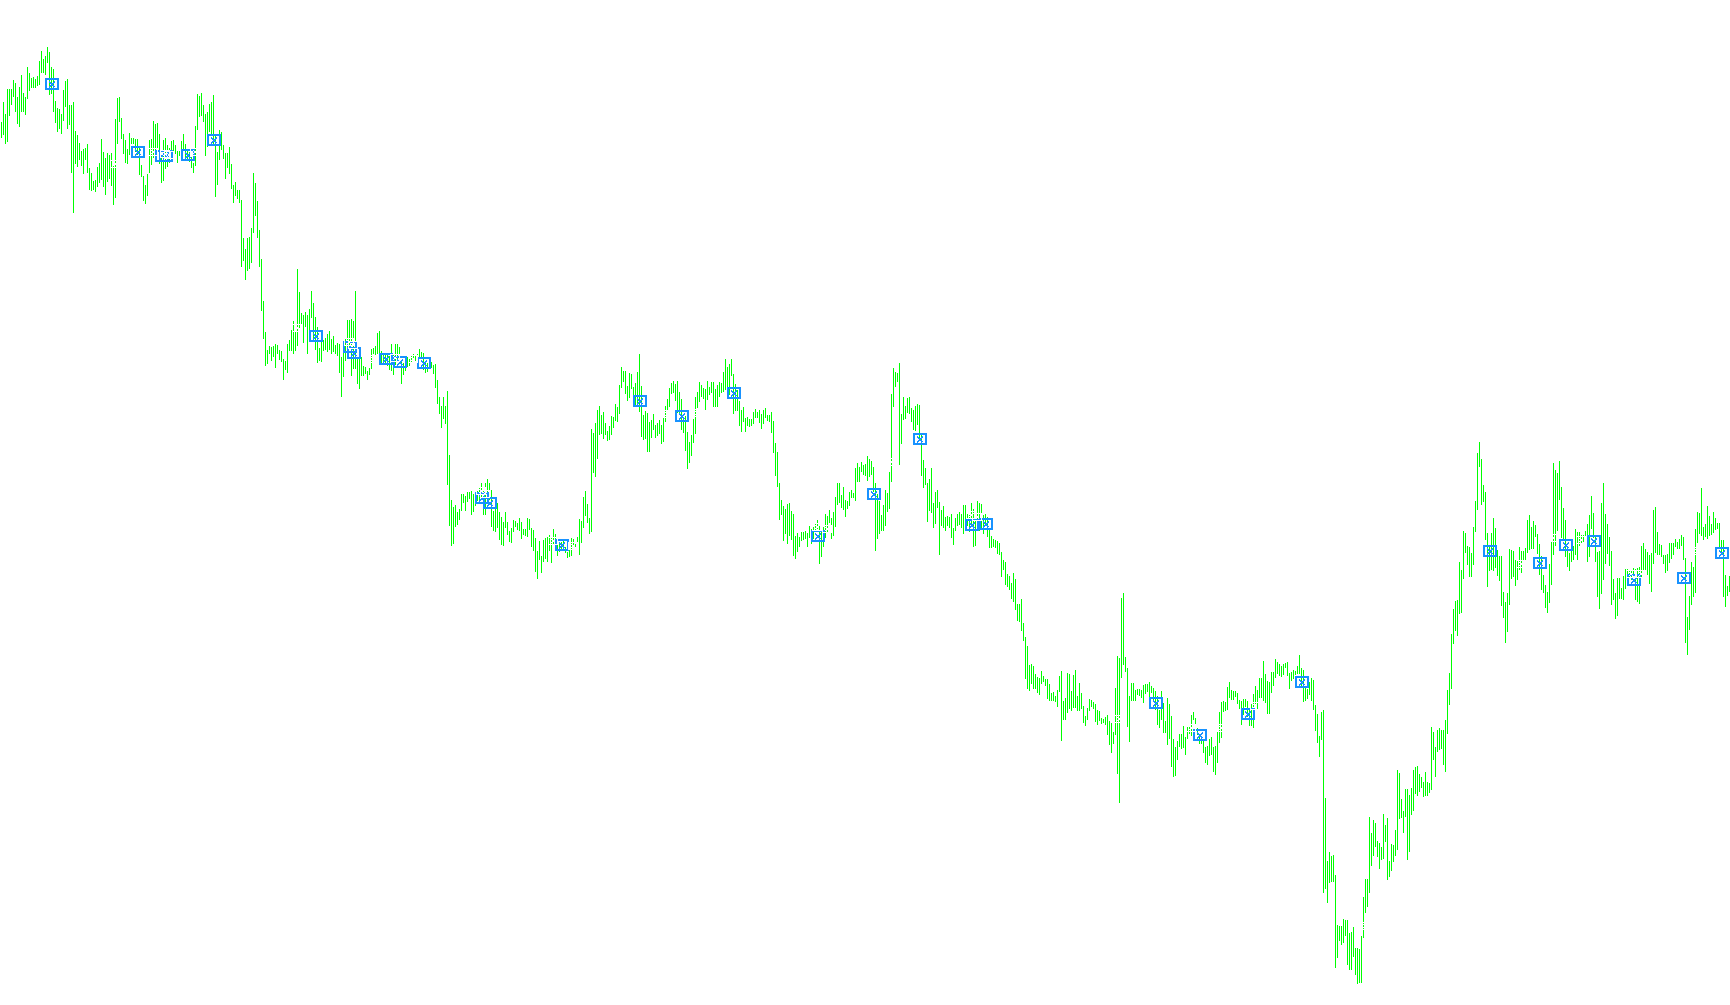
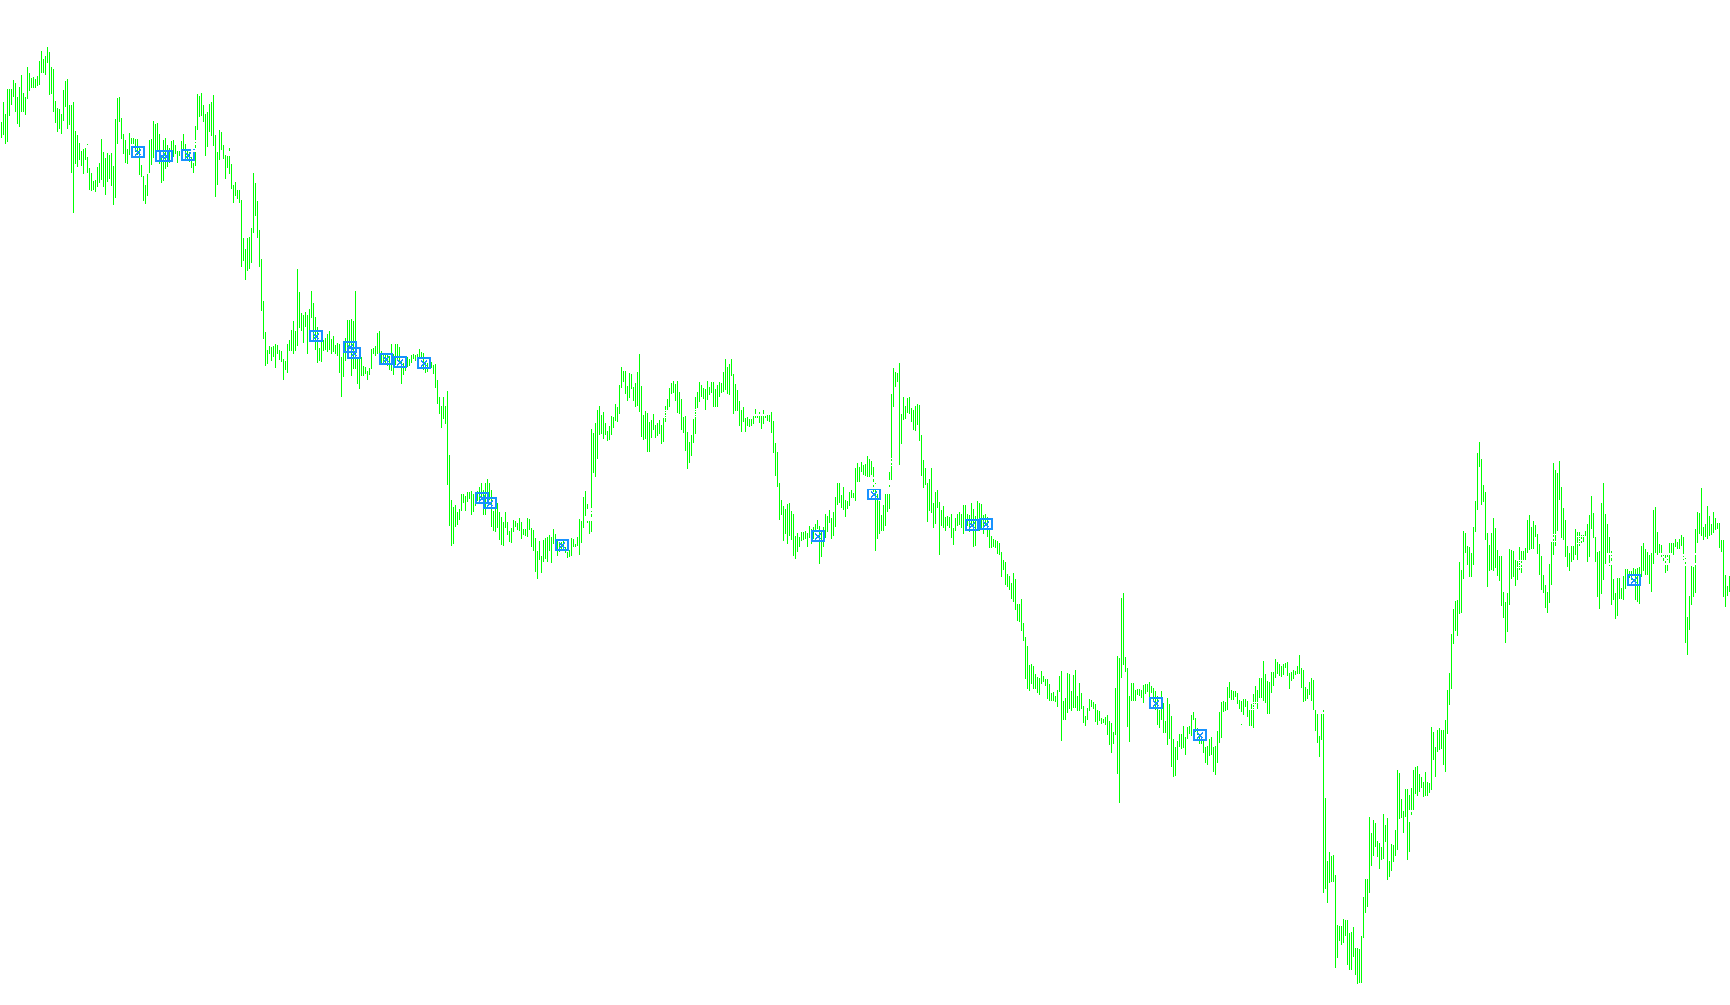
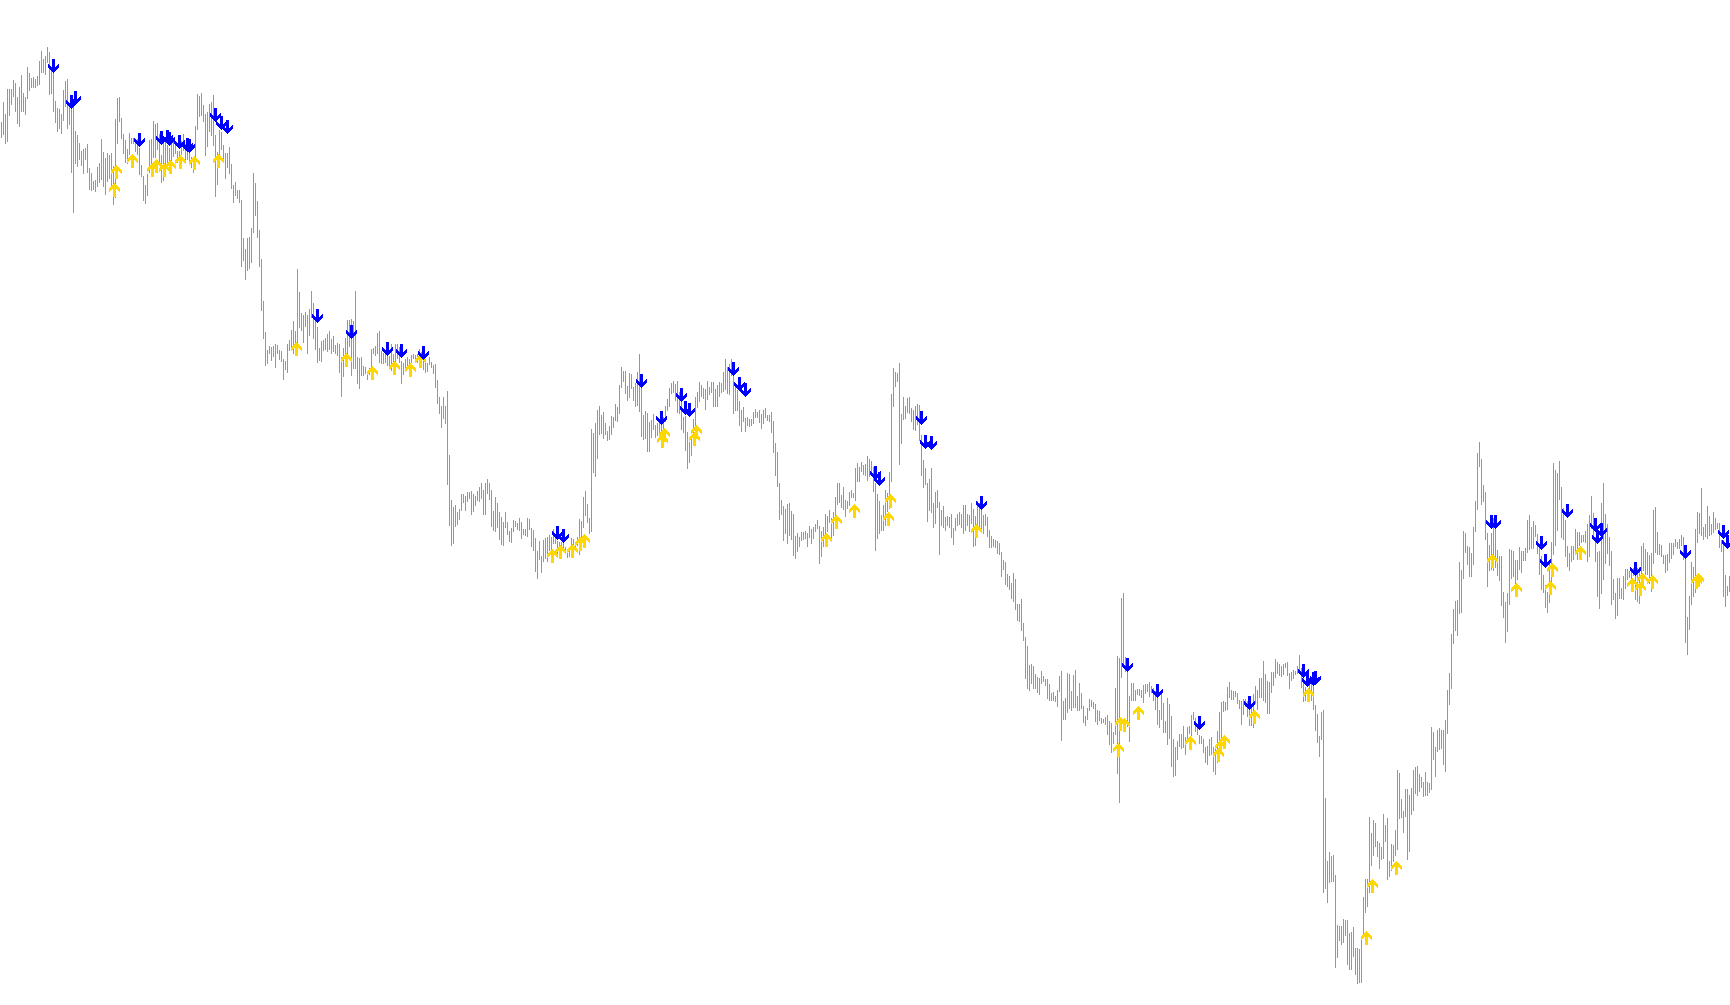
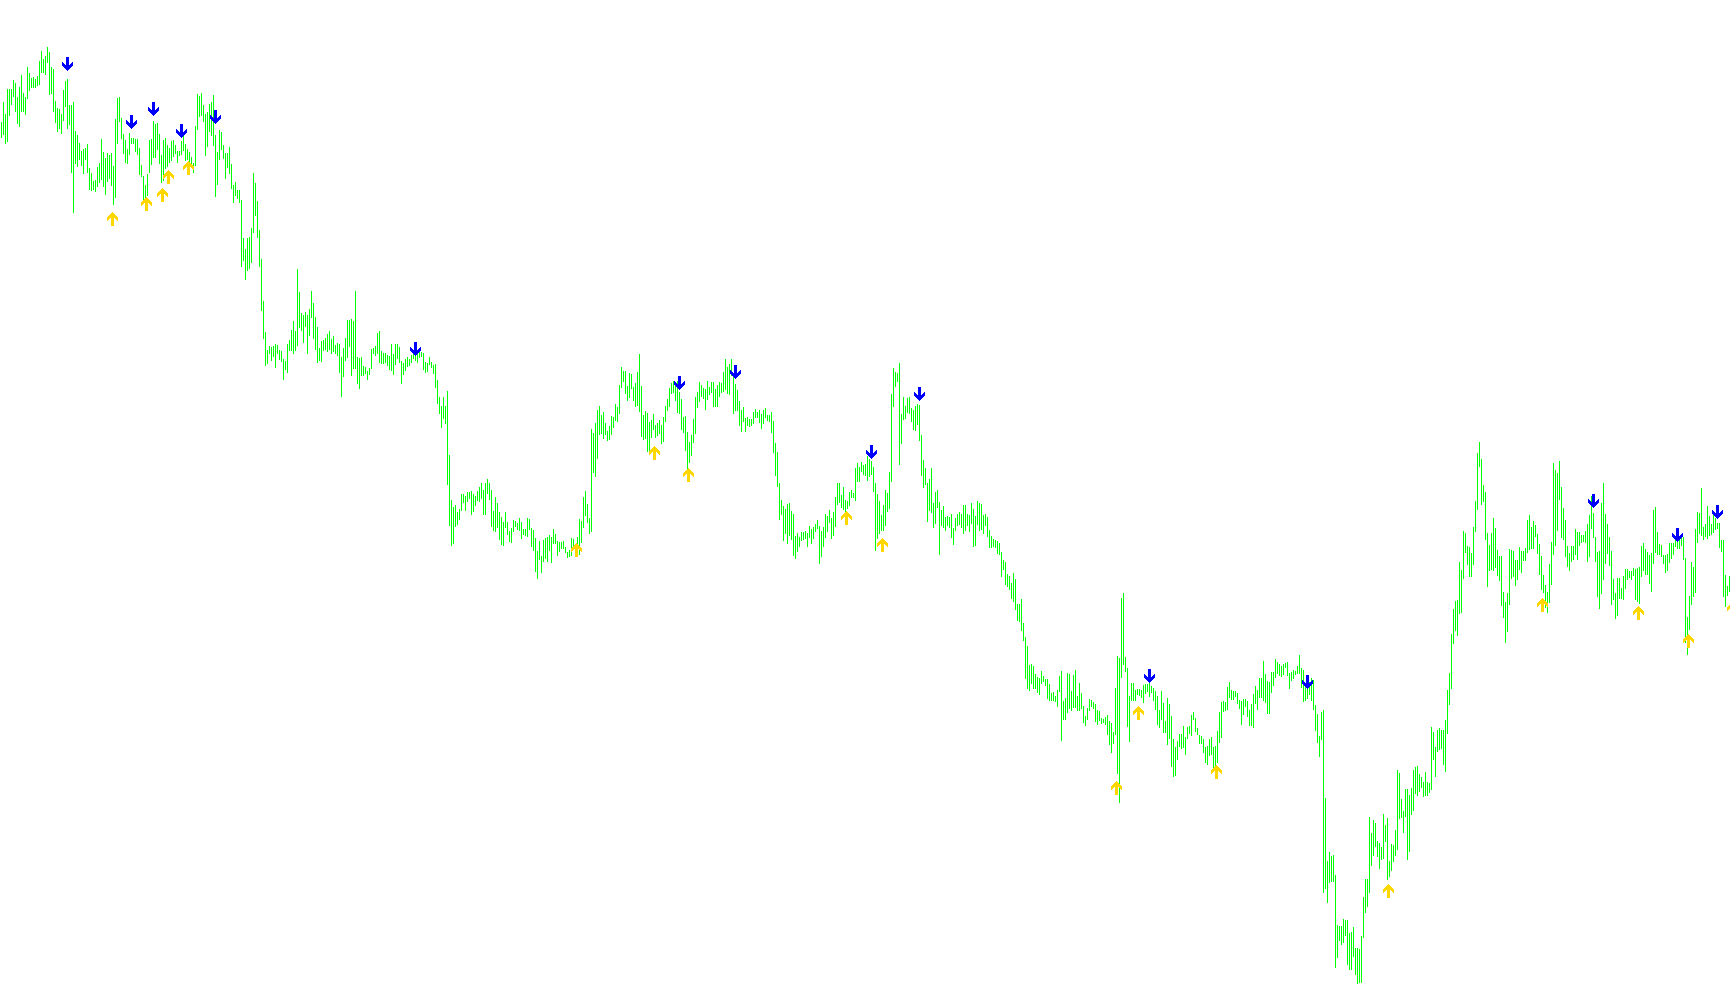
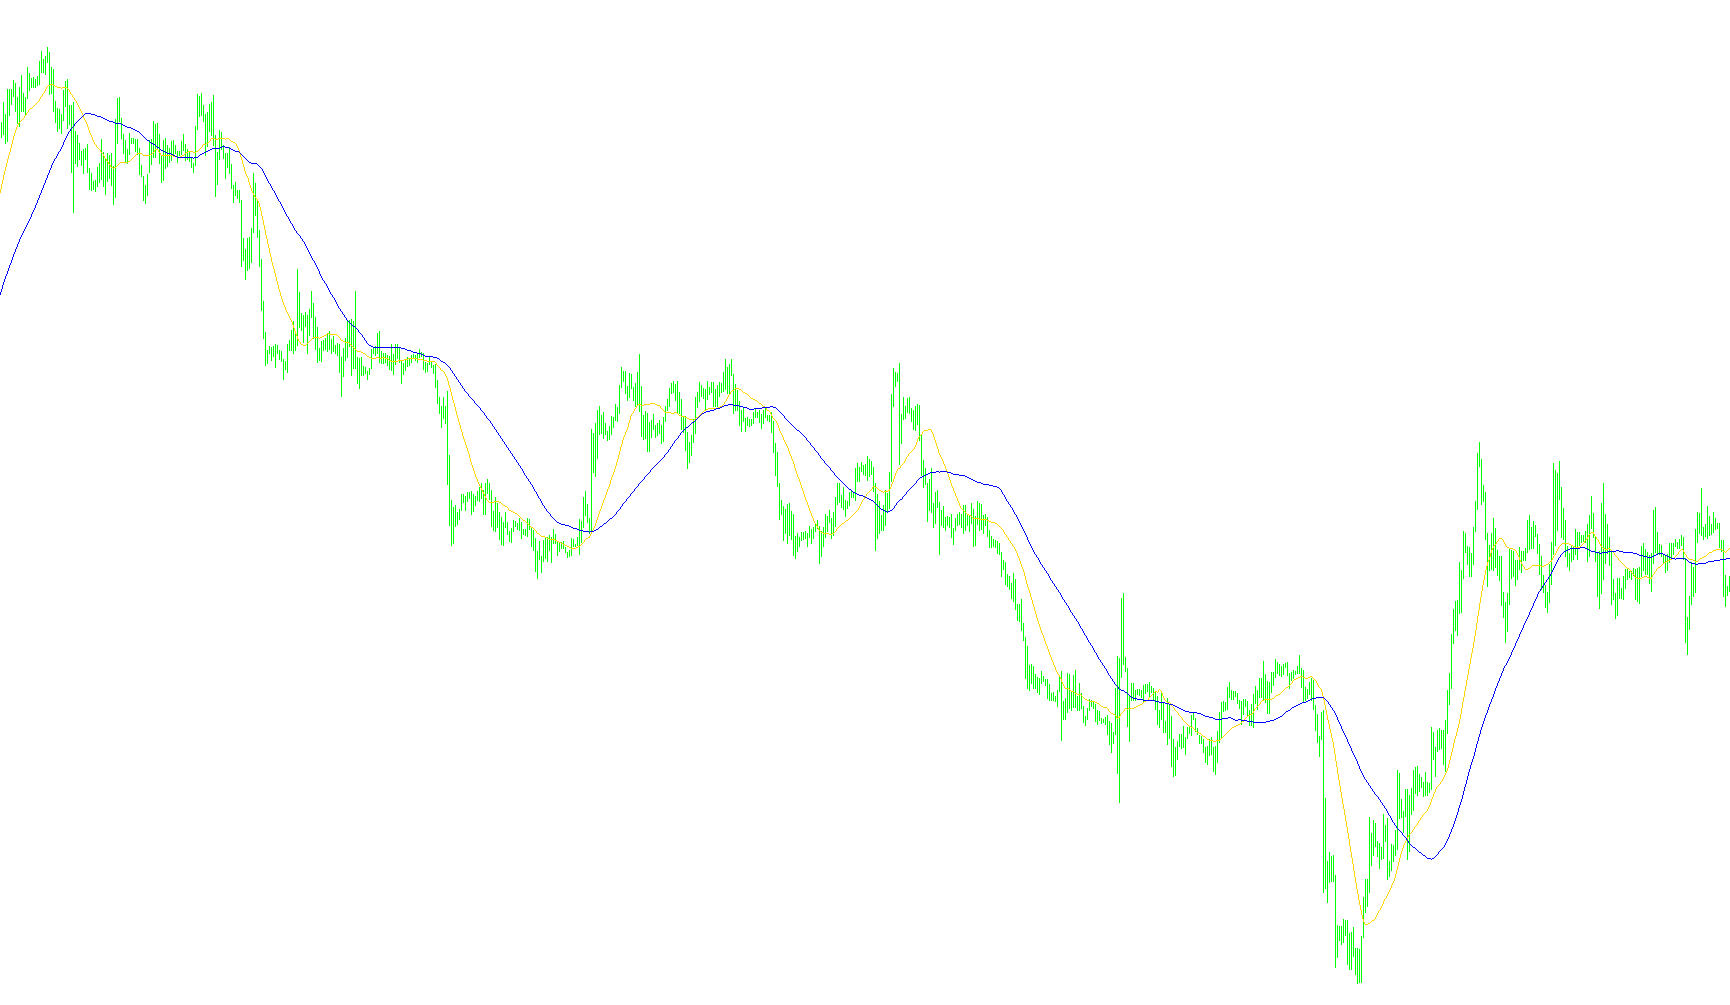
This indicator detects and visually marks precise crossovers between two customizable moving averages while triggering real-time push notifications.
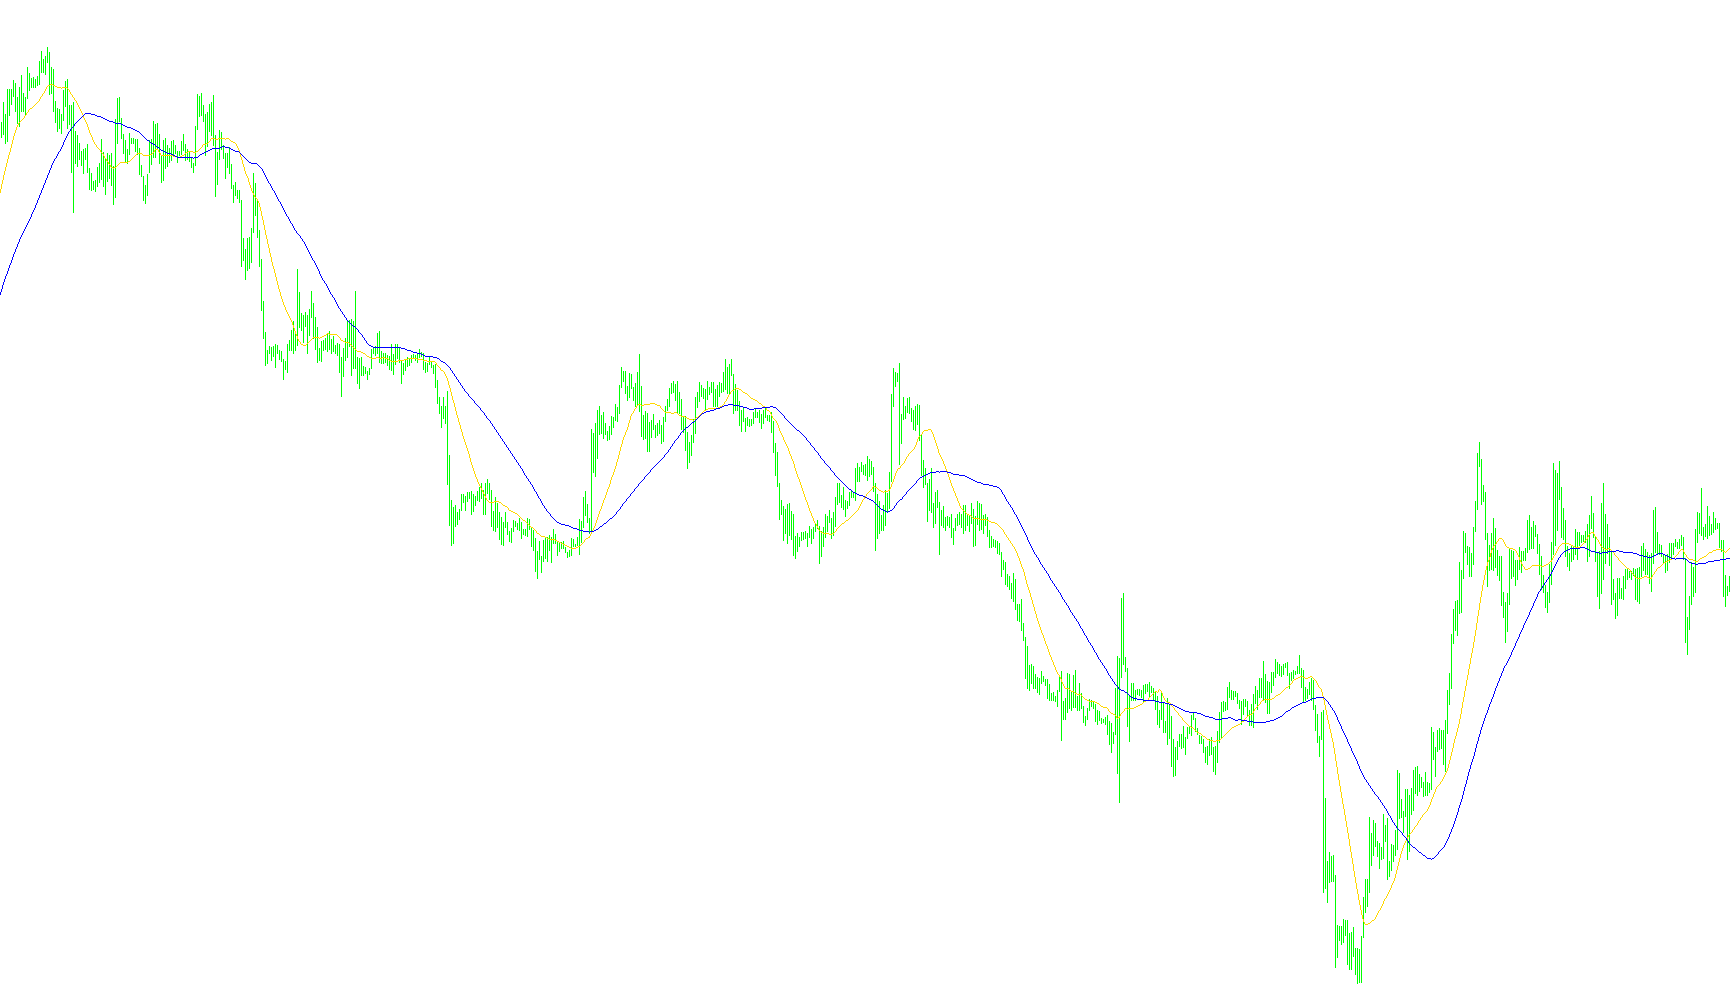
2MA Crossover_003
Indicator

2MA Crossover_003

iMA

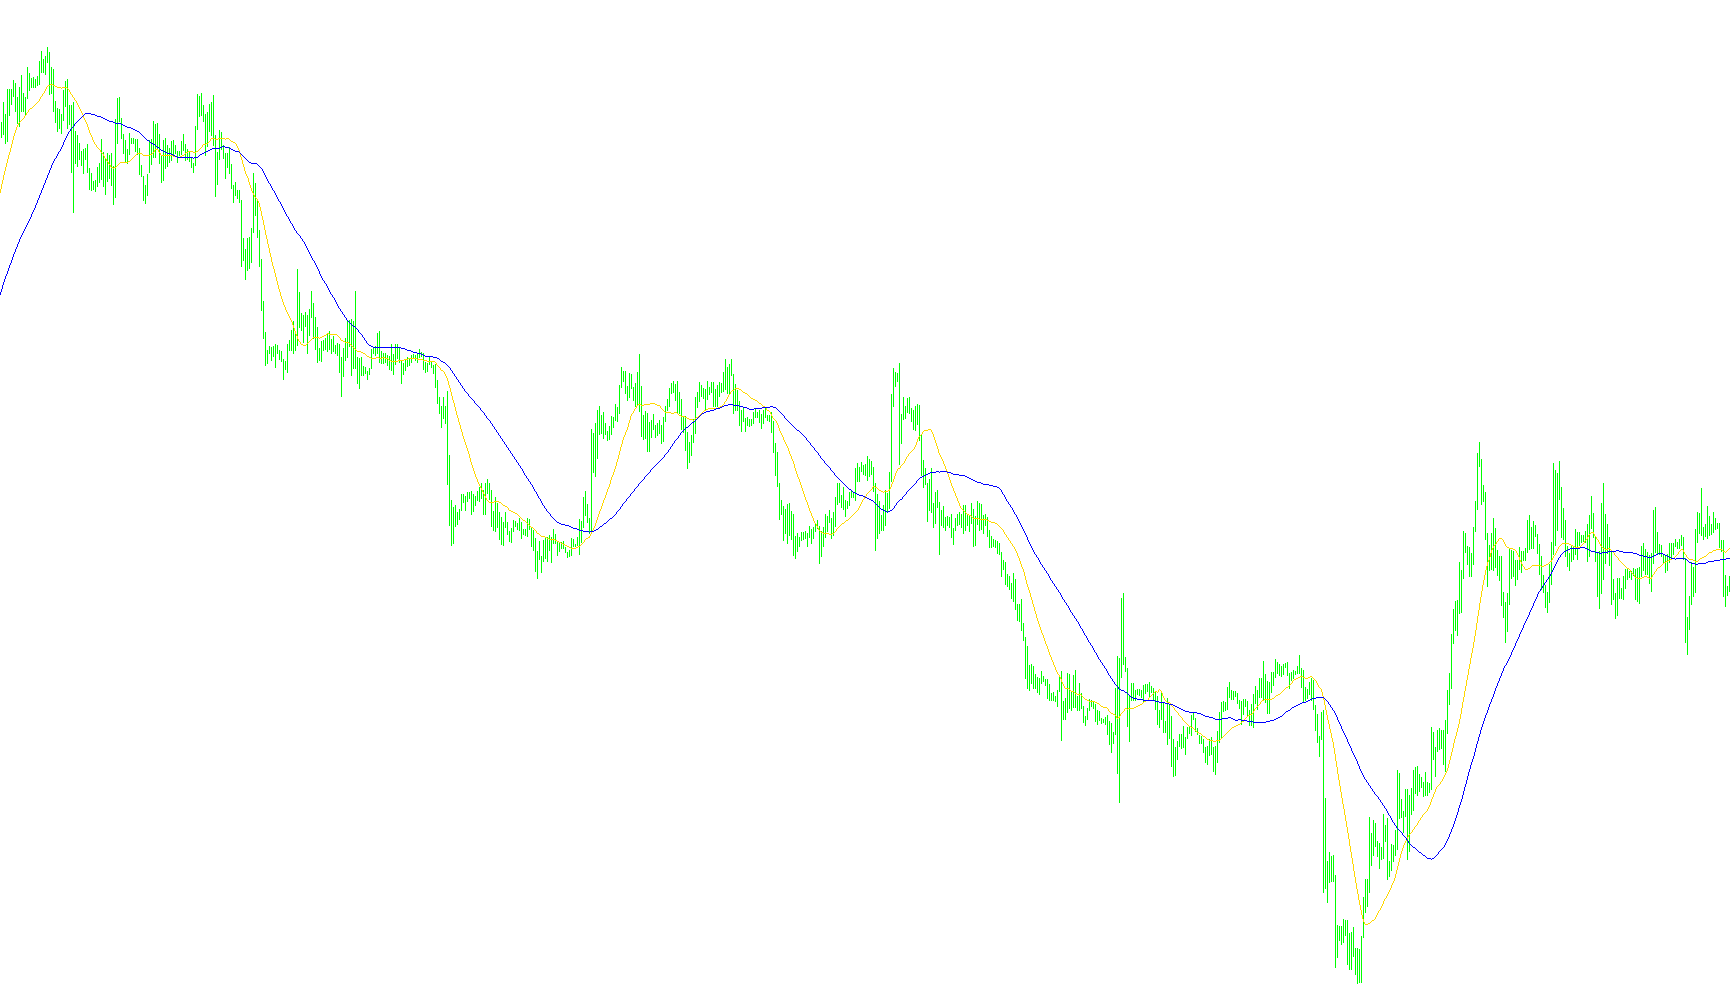
This indicator identifies momentum shifts by detecting precise intersection points between two customizable moving average types and triggers visual signals with real-time alerts.

2MA Crossover_004
Indicator

2MA Crossover_004

iMA

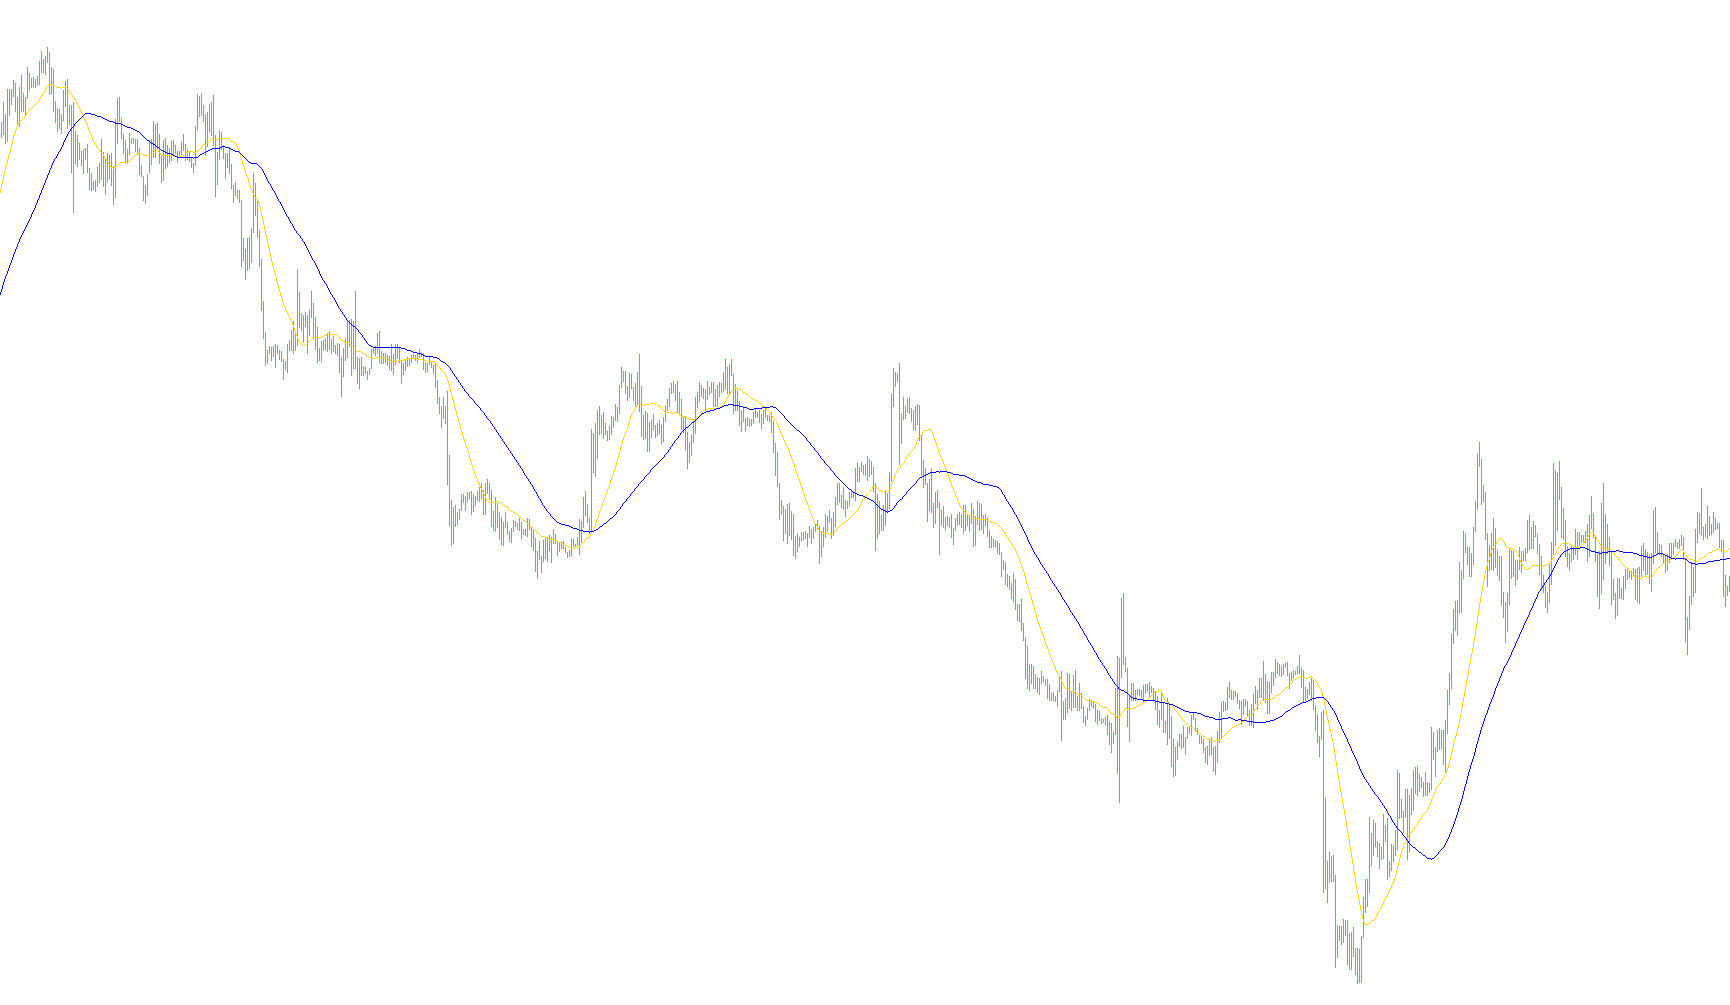
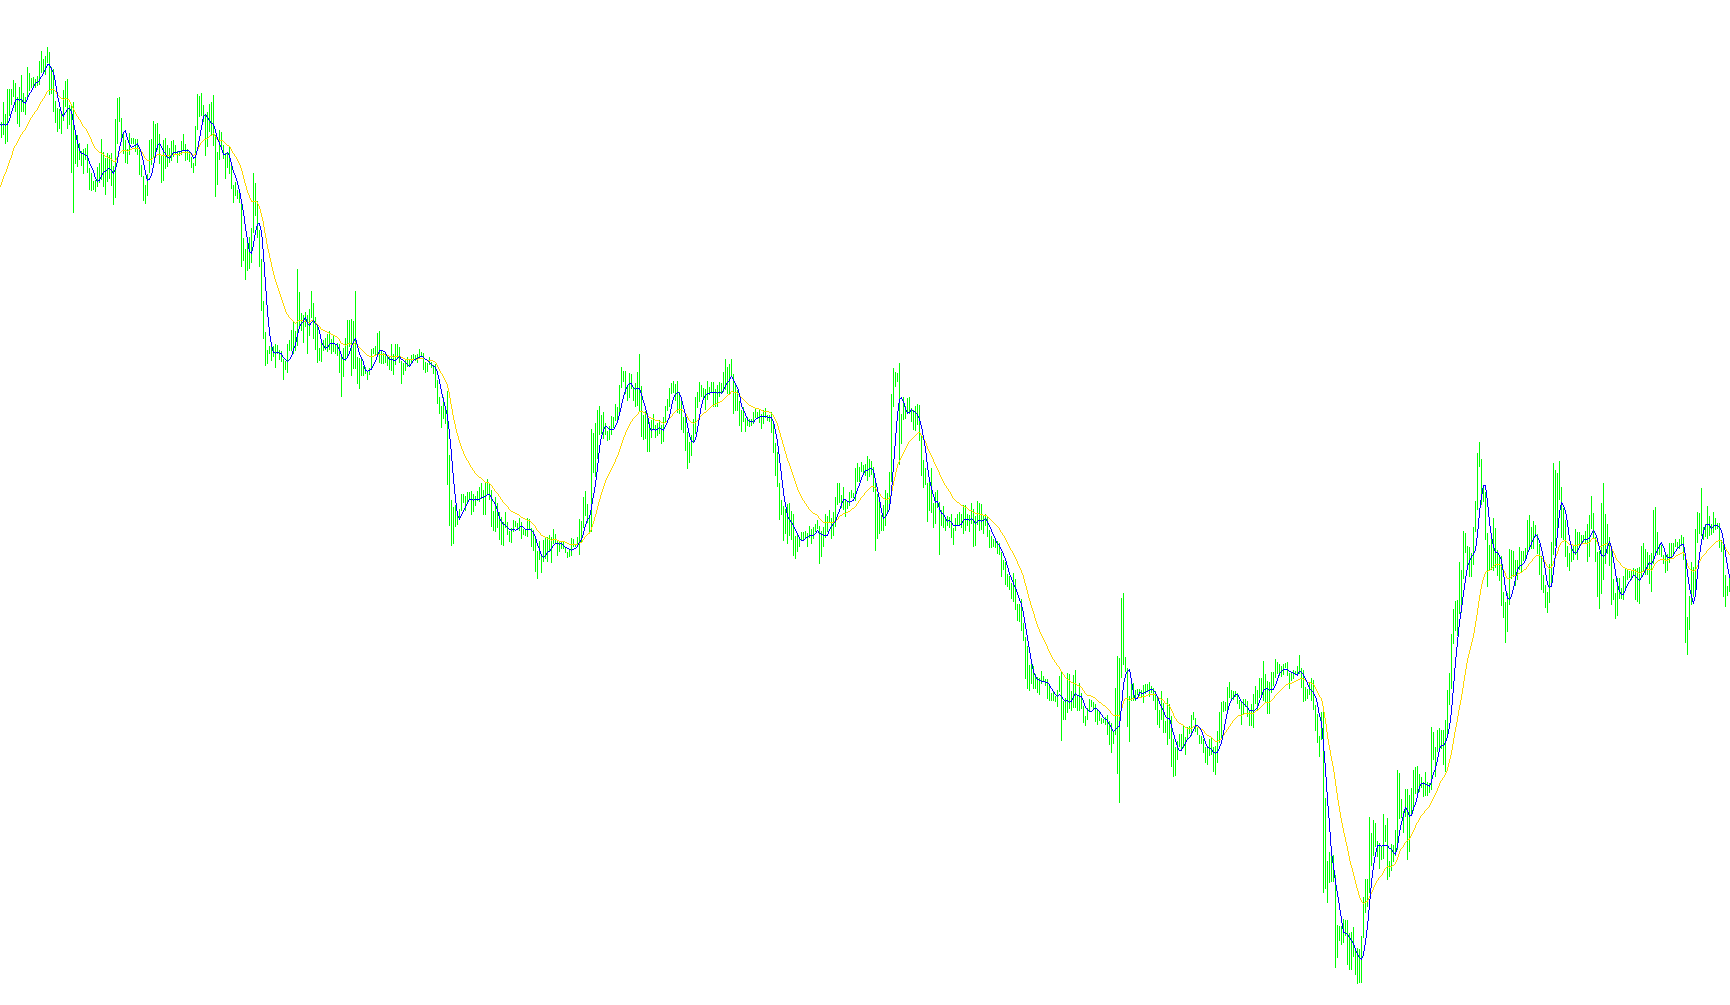
This indicator identifies bullish and bearish reversals by detecting the specific moment two user-defined moving averages intersect, providing visual arrows and real-time notifications.

Indicator

2MA_Lib_Sample

iMA
Indicator

2MA_Lib_Sample2

iMA
2x5 MA CROSS WITH SOUND
Indicator

2x5 MA CROSS WITH SOUND

iMA

This indicator identifies precise trend reversals by detecting geometric intersections between two customizable moving averages of varying calculation modes.

2_2_MA
Indicator

2_2_MA

iMA

This indicator quantifies the real-time spread between short-term and long-term moving averages across two distinct currency pairs, normalized by their respective point values.

3 ma cross alert
Indicator

3 ma cross alert

iMA

This indicator identifies trend reversals by detecting when both the faster and medium moving averages simultaneously breach a slower baseline moving average.

3 ma cross email_alert
Indicator

3 ma cross email_alert

iMA

This indicator identifies bullish or bearish momentum shifts by detecting when both the fast and medium moving averages simultaneously cross above or below a slower trend baseline.

3 MA Cross w_Alert v2
Indicator

3 MA Cross w_Alert v2

iMA

This indicator detects bullish and bearish signals by identifying instances where two faster moving averages simultaneously breach a slower baseline moving average.

3 MA Cross w_Alert v2_001
Indicator

3 MA Cross w_Alert v2_001

iMA

This indicator identifies trend reversals by signaling when both fast and medium moving averages concurrently breach the slowest moving average in a specific directional sequence.

3 MA Cross w_Alert v2_003
Indicator

3 MA Cross w_Alert v2_003

iMA

This indicator identifies bullish or bearish momentum by signaling when both the faster and medium moving averages align simultaneously above or below a designated slower moving average.

3 MA Cross w_Alert v2_v1
Indicator

3 MA Cross w_Alert v2_v1

iMA
3 MA Cross w_Alert
Indicator

3 MA Cross w_Alert

iMA

This indicator identifies bullish and bearish trend shifts by detecting when two fast moving averages simultaneously breach a slower primary moving average in the same direction.

3 MA Cross w_Alert_v1
Indicator

3 MA Cross w_Alert_v1

iMA

This indicator identifies trend reversals by detecting simultaneous bullish or bearish breakthroughs where both the faster and medium moving averages align above or below a slower base average.

Indicator

3 MAs Cross Arrows

iMA
3 MAs Cross Arrows_001
Indicator

3 MAs Cross Arrows_001

iMA

The indicator identifies bullish and bearish trend shifts by detecting when two short-term moving averages simultaneously breach a longer-term baseline moving average.

3colorMACD
Indicator

3colorMACD

iMAiMAOnArray

This indicator visualizes the acceleration of MACD momentum by segregating price velocity into distinct color-coded histogram bars based on whether the direction is strengthening, weakening, or consolidating.

3colorMACD_001
Indicator

3colorMACD_001

iMAiMAOnArray

This indicator categorizes MACD momentum into three distinct visual components to differentiate between bullish acceleration, bearish decay, and neutral equilibrium.

3colorMACD_002
Indicator

3colorMACD_002

iMAiMAOnArray

This indicator differentiates momentum velocity by categorizing MACD histogram fluctuations into distinct visual segments based on positive, negative, or stagnant directional shifts.

3colorMACD_v1
Indicator

3colorMACD_v1

iMAiMAOnArray

This indicator segments MACD volatility into three distinct visual channels to differentiate between accelerating, decelerating, and stagnant momentum shifts.

3color_MACD
Indicator

3color_MACD

iMAiMAOnArray

This indicator differentiates price momentum trends by dynamically color-coding MACD histograms based on the direction of the rate of change between consecutive bars.

3MA01IND
Indicator

3MA01IND

iMA

This indicator identifies potential trend reversals by detecting precise price crossovers between fast and slow Linear Weighted Moving Averages.

3MA01IND_v1
Indicator

3MA01IND_v1

iMA

This indicator identifies potential trend reversals by detecting precise crossover points between a 5-period and a 20-period Linear Weighted Moving Average.

3MA02EXP
Indicator

3MA02EXP

iMA

This algorithm detects momentum shifts by identifying crossovers between a short-term and long-term Linear Weighted Moving Average to trigger automated position reversals.

3MA02EXP1
Indicator

3MA02EXP1

iMA

This expert advisor executes trade reversals by detecting crossovers between a fast 5-period and a slow 25-period Linear Weighted Moving Average.

3MA02IND
Indicator

3MA02IND

iMA

The logic identifies momentum shifts by detecting intersections between a short-term 5-period and a long-term 25-period Linear Weighted Moving Average.

3MA02IND_v1
Indicator

3MA02IND_v1

iMA

Identifies high-probability trend reversals by detecting the intersection of short-term and long-term Linear Weighted Moving Averages.

3MA03IND
Indicator

3MA03IND

iMA

This indicator identifies bullish and bearish momentum shifts by detecting crossovers between short-term and medium-term Linear Weighted Moving Averages relative to a long-term trend baseline.

3MA03IND_v1
Indicator

3MA03IND_v1

iMA

This indicator identifies potential momentum shifts and reversal zones by detecting crossovers between short-term and medium-term Linear Weighted Moving Averages relative to a long-term baseline.

3MACross_AlertWarnSigOnlyNoShift
Indicator

3MACross_AlertWarnSigOnlyNoShift

iMA

This indicator detects and signals bullish or bearish trend shifts by identifying momentum crossovers between three distinct moving average layers.

3MACross_AlertWarnSigOnlyNoShift_v2
Indicator

3MACross_AlertWarnSigOnlyNoShift_v2

iMA

This indicator identifies bullish and bearish momentum shifts by detecting intersection points between three distinct moving average layers and plots visual signals based on relative price volatility.

3ma_alertidge
Indicator

3ma_alertidge

iMA

This indicator identifies bullish and bearish momentum by detecting instances where both the faster and medium moving averages simultaneously align above or below a primary slow moving average.

3MA_Cross_AlertWarnSigL_NegShift
Indicator

3MA_Cross_AlertWarnSigL_NegShift

iMA

Identifies trend shifts by detecting multi-tier intersections between three distinct moving average periods and projects visual signals based on volatility-adjusted price ranges.

3MA_Cross_w_Alert_v2GS
Indicator

3MA_Cross_w_Alert_v2GS

iMA

This indicator identifies bullish or bearish trend shifts by detecting simultaneous price-action breaches where both faster moving averages align above or below a slower baseline.

3MA_Cross_w_Alert_v2GS1
Indicator

3MA_Cross_w_Alert_v2GS1

iMA

Identifies bullish or bearish trend reversals by detecting simultaneous price action where both faster moving averages align above or below a slower primary baseline.

3MA_Cross_w_Alert_v2GS2
Indicator

3MA_Cross_w_Alert_v2GS2

iMA

This indicator identifies trend reversals by detecting instances where both the fast and medium moving averages align above or below a slow moving average while simultaneously validating momentum through price action shifts.

3rdgenma
Indicator

3rdgenma

iMAiMAOnArray

This algorithm synthesizes a multi-layered moving average to minimize phase shift while preserving essential price curvature through iterative lambda-based smoothing.

4 ma strength
Indicator

4 ma strength

iMA

This indicator quantifies trend velocity by calculating the cumulative hierarchical stacking of four distinct moving averages to measure directional dominance.

Indicator

4 Period 7 MA Fibo Relational S.R Indicator

iMA
Indicator

4 Period 7 MA Fibo Relational S.R Indicator_v1

iMA
Indicator

4 Period MA w.Regr.STD

iMA
Indicator

4 Period MA w.Regr.STD_v1

iMA
Indicator

4 Period MA

iMA
Indicator

4 Period MA_v1

iMA
4hVegasMetaTrader4hChart
Indicator

4hVegasMetaTrader4hChart

iMA

This indicator executes trend-following signals by detecting SMA crossovers filtered through weekly directional bias and multi-stage Fibonacci profit targets.

4hVegasMetaTrader4hChart_v1
Indicator

4hVegasMetaTrader4hChart_v1

iMA

This system identifies directional bias via weekly global variables and executes entries based on dual SMA crossover dynamics combined with multi-stage Fibonacci retracement profit targets.

4hVegasMetaTrader4hChart_v2
Indicator

4hVegasMetaTrader4hChart_v2

iMA

This indicator utilizes SMA crossovers and weekly bias filters to identify primed momentum entries, featuring multi-stage Fibonacci take-profit targets based on slope dynamics.

4hVegasMetaTrader4hChart_v3
Indicator

4hVegasMetaTrader4hChart_v3

iMA

This indicator identifies directional bias via weekly global variables and executes position entries based on multi-layered SMA crossovers with sequential Fibonacci-based price expansion exits.

4hVegasMetaTraderWeeklyChart(2)
Indicator

4hVegasMetaTraderWeeklyChart(2)

iMA

Identifies trend dynamics by projecting high-frequency SMA5 movements against the smoothed 21-period EMA baseline.