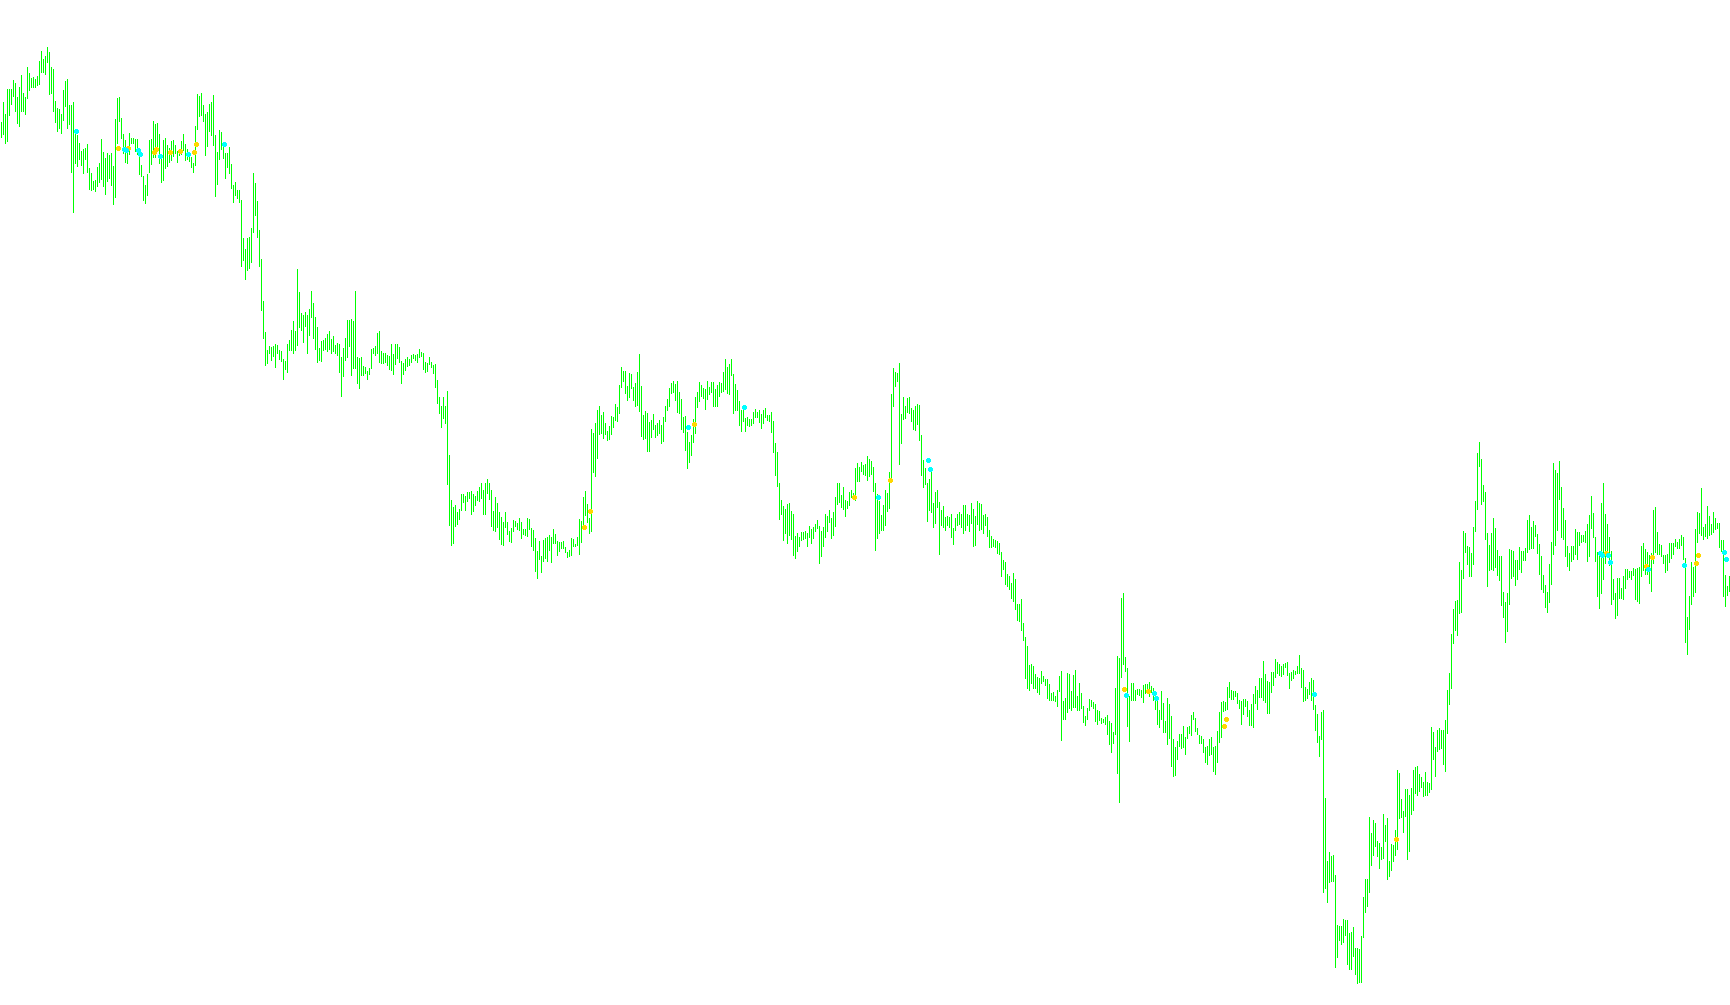
4hVegasMetaTraderWeeklyChart
Indicator

4hVegasMetaTraderWeeklyChart

iMA

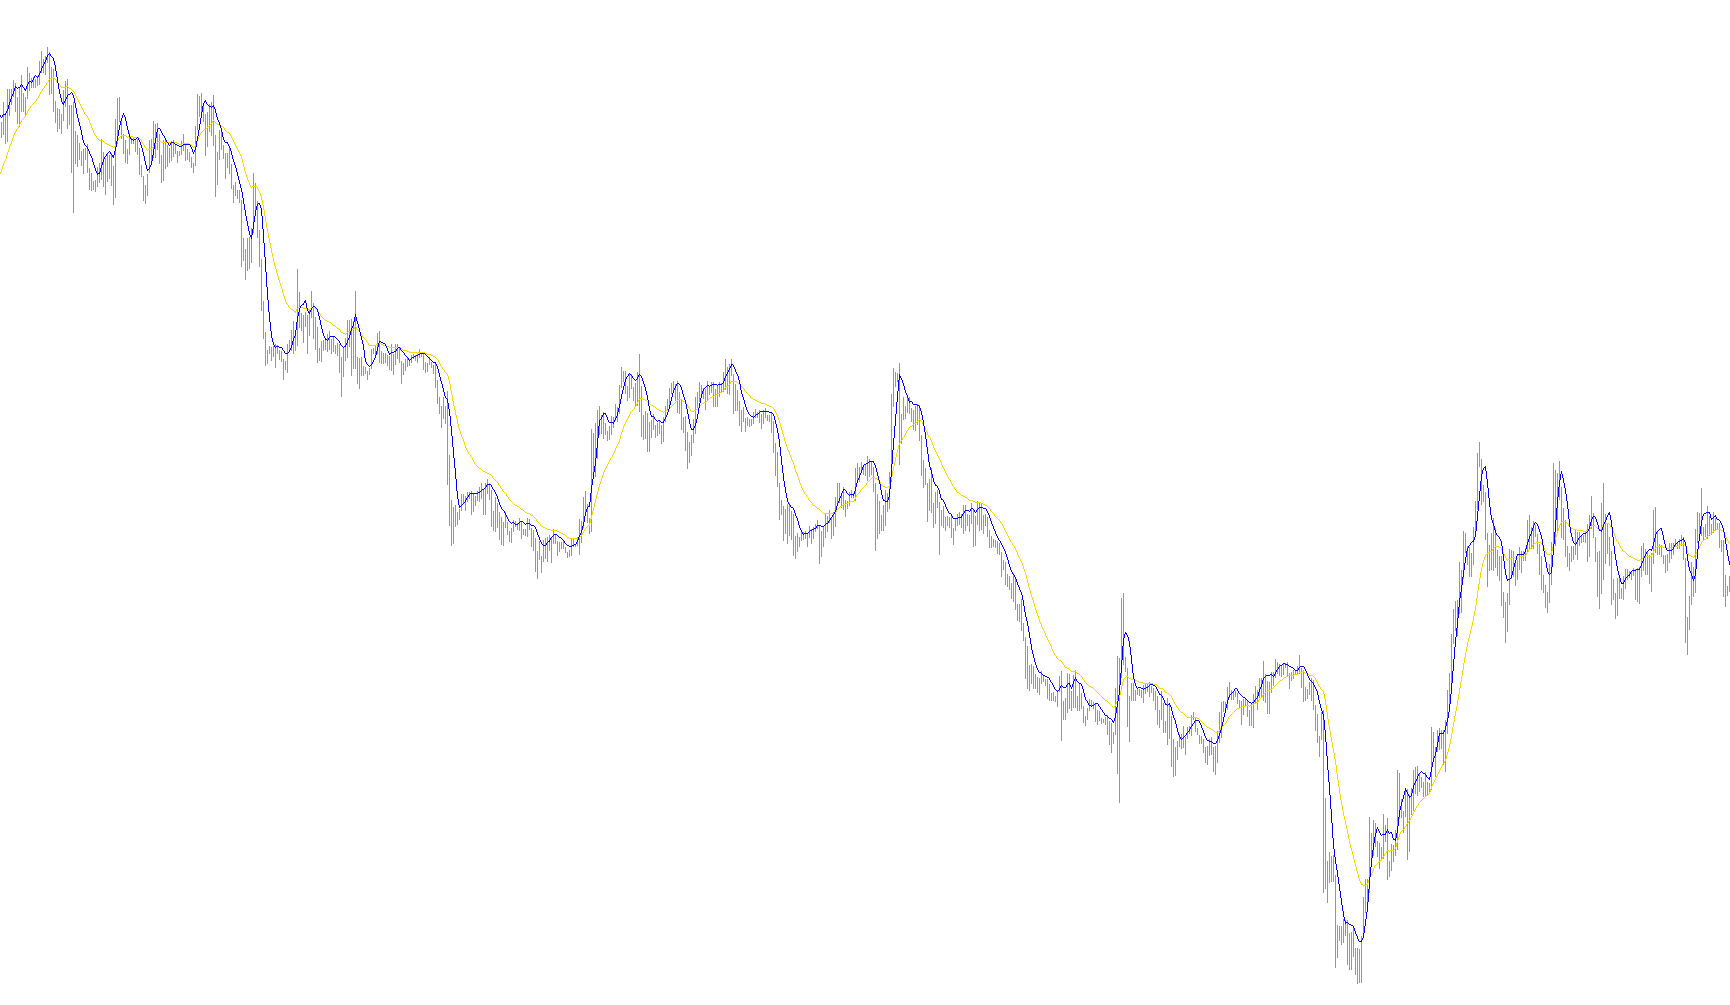
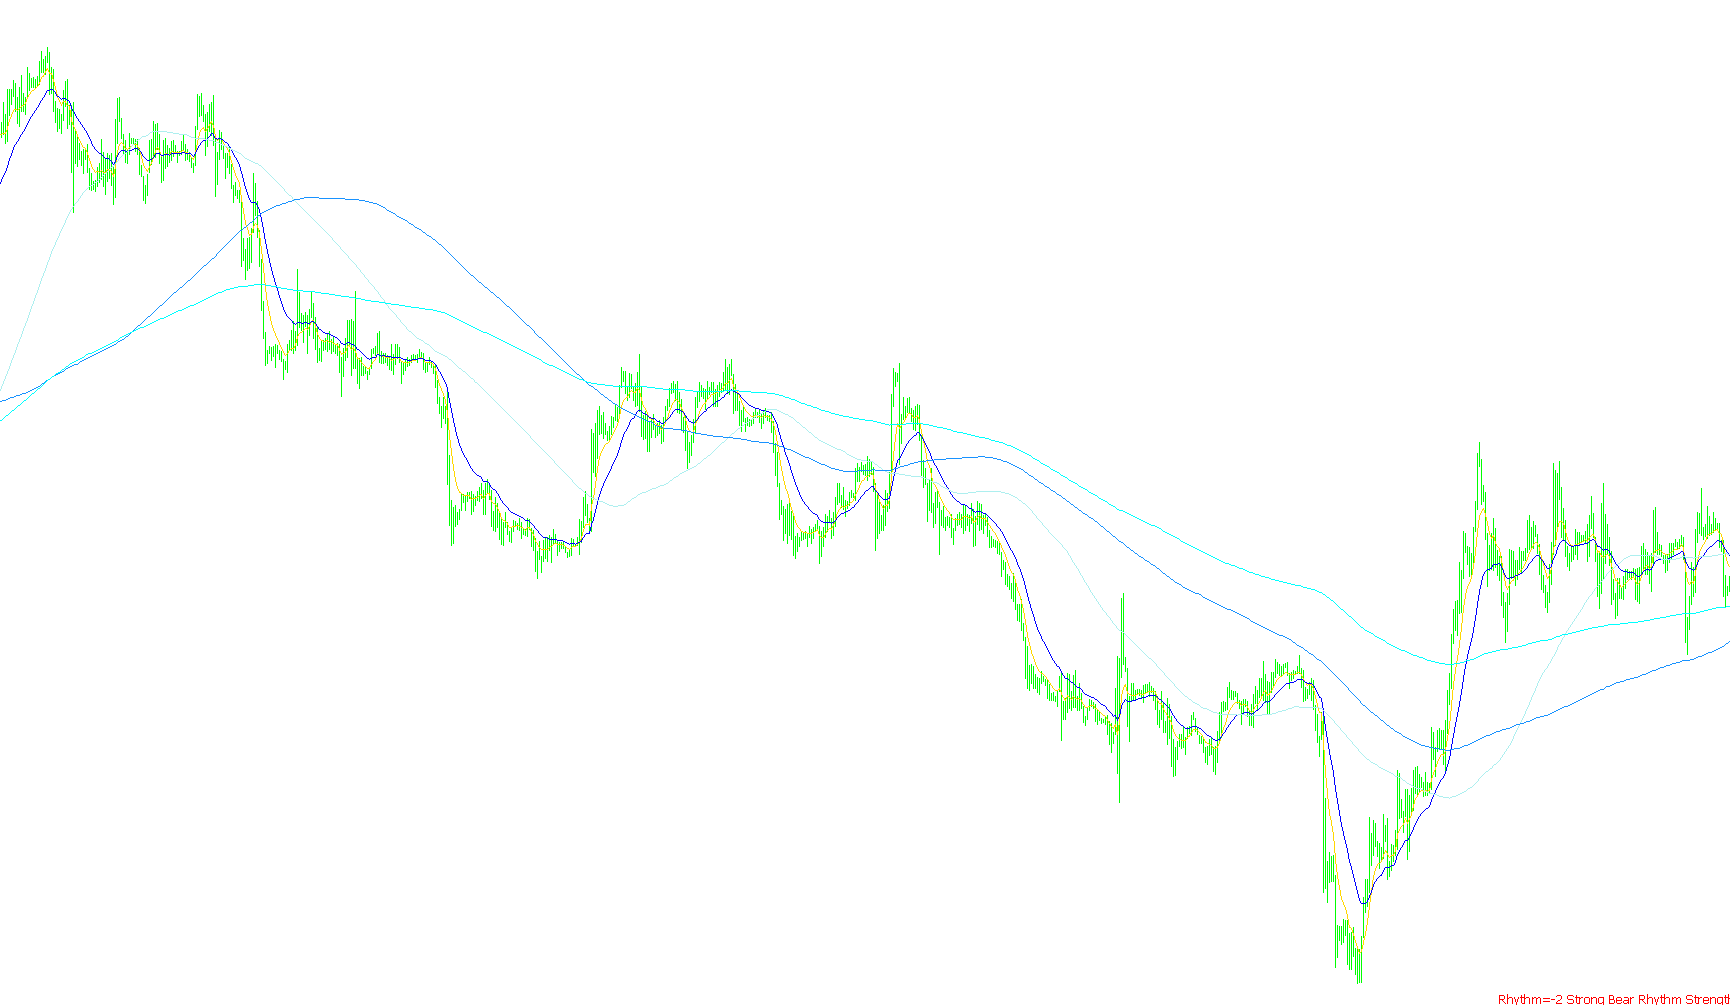
This indicator plots a high-period exponential moving average alongside a low-period simple moving average based on the midpoint of price action to identify trend momentum.

4hVegasMetaTraderWeeklyChart_v1
Indicator

4hVegasMetaTraderWeeklyChart_v1

iMA

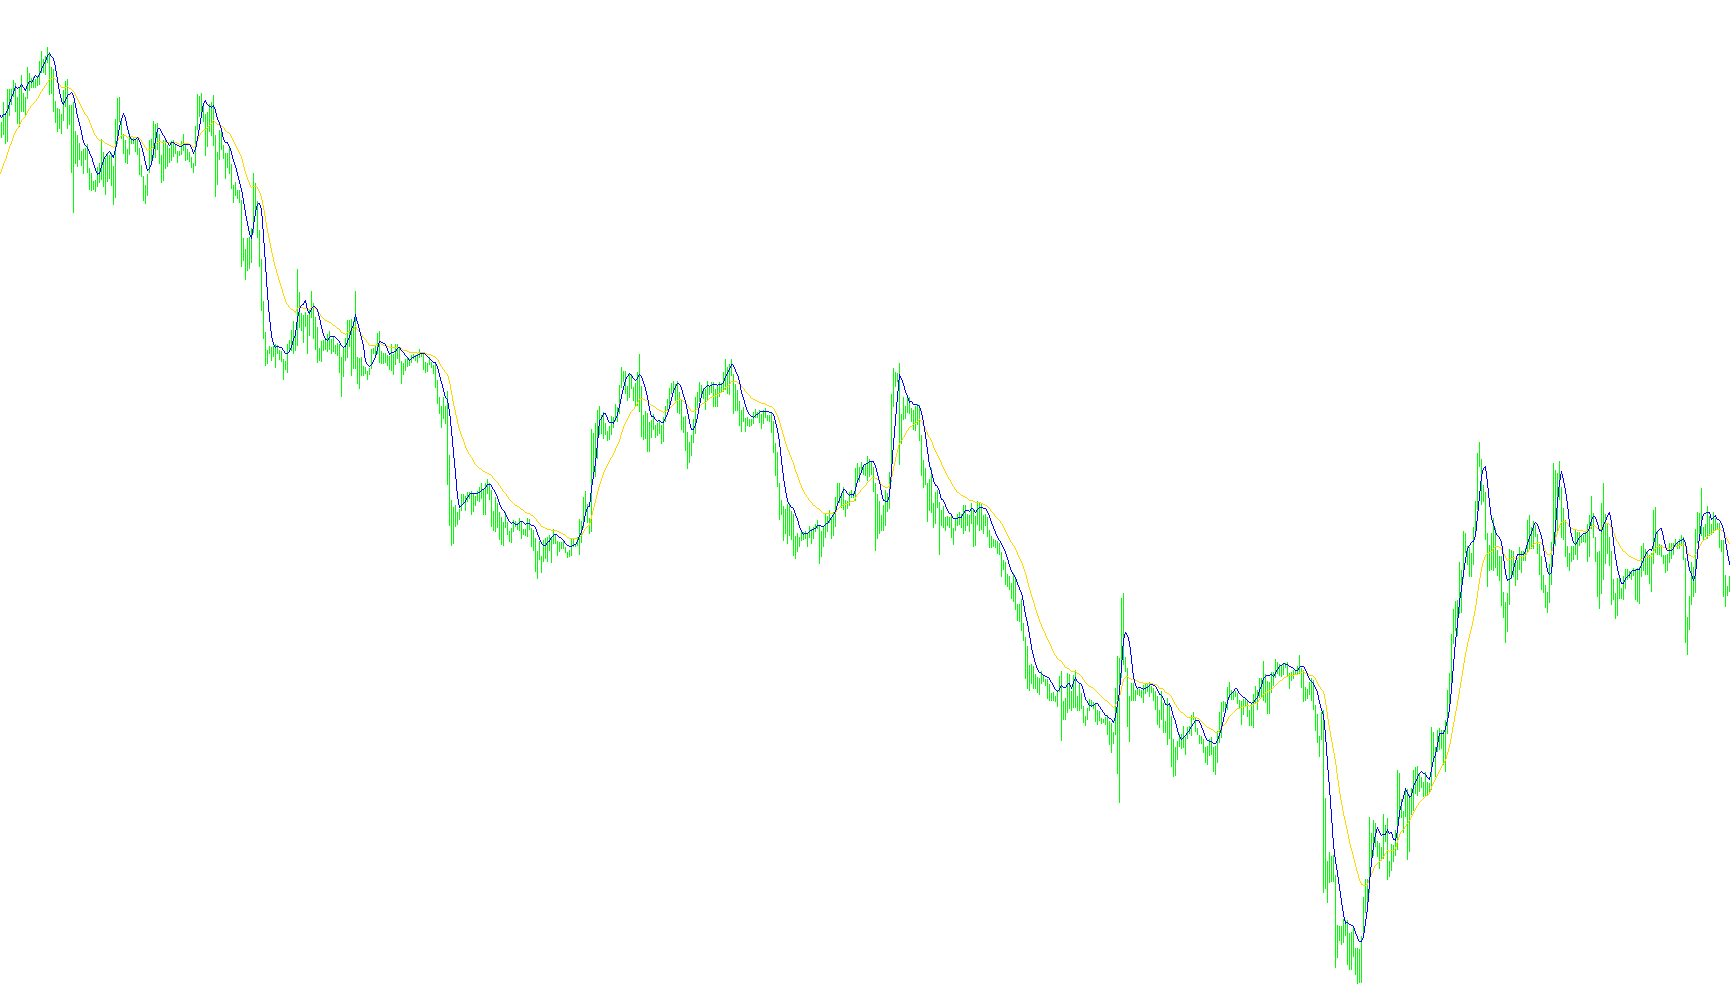
This indicator visualizes trend dynamics by plotting a 21-period Exponential Moving Average and a 5-period Simple Moving Average derived from the median price of the high and low ranges.

4hVegasMetaTraderWeeklyIndicator(1)
Indicator

4hVegasMetaTraderWeeklyIndicator(1)

iMA

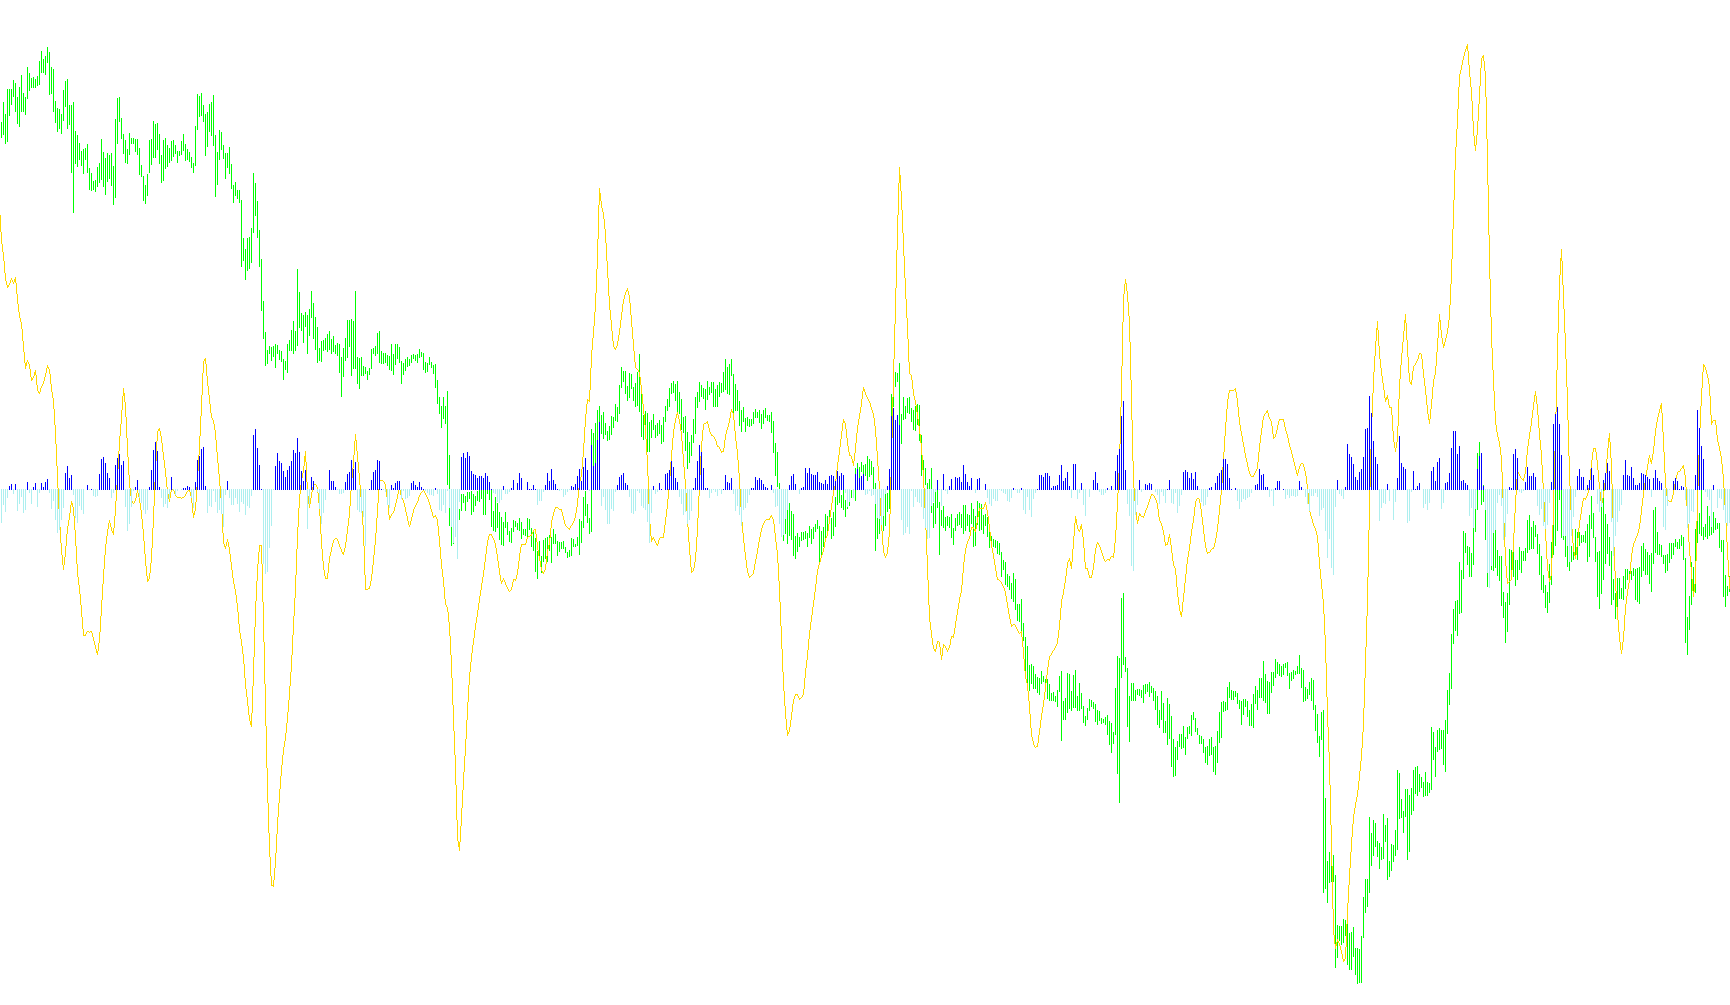
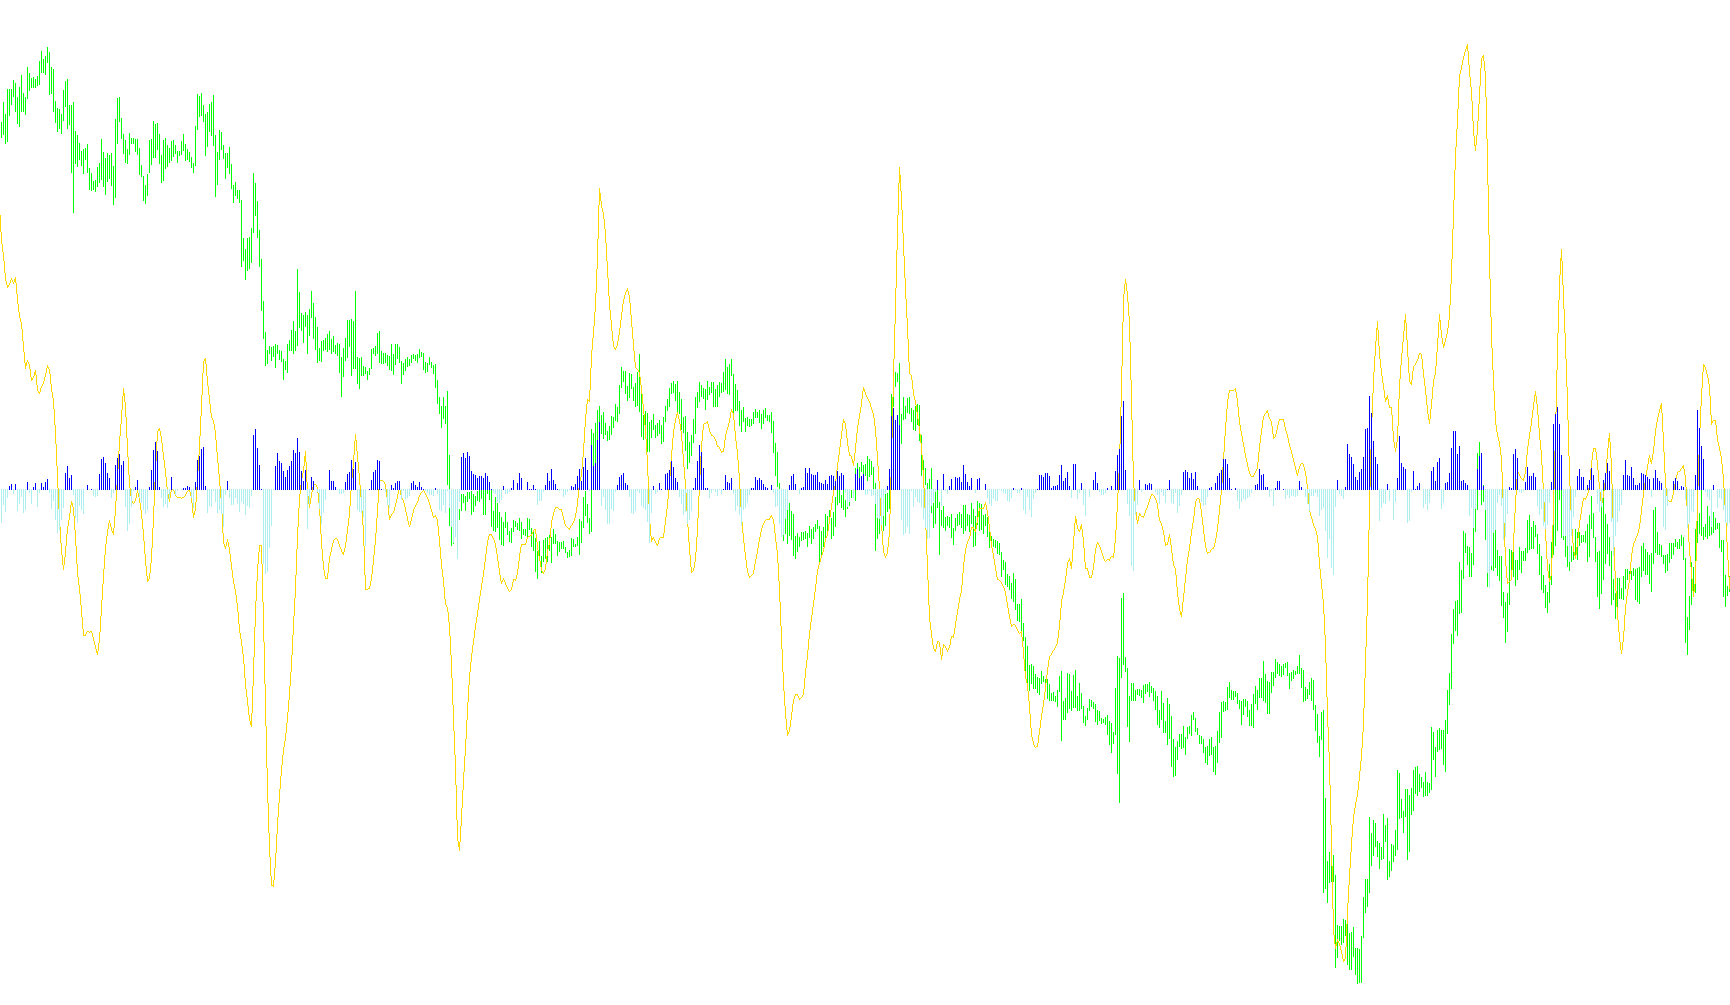
This indicator quantifies directional momentum by measuring the rate of change in the spread between a short-term SMA and a long-term EMA to identify weekly trend acceleration.

4hVegasMetaTraderWeeklyIndicator-V11
Indicator

4hVegasMetaTraderWeeklyIndicator-V11

iMA

This indicator quantifies weekly market sentiment by calculating the rate of change between 5-period simple and 21-period exponential moving averages on a multi-timeframe basis.

4hVegasMetaTraderWeeklyIndicator-V11_v1
Indicator

4hVegasMetaTraderWeeklyIndicator-V11_v1

iMA

This indicator quantifies momentum by calculating the rate of change between a 5-period Simple Moving Average and a 21-period Exponential Moving Average on a weekly timeframe.

4hVegasMetaTraderWeeklyIndicator-V11_v2
Indicator

4hVegasMetaTraderWeeklyIndicator-V11_v2

iMA

This indicator quantifies weekly directional bias by calculating the rate of change between a 5-period Simple Moving Average and a 21-period Exponential Moving Average.

4hVegasMetaTraderWeeklyIndicator
Indicator

4hVegasMetaTraderWeeklyIndicator

iMA

This indicator quantifies weekly directional momentum by measuring the rate of change between a fast Simple Moving Average and a slow Exponential Moving Average on mid-price data.

4hVegasMetaTraderWeeklyIndicator_v1
Indicator

4hVegasMetaTraderWeeklyIndicator_v1

iMA

This indicator quantifies weekly market momentum by calculating the rate of change between a 5-period SMA and a 21-period EMA based on median price levels.

4h_MACD_FX_Strategy
Indicator

4h_MACD_FX_Strategy

iMA

This indicator evaluates market sentiment by cross-referencing price action against a tiered hierarchy of EMA and SMA moving averages to determine bull and bear momentum strength.

4MAs Trend
Indicator

4MAs Trend

iMA

This indicator identifies bullish or bearish trend momentum by detecting strict sequential ordering across four distinct moving averages while highlighting periods of price consolidation.

4MAs Trend_v1
Indicator

4MAs Trend_v1

iMA

This indicator identifies bullish and bearish momentum by tracking the sequential alignment of four distinct moving averages across user-defined timeframes.

4MAs%20Trend
Indicator

4MAs%20Trend

iMA

This indicator visualizes sequential bullish and bearish moving average stacking across specific timeframes while highlighting periods of directional equilibrium.

4MAs_FlatTrend
Indicator

4MAs_FlatTrend

iMA

This indicator visualizes bullish and bearish trend strengths by identifying instances where four distinct moving averages align in consecutive ascending or descending order.

4MAs_Trend
Indicator

4MAs_Trend

iMA

This indicator visualizes bullish and bearish directional strength by identifying sequential stacking of four distinct moving average periods across user-defined timeframes.

Indicator

4PMA-4XTRAFFIC-RSI

iBearsPoweriBullsPoweriMAiRSI
Indicator

4PMA-4XTRAFFIC-RSI_v1

iBearsPoweriBullsPoweriMAiRSI
Indicator

4PMA

iMA
Indicator

4PMA.Psars.Rgrssn.STD.V1

iMAiSAR
Indicator

4PMA.Psars.Rgrssn.STD.V1_v1

iMAiSAR
Indicator

4PMA.Psars.Rgrssn.STD.V2

iMAiSAR
Indicator

4PMA.Psars.Rgrssn.STD.V2_v1

iMAiSAR
Indicator

4PMA[1].Psars.Rgrssn.STD.V3

iMAiSAR
Indicator

4PMA[1].RSI.Rgrssn.STD.V1c

iMAiRSI
Indicator

4PMA[1].RSI.Rgrssn.STD.V1c_v1

iMAiRSI
Indicator

4PMA_1__1_.Psars.Rgrssn.STD.V3

iMAiSAR
Indicator

4PMA_v1

iMA
Indicator

4PMA_v2

iMA
Indicator

4XTraffic_RSI_v1a

iMAiRSI
Indicator

4XTraffic_RSI_v1a_v1

iMAiRSI
Indicator

4XTraffic_RSI_v1b

iMAiRSI
Indicator

4XTraffic_RSI_v1b_v1

iMAiRSI
4_MA_Strength
Indicator

4_MA_Strength

iMA

This indicator quantifies market momentum by calculating a cumulative hierarchy of bullish and bearish alignment across four distinct moving average periods.

4_MA_Strength1
Indicator

4_MA_Strength1

iMA

This indicator quantifies trend conviction by calculating the hierarchical stacking and relative positioning of four distinct moving averages to determine cumulative directional strength.

4_MA_Strength_v1
Indicator

4_MA_Strength_v1

iMA

This indicator quantifies trend intensity by calculating the relative hierarchical alignment of four distinct moving averages to produce a cumulative momentum score.

Indicator

4_Period_MA1

iMA
Indicator

4_Period_MA1_v1

iMA
Indicator

4_Period_MA_Psars_V1

iMAiSAR
Indicator

4_Period_MA_Psars_V1_v1

iMAiSAR
Indicator

4_Period_MA_w.Regr.STD

iMA
4_Period_MA_w_Regr_STD
Indicator

4_Period_MA_w_Regr_STD

iMA

This indicator synchronizes seven moving averages across four distinct timeframes to project dynamic Fibonacci support/resistance zones and regression channels simultaneously.

5-8openEMA_Cross_Arrow_with_Alerts
Indicator

5-8openEMA_Cross_Arrow_with_Alerts

iMA

This indicator identifies and plots precise visual markers where a faster exponential moving average intersects a slower one, utilizing dynamic price range offsets for clearer signal detection.

5383-lbr-1000-pips-one-week-ki_signals1_h1-low_3-10-18_optimized
Indicator

5383-lbr-1000-pips-one-week-ki_signals1_h1-low_3-10-18_optimized

iMAiMAOnArray

The indicator identifies trend reversals by calculating the signal of Exponential Moving Average differences across M30 and H1 periods to detect synchronized momentum shifts.

5minYANS_IND_01
Indicator

5minYANS_IND_01

iMAiSAR

This indicator identifies high-probability trend shifts by synchronizing Exponential Moving Average crossovers with Parabolic SAR volatility breakouts.

5minYANS_IND_01_v1
Indicator

5minYANS_IND_01_v1

iMAiSAR

The indicator identifies trend reversals and momentum shifts by tracking dual EMA crossovers combined with Parabolic SAR price breaches and specific period-count filters.

5minYANS_IND_02
Indicator

5minYANS_IND_02

iMAiSAR

This indicator identifies trend reversals by detecting crossovers between dual Exponential Moving Averages and Parabolic Stop_Loss levels, filtered by price proximity to the SAR volatility band.

5minYANS_IND_02_v1
Indicator

5minYANS_IND_02_v1

iMAiSAR

This indicator identifies high-probability trend reversals by synchronizing EMA momentum crossovers with Parabolic SAR threshold breaches and distance-based cross validations.

5minYANS_IND_03
Indicator

5minYANS_IND_03

iMAiSAR

This indicator identifies trend shifts by detecting crossovers between 10 and 40-period Exponential Moving Averages while tracking parabolic support/resistance dynamics.

5minYANS_IND_03_v1
Indicator

5minYANS_IND_03_v1

iMAiSAR

This indicator identifies trend shifts by detecting precise crossovers between fast and slow Exponential Moving Averages (EMA 10 and EMA 40).

Indicator

5_34_5

iMA
Indicator

5_34_5_003

iMA