ADX+Period
Indicator

ADX+Period

iMAOnArray

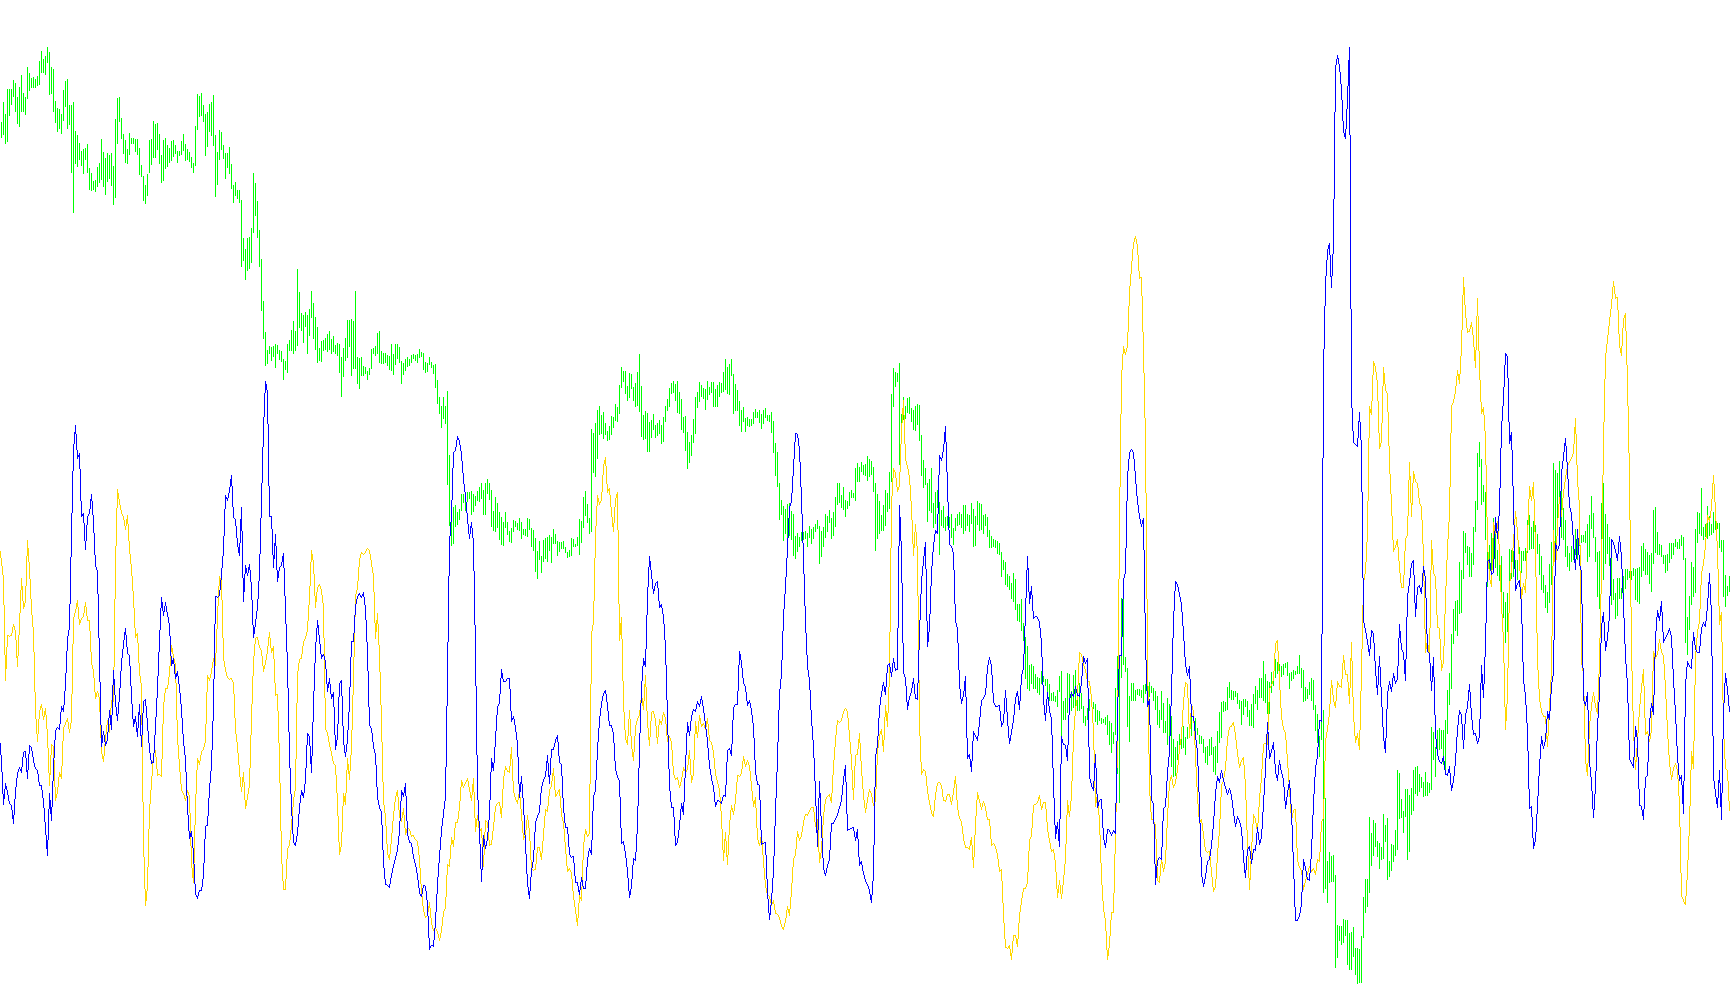
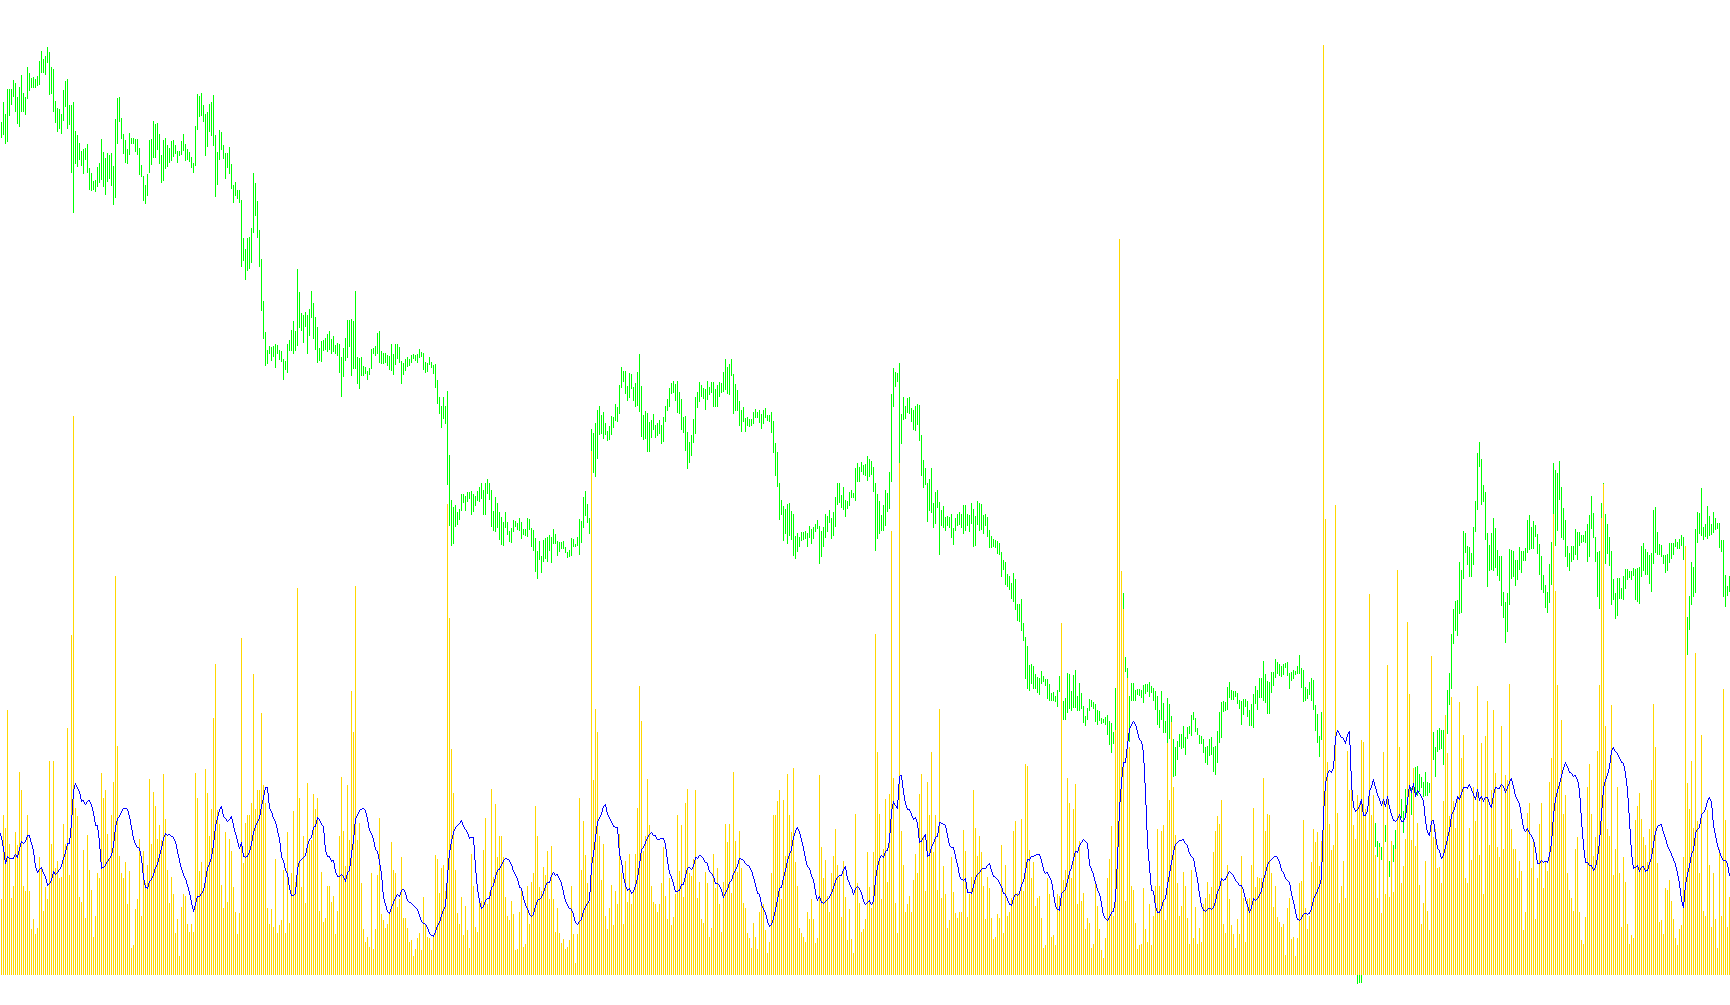
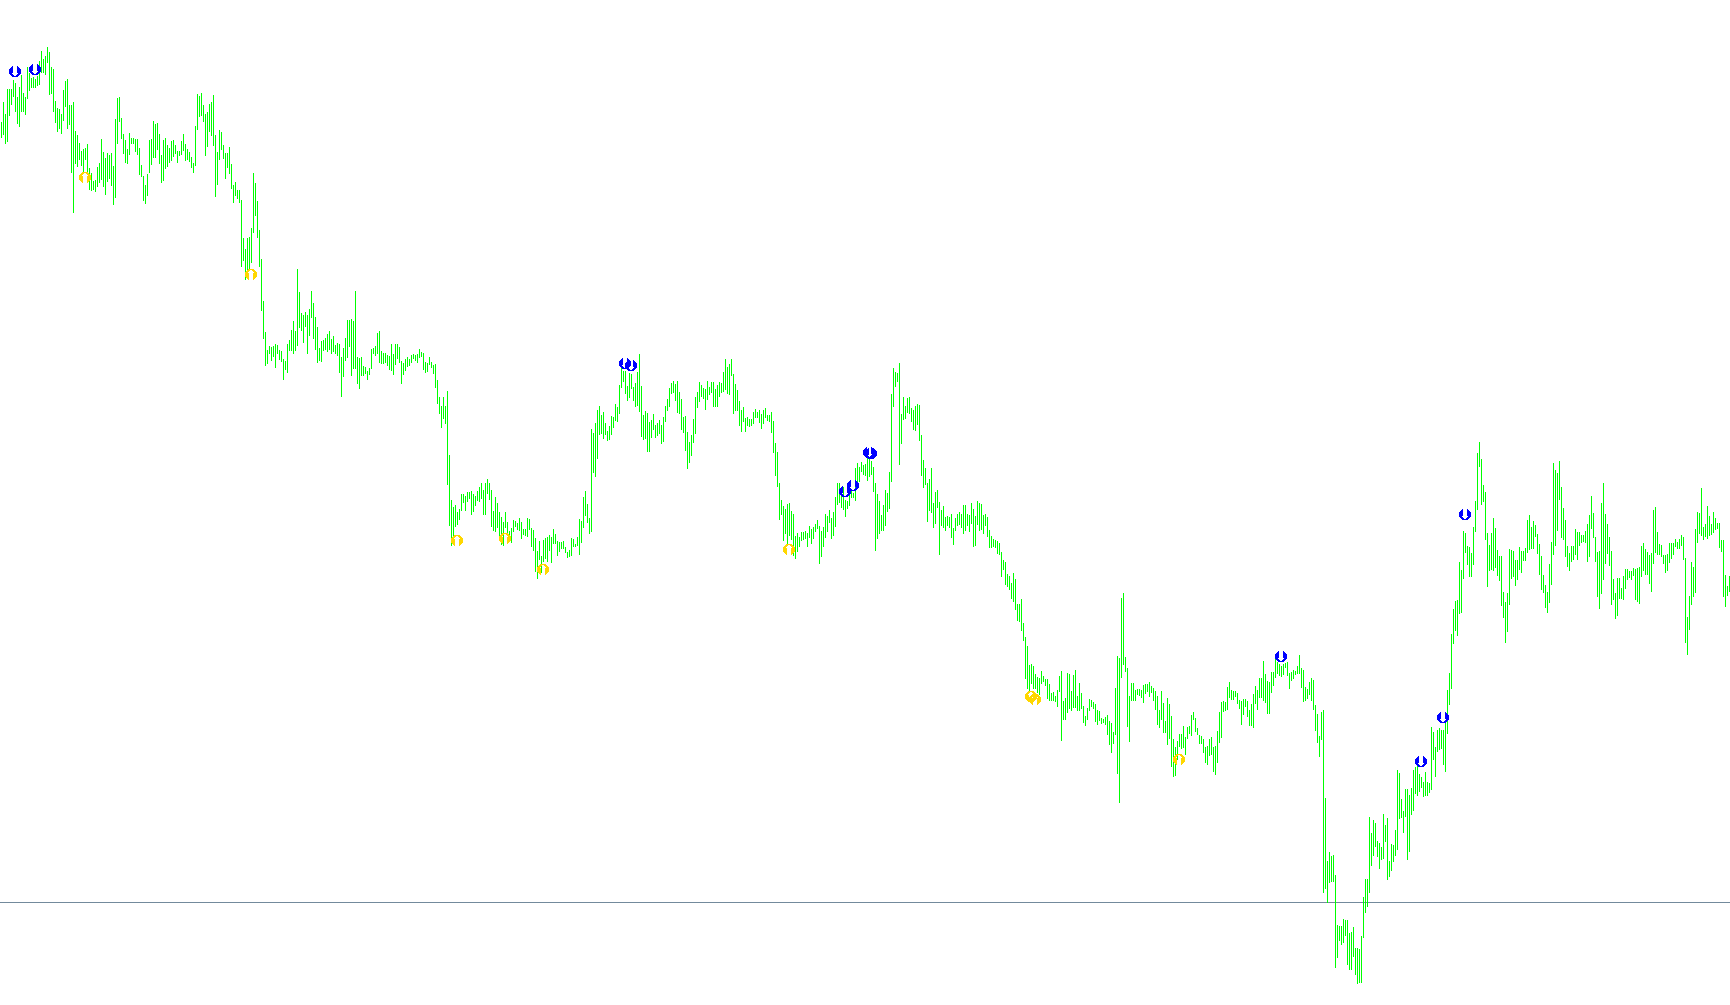
This indicator calculates the Average Directional Index by applying exponential moving averages to smoothed directional movement components across specific timeframes.

ADX-StDev
Indicator

ADX-StDev

iMAOnArrayiStdDevOnArray

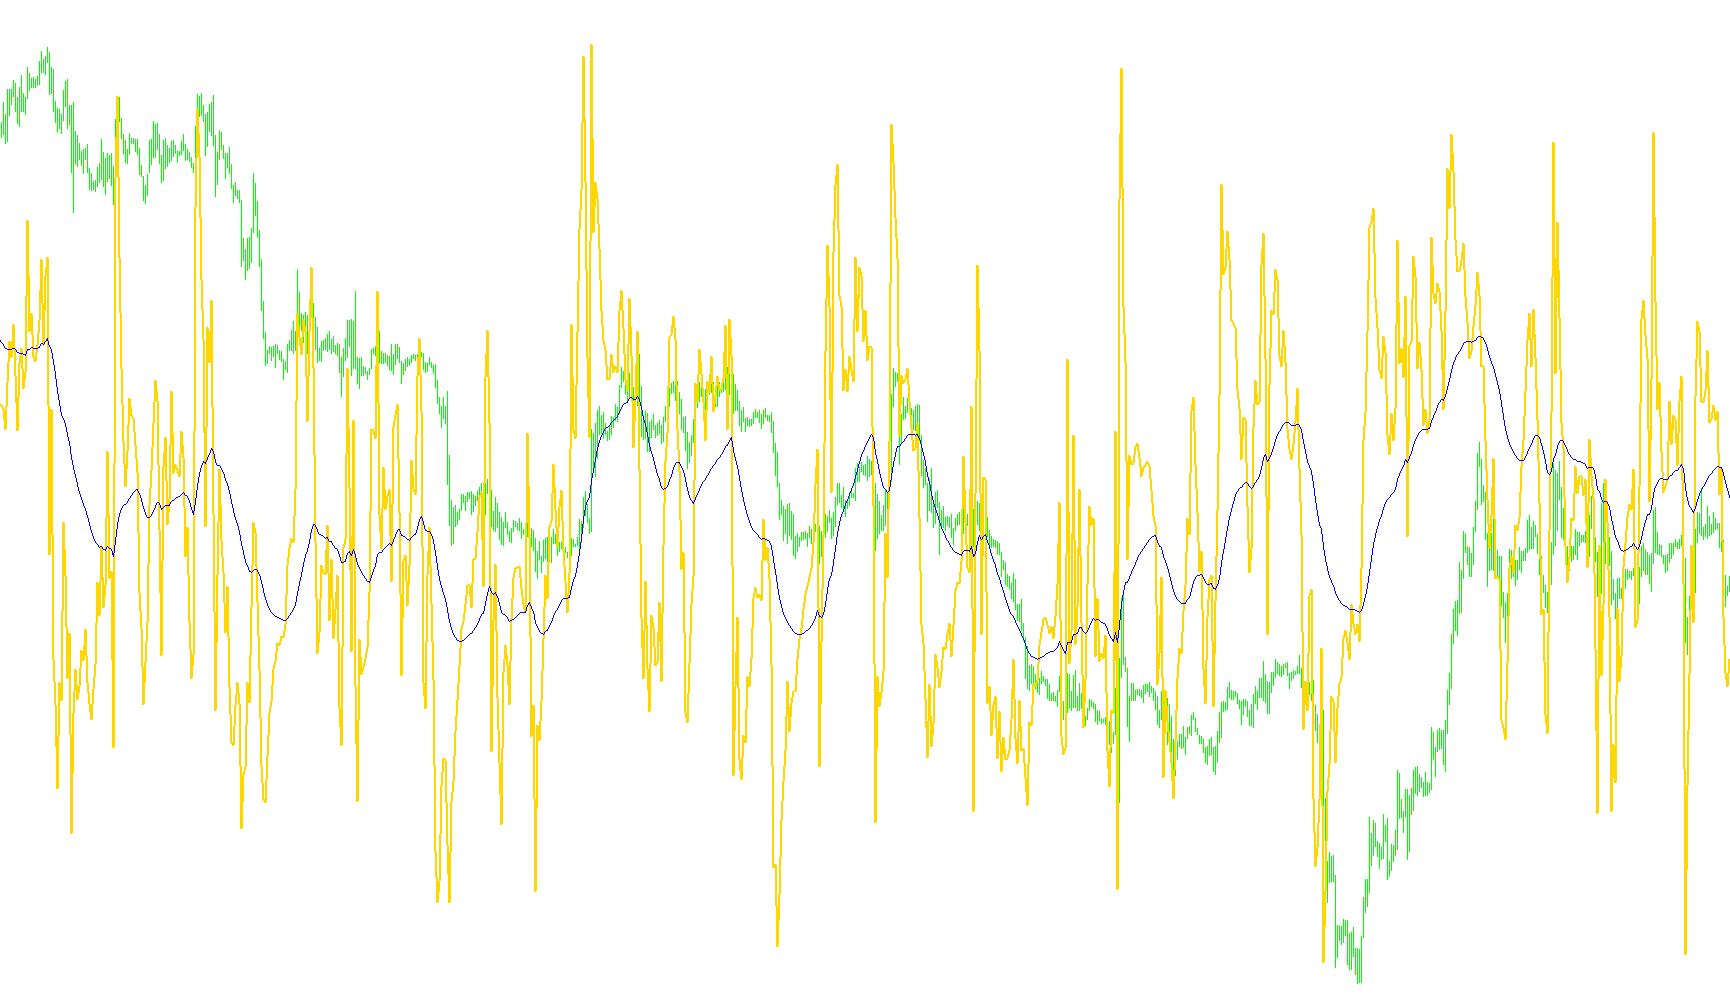
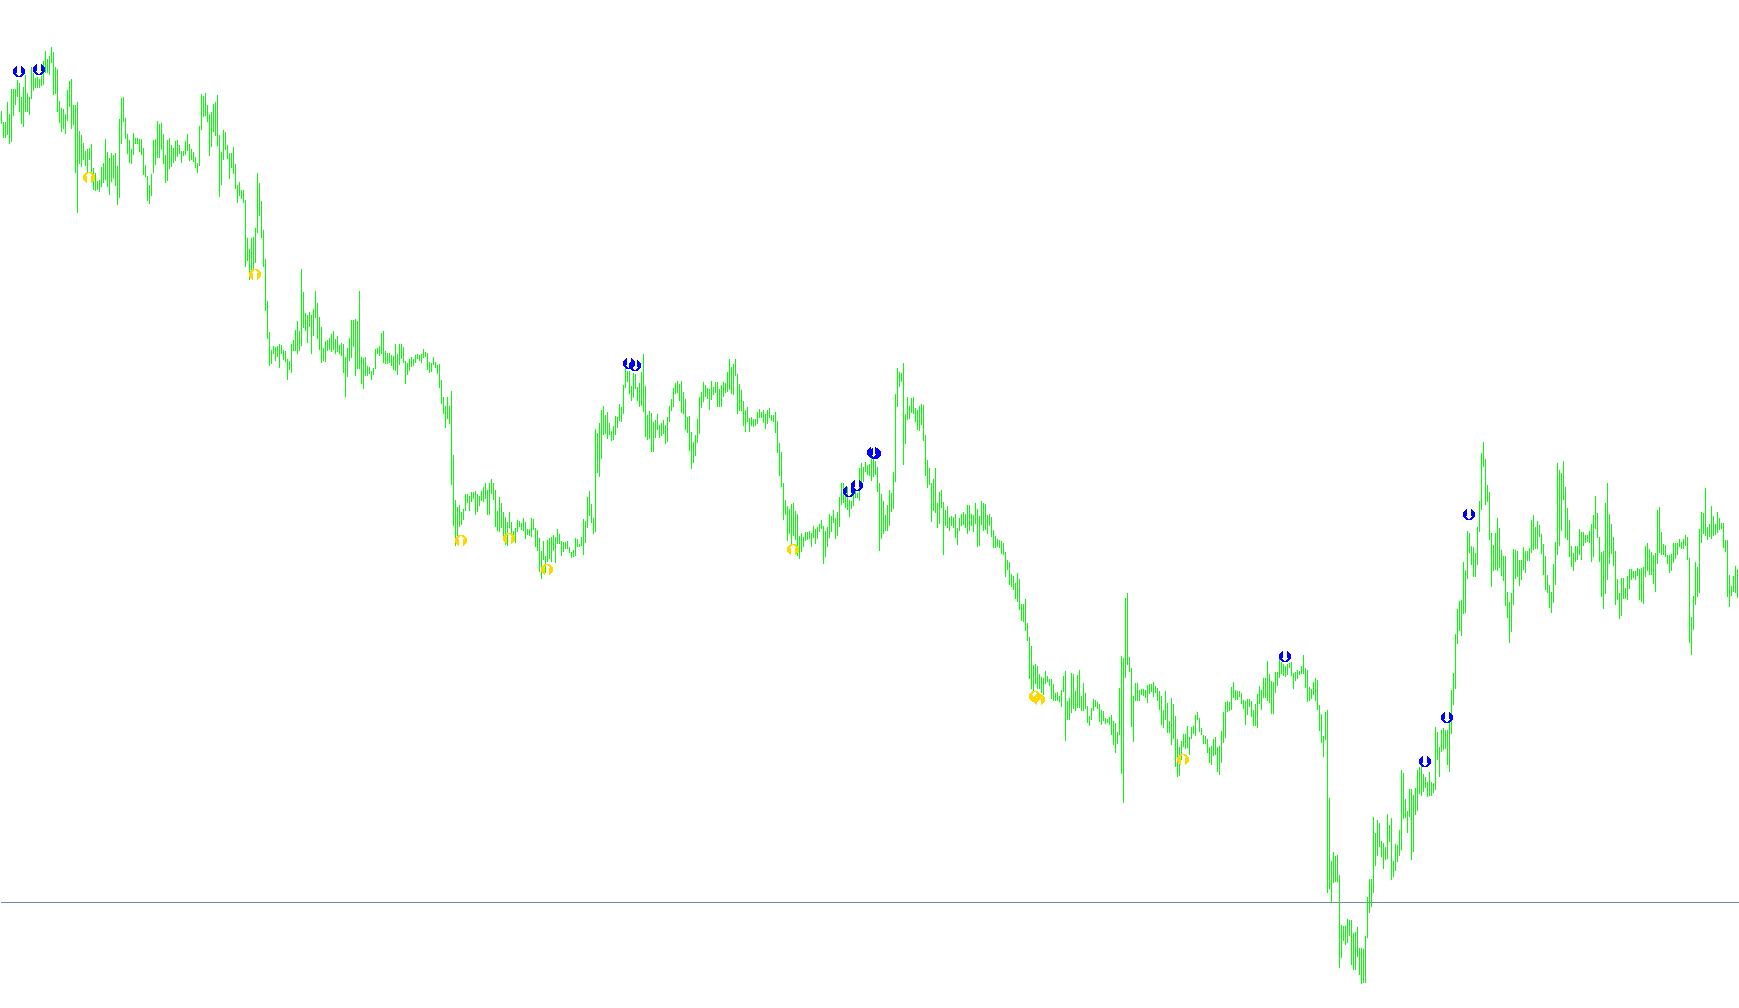
This indicator synthesizes directional movement indices with smoothed standard deviation analysis to quantify trend strength and price dispersion simultaneously.

ADX-WMA-version
Indicator

ADX-WMA-version

iMAOnArray

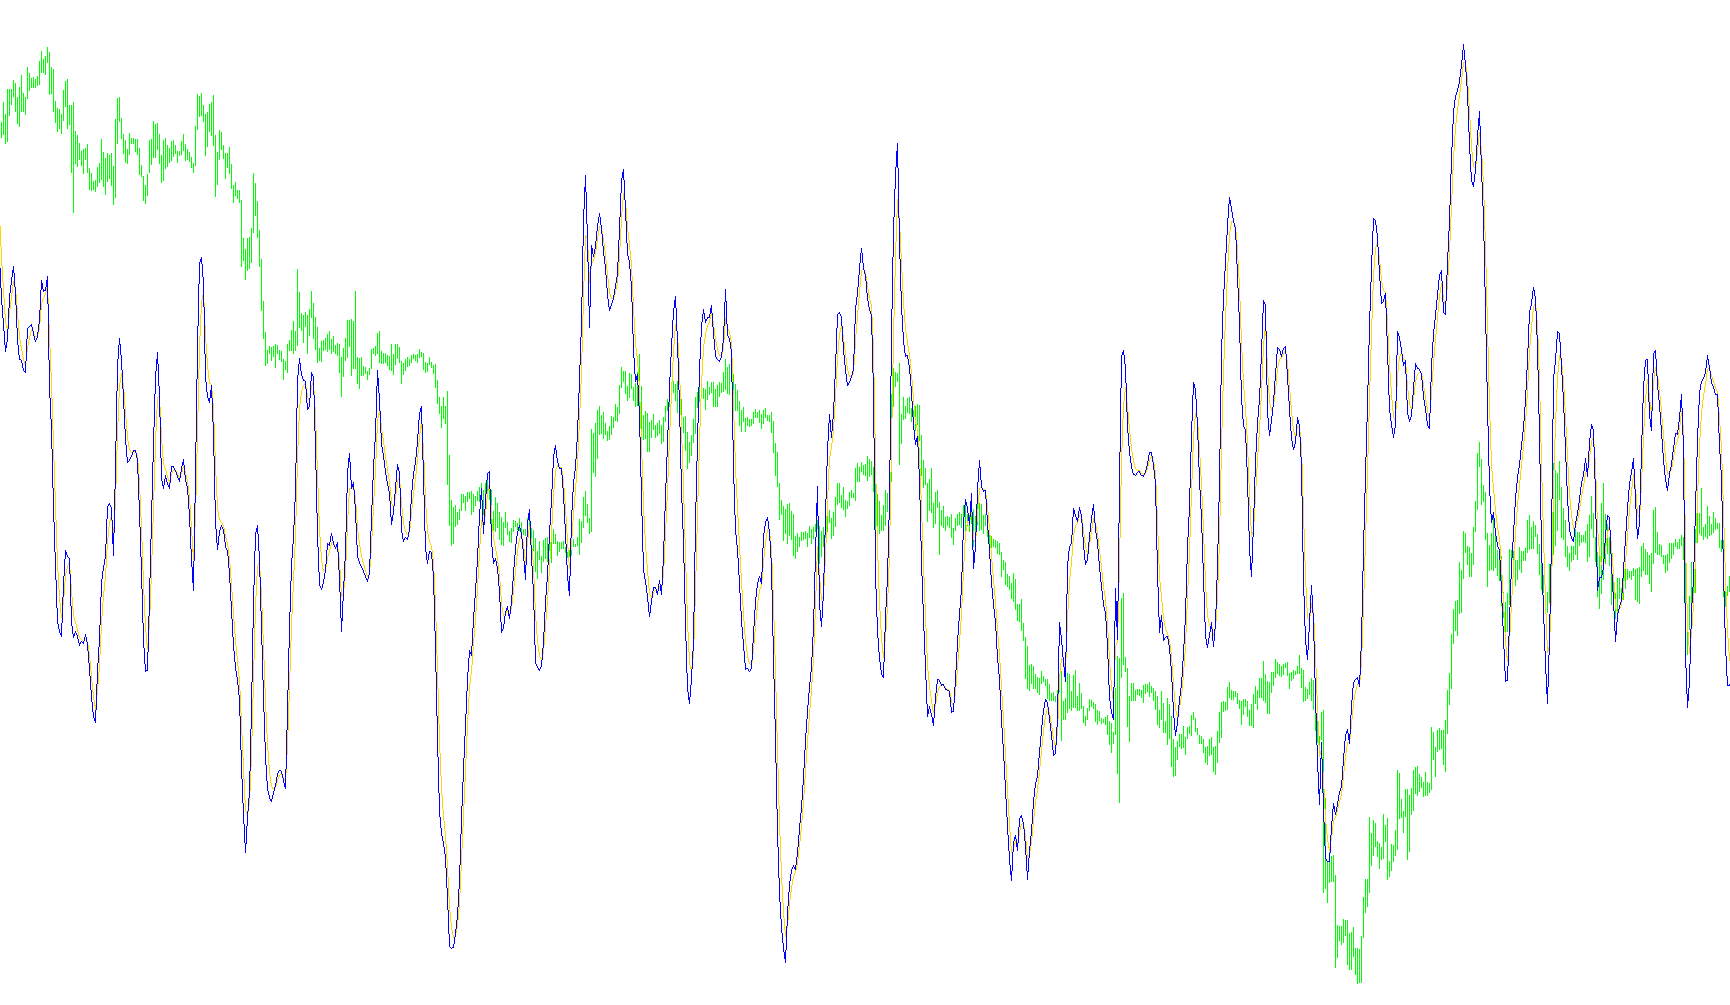
This indicator calculates market trend strength by smoothing the Directional Movement Index (DX) using a Weighted Moving Average (WMA) calculation instead of a standard exponential average.

adx
Indicator

adx

iMAOnArray

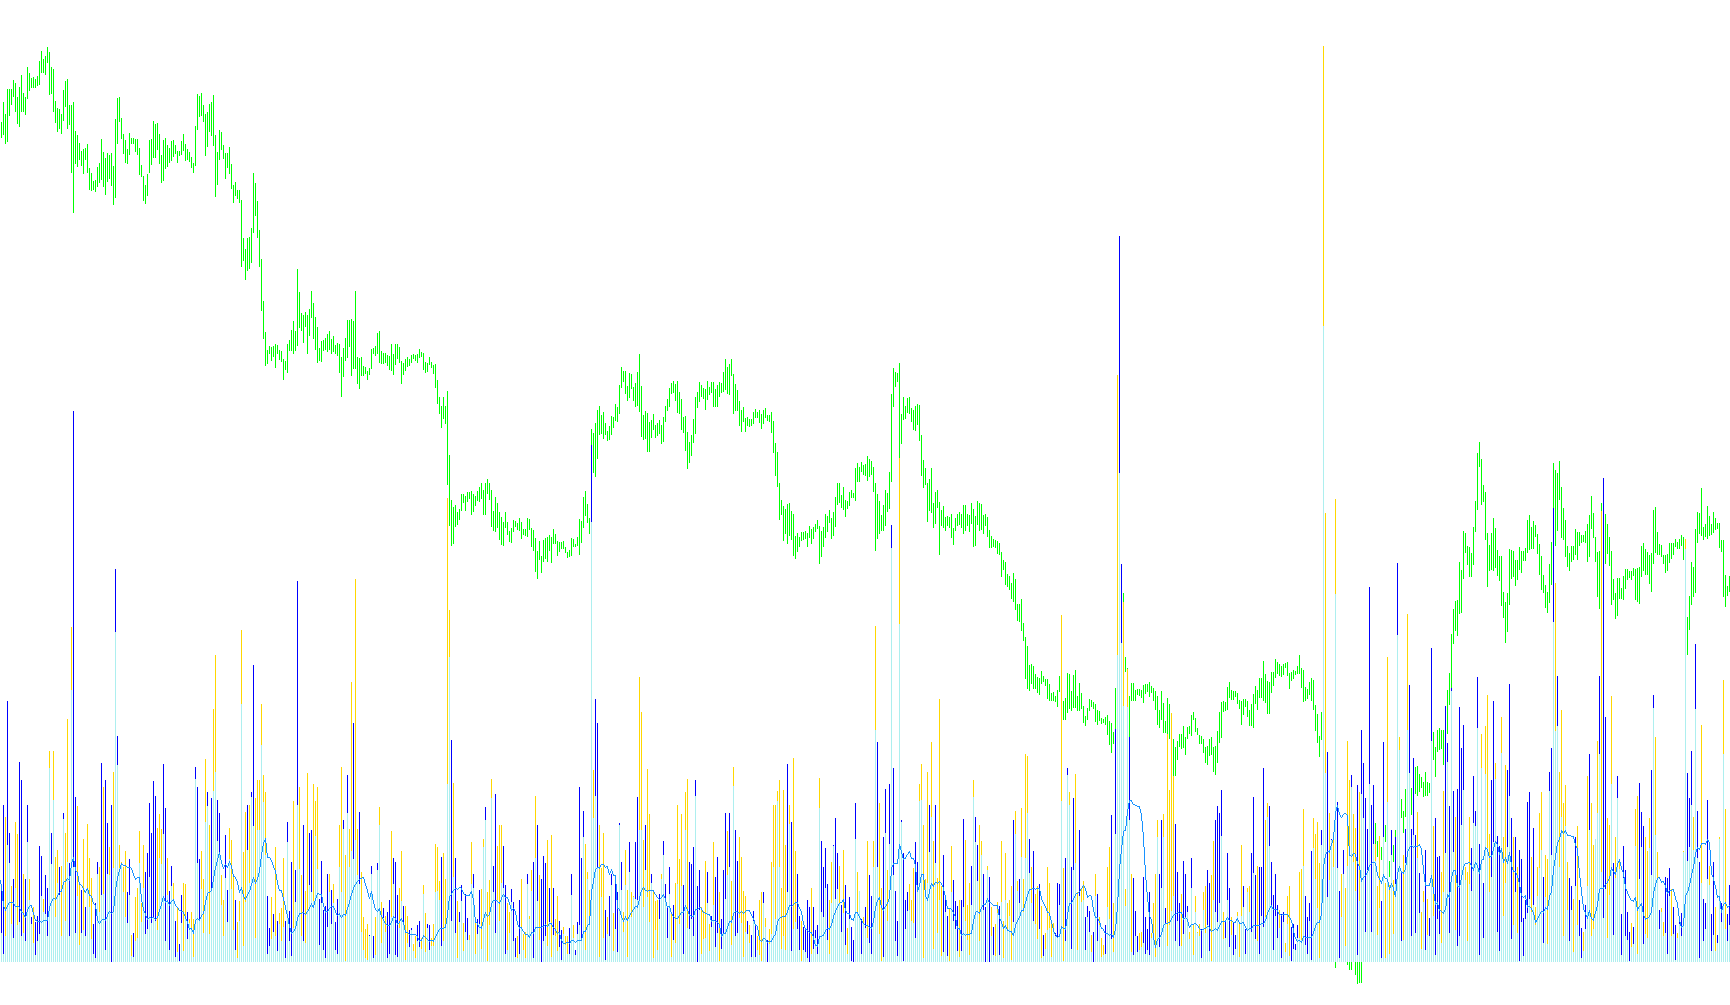
This algorithm quantifies trend strength and directional bias by calculating the relative difference between upward and downward price movements smoothed via exponential moving averages.

ADXbarsSmd[cw]
Indicator

ADXbarsSmd[cw]

iADXiMAOnArray

This indicator captures price extremes by swapping High and Low values based on the dominance of PlusDI and MinusDI, then applies a simple moving average to visualize smoothed trend boundaries.

ADXbarsSmd[sw]
Indicator

ADXbarsSmd[sw]

iADXiMAOnArray

This indicator reassigns high and low price extremes based on DMI directionality before applying a moving average to generate smoothed trend boundaries.

ADXbars_v1
Indicator

ADXbars_v1

iADXiMAOnArray

This indicator maps high and low price extremes based on the dominance of PlusDI versus MinusDI, then applies a Simple Moving Average to generate smoothed trend signals.

adxdon
Indicator

adxdon

iMAOnArray

The algorithm calculates directional movement by filtering price range extremes through exponential moving averages to determine trend intensity and polarity.

adxdon_hist
Indicator

adxdon_hist

iMAOnArray

This indicator quantifies directional strength by calculating the exponential moving average of price range disparities and distinguishing between bullish and bearish trend velocity via histogram toggles.

adxdon_onlyADX
Indicator

adxdon_onlyADX

iMAOnArray

This indicator calculates trend strength by smoothing directional movement and true range through exponential moving averages to determine relative price momentum.

adxdon_v1
Indicator

adxdon_v1

iMAOnArray

This indicator calculates the strength and direction of market trends by normalizing the difference between positive and negative directional movements against a smoothed true range.

ADXdon_v2
Indicator

ADXdon_v2

iMAOnArray

This indicator calculates the strength of a trend by smoothing directional movement and true range through exponential moving averages to determine price velocity.

ADXmod
Indicator

ADXmod

iMAOnArray

This indicator quantifies trend strength and direction by calculating the ratio of positive to negative price movements smoothed via exponential moving averages.

ADXmodified_v1
Indicator

ADXmodified_v1

iMAOnArray

This indicator calculates the trend strength and direction by applying an exponential moving average to the difference between smoothed positive and negative directional movements.

ADXmodified_v2
Indicator

ADXmodified_v2

iMAOnArray

This indicator calculates directional movement by applying exponential moving averages to smoothed directional indices, specifically amplifying the net trend variance for enhanced volatility detection.

adx_v1
Indicator

adx_v1

iMAOnArray

This indicator quantifies trend intensity and direction by smoothing directional movement components through nested exponential moving averages.

AD_OsWAD_macdosma4c
Indicator

AD_OsWAD_macdosma4c

iADiMAOnArray
afl_winner
Indicator

afl_winner

iMAOnArray

This indicator calculates a price-action value weighted by volume, normalizes it into a relative strength range, and applies a double linear weighted moving average to identify bullish and bearish momentum shifts.

AMA_for_Expert2
Indicator

AMA_for_Expert2

iMAOnArray

This indicator calculates a self-adjusting moving average by weighing price fluctuations against historical volatility and identifies significant trend reversals through standard deviation threshold analysis.

AMA_optimized_final_Slope
Indicator

AMA_optimized_final_Slope

iMAOnArray

This indicator calculates an optimized Adaptive Moving Average (AMA) to determine momentum shifts by filtering market noise and identifying significant price velocity through standard deviation thresholds.

ang_ALR(V)
Indicator

ang_ALR(V)

iMAOnArray

This indicator quantifies momentum by calculating the derivative of a linear regression slope adjusted by a rounding threshold for noise suppression.

AO_FozzySignal
Indicator

AO_FozzySignal

iMAOnArrayiRSI

This indicator identifies bullish and bearish reversals by detecting momentum crossovers of a smoothed RSI relative to its own Bollinger Band envelope.

AO_FozzySignalALL
Indicator

AO_FozzySignalALL

iMAOnArrayiRSI

This indicator synthesizes Relative Strength Index dynamics with Bollinger Band volatility envelopes to generate precise momentum crossover signals and trend reversals.

AO_FozzySignal_BT
Indicator

AO_FozzySignal_BT

iMAOnArrayiRSI

This indicator identifies momentum shifts by calculating a Bollinger Band overlay on a smoothed Relative Strength Index to detect price exhaustion and crossovers.

ASO
Indicator

ASO

iMAOnArray

This indicator quantifies bullish and bearish pressure by calculating the relative position of price action within both individual candle ranges and multi-period high-low envelopes.

ATR CountBack
Indicator

ATR CountBack

iMAOnArray

This indicator calculates the Average True Range by aggregating price extremes across specific historical offsets and higher timeframe dimensions to measure latent market volatility.

ATR Darma
Indicator

ATR Darma

iATRiMAOnArray

This indicator calculates the average true range and overlays a secondary moving average to identify smoothed volatility trends and fluctuations.

ATR MA Oscillator
Indicator

ATR MA Oscillator

iMAOnArray

This indicator quantifies volatility dynamics by calculating the differential between a primary Average True Range mean and its secondary smoothing signal line.

ATR-MQLS
Indicator

ATR-MQLS

iMAOnArray

This indicator calculates separate Simple Moving Average smoothing for bullish and bearish price ranges to visualize directional volatility dynamics.

ATR
Indicator

ATR

iMAOnArray

This indicator quantifies market turbulence by calculating the mean distance between price extremes and previous closing values over a rolling temporal window.

ATR_Chart_Labeled
Indicator

ATR_Chart_Labeled

iMAOnArray

This indicator calculates and displays the smoothed Average True Range alongside real-time text labels to monitor current and previous volatility levels.

atr_filter
Indicator

atr_filter

iATRiMAOnArray

This indicator identifies overarching market turbulence by applying a smoothed moving average to the Average True Range values.

ATR_Ratio_v1
Indicator

ATR_Ratio_v1

iATRiMAOnArray

This indicator calculates the relative ratio between a fast and slow Average True Range to identify momentum shifts in market volatility dynamics.

ATR_Ratio_v1a
Indicator

ATR_Ratio_v1a

iATRiMAOnArray

This indicator quantifies relative market turbulence by calculating the ratio between a fast and slow Average True Range, smoothed through a moving average to identify shifting volatility dynamics.

ATR_Separate_Labeled
Indicator

ATR_Separate_Labeled

iMAOnArray

This indicator calculates the Average True Range and projects it onto a separate sub-window while displaying real-time current and previous period volatility values as on-chart text labels.

ATR_x2
Indicator

ATR_x2

iMAOnArray

Quantifies market price fluctuations by calculating a smoothed moving average of the maximum distance between high-low ranges and previous closing prices.

BB_PRC-1
Indicator

BB_PRC-1

iBandsiMAOnArray
BB_PRC-1_v1
Indicator

BB_PRC-1_v1

iBandsiMAOnArray
BB_PRC
Indicator

BB_PRC

iBandsiMAOnArray
BearNakedPattern1.1
Indicator

BearNakedPattern1.1

iBandsiCCIiMAOnArray
BearNakedPattern1.2
Indicator

BearNakedPattern1.2

iBandsiCCIiMAOnArray

This indicator identifies potential reversal points by detecting CCI momentum shifts against moving averages while validating price action proximity to Bollinger Band boundaries and specific volatility thresholds.

BearNakedPattern1
Indicator

BearNakedPattern1

iBandsiCCIiMAOnArray
BH-Ergodic
Indicator

BH-Ergodic

iMAOnArray

This indicator calculates a normalized price momentum ratio by applying successive exponential moving averages to price deltas and their absolute values to identify smoothed trend directions.

BH-Ergodic_002
Indicator

BH-Ergodic_002

iMAOnArray

This indicator calculates price velocity by applying nested exponential moving averages to relative price deltas, providing a smoothed ratio of directional momentum versus absolute volatility.

BobCCI2levelsingle
Indicator

BobCCI2levelsingle

iMAOnArray

This indicator identifies trend reversals by calculating a smoothed ratio of relative price velocity against its absolute volatility magnitude using nested exponential moving averages.

candles_01
Indicator

candles_01

iMAOnArray

The indicator quantifies market sentiment by calculating the ratio of bullish to bearish candle counts over a lookback period while simultaneously visualizing relative shadow lengths and average body magnitudes.

Candle_MA
Indicator

Candle_MA

iMAOnArray

This indicator calculates moving averages on various candlestick price components, including relative body proportions, wick lengths, and weighted price types.

Indicator

cci hist_EMA_COL

iCCIiMAOnArray
cci_filter
Indicator

cci_filter

iCCIiMAOnArray

This indicator applies a Smoothed Moving Average to the Commodity Channel Index to isolate long-term momentum trends and filter out market noise.

CCI_Trigger
Indicator

CCI_Trigger

iCCIiMAOnArray

This indicator identifies directional bias by analyzing the convergence of smoothed Commodity Channel Index values against multi-period moving averages and price action polarity.