Indexes_v7L
Indicator

Indexes_v7L

iCCIOnArrayiMomentumOnArrayiMAOnArrayiRSIOnArray

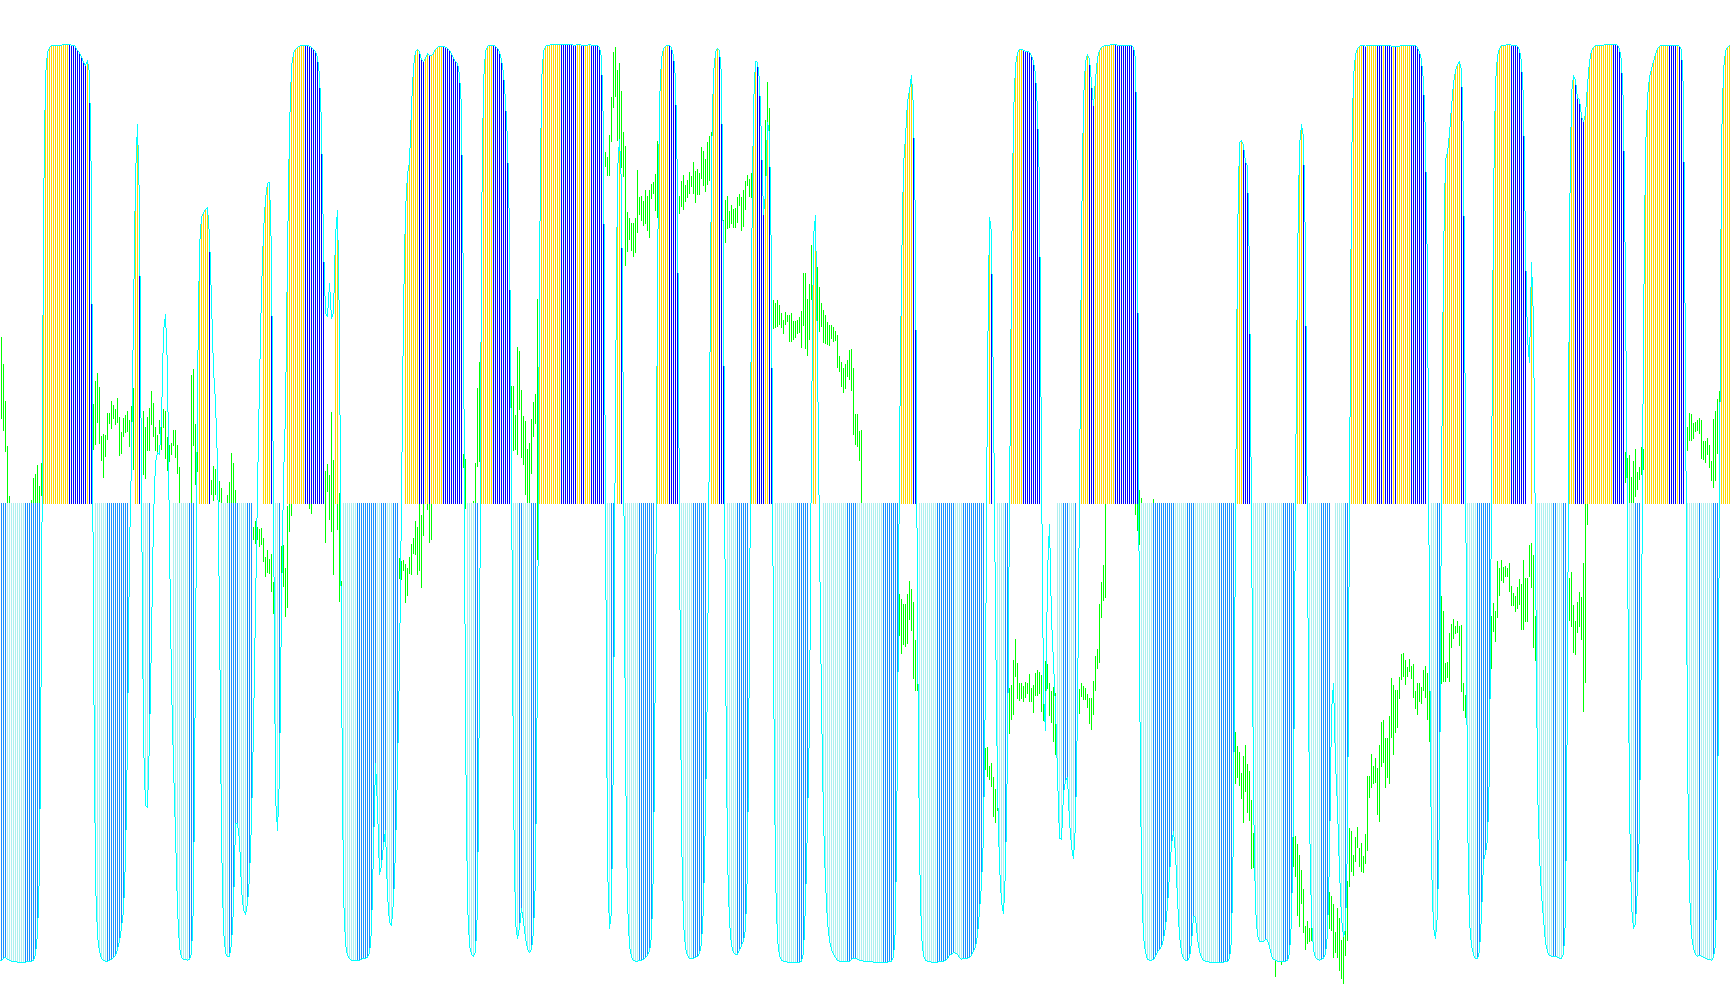
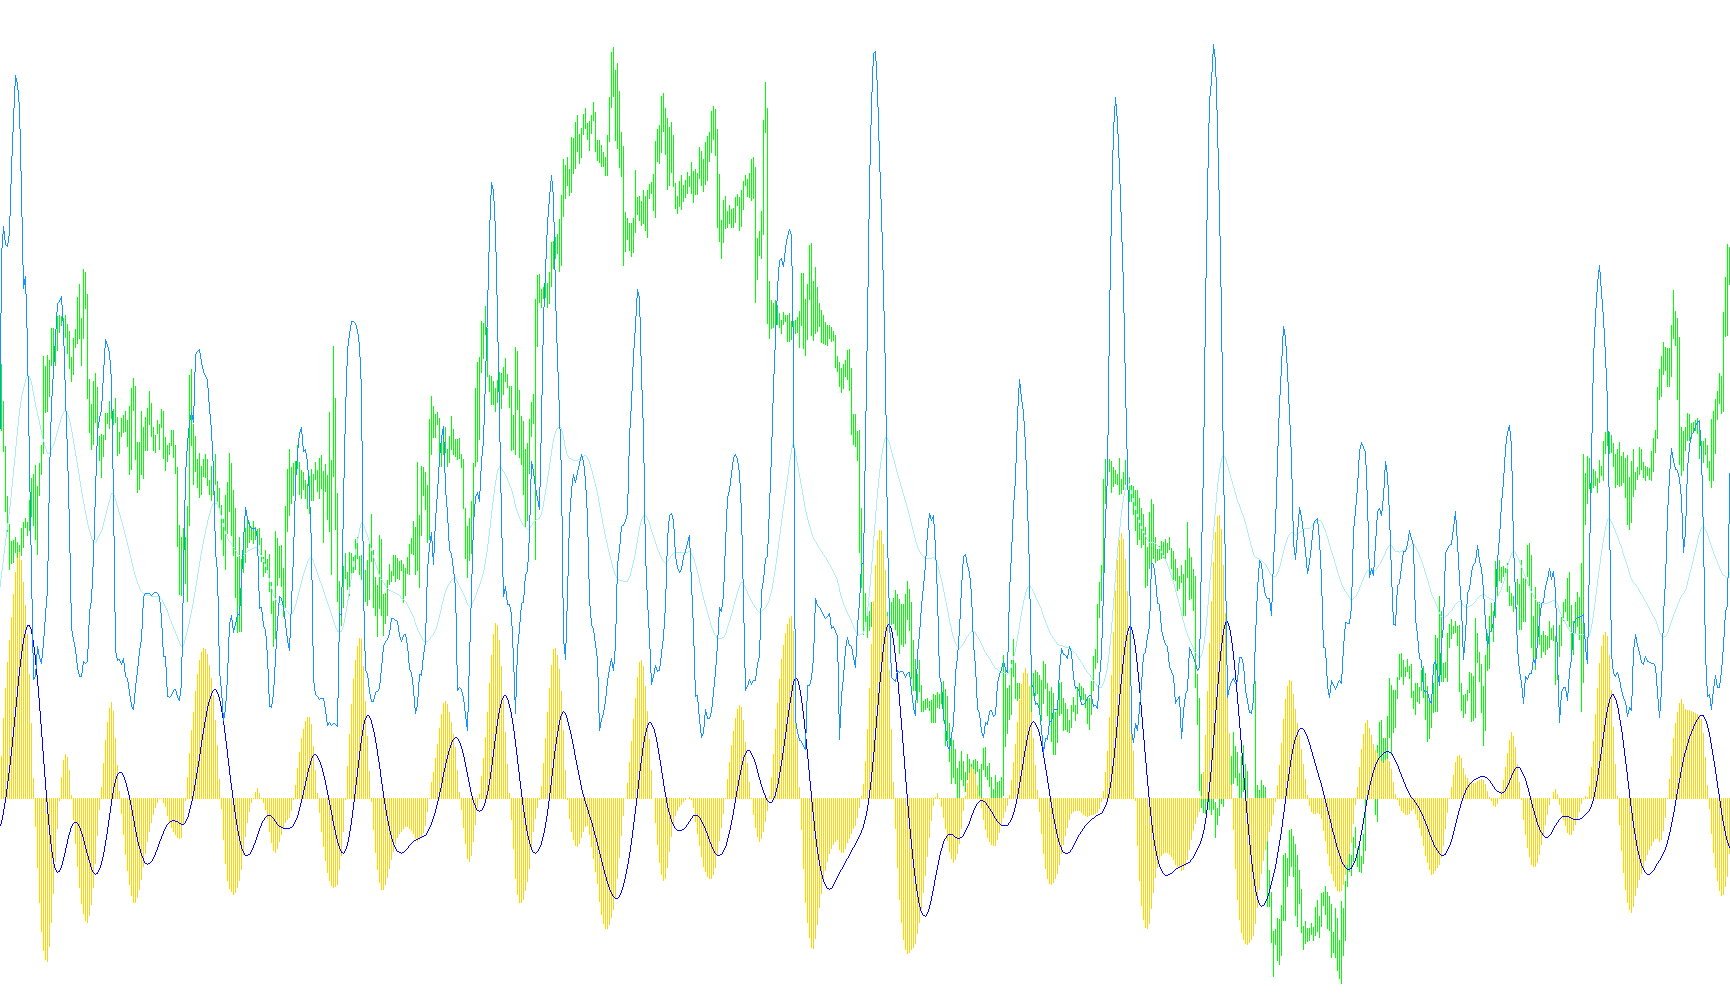
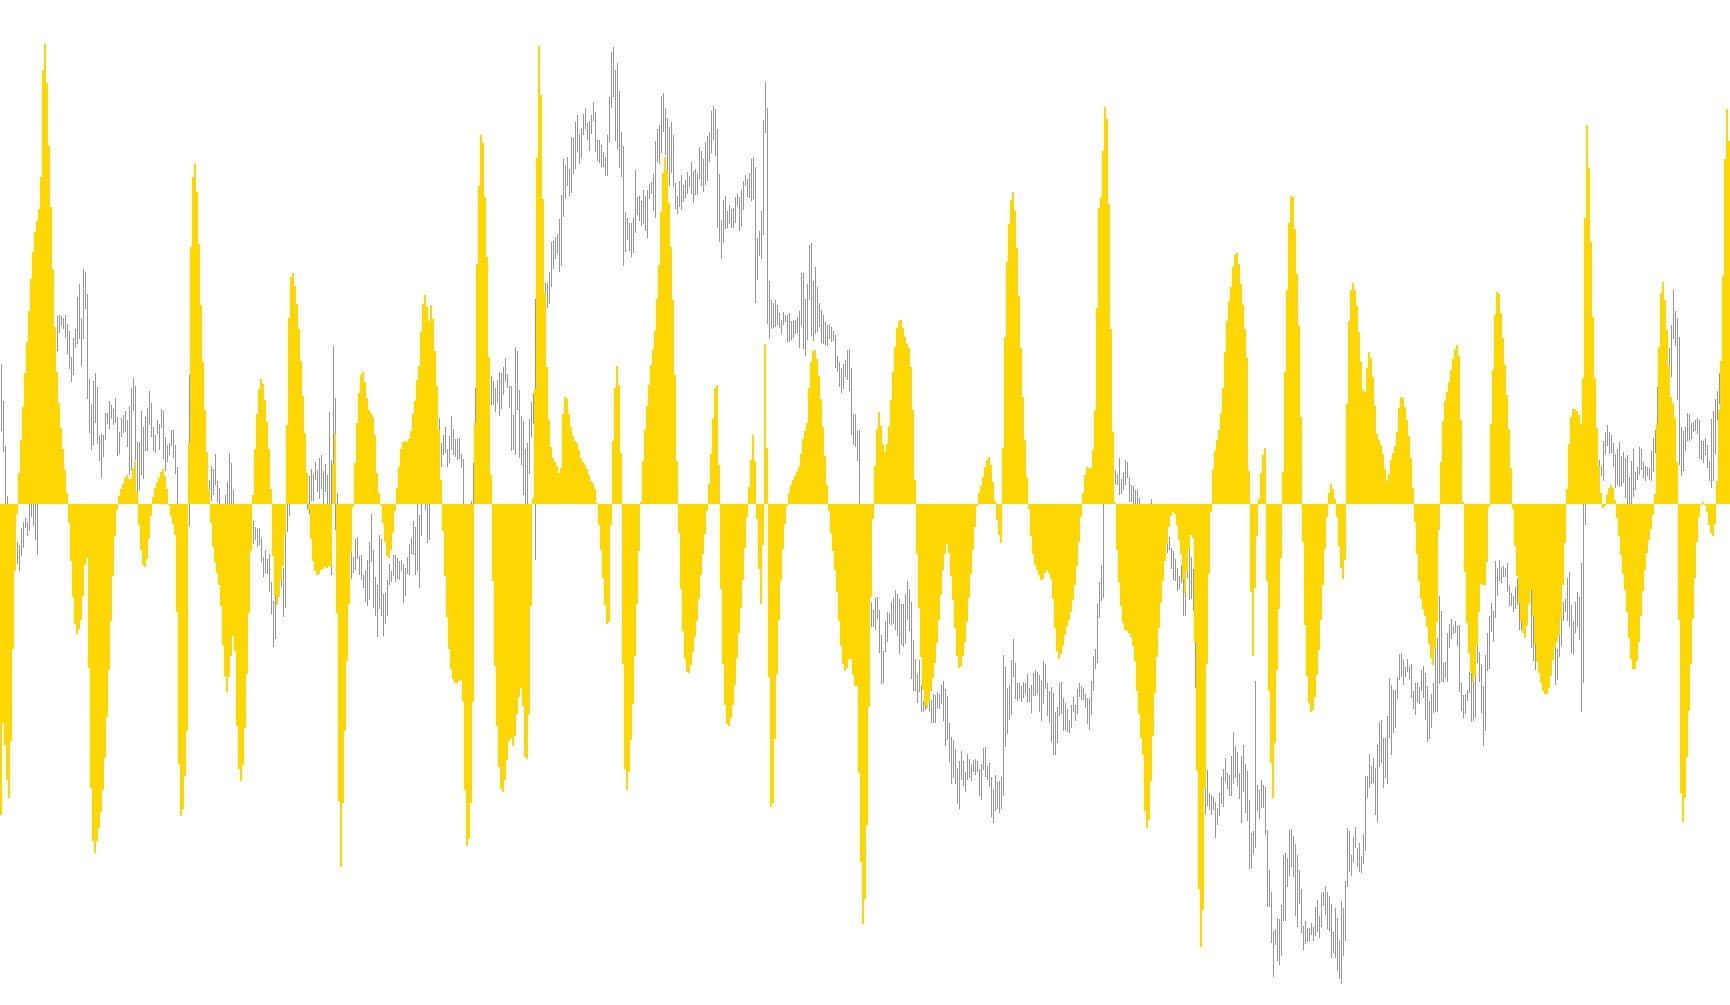
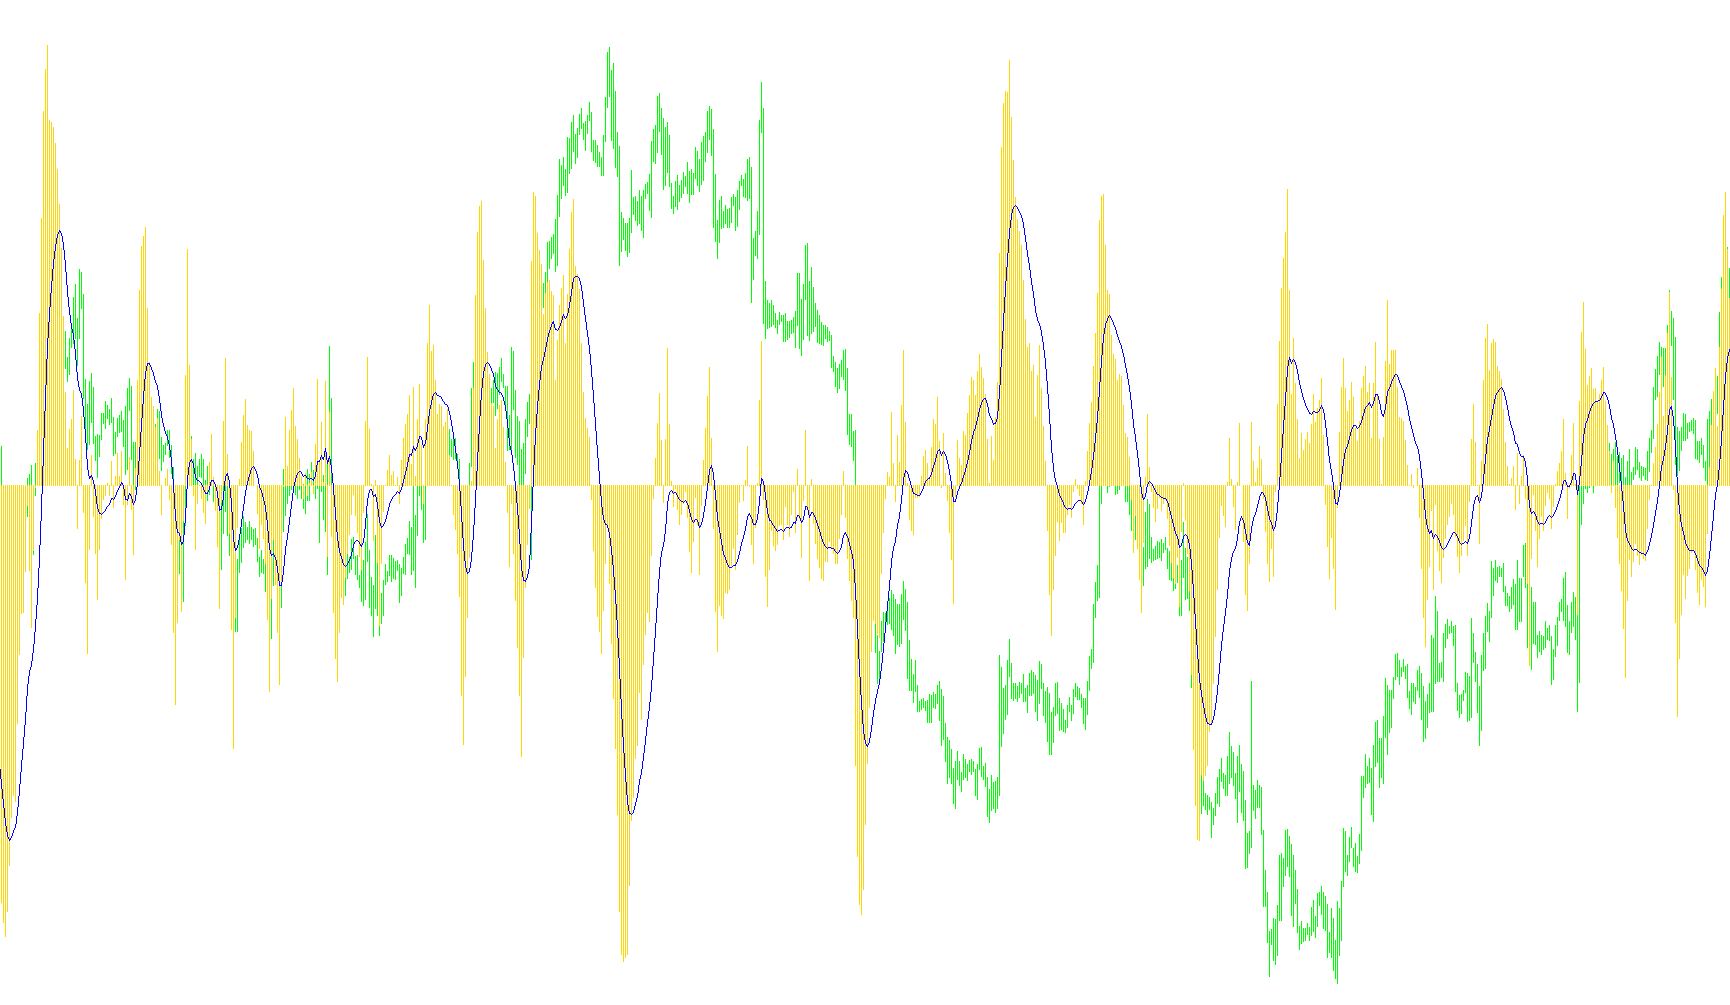
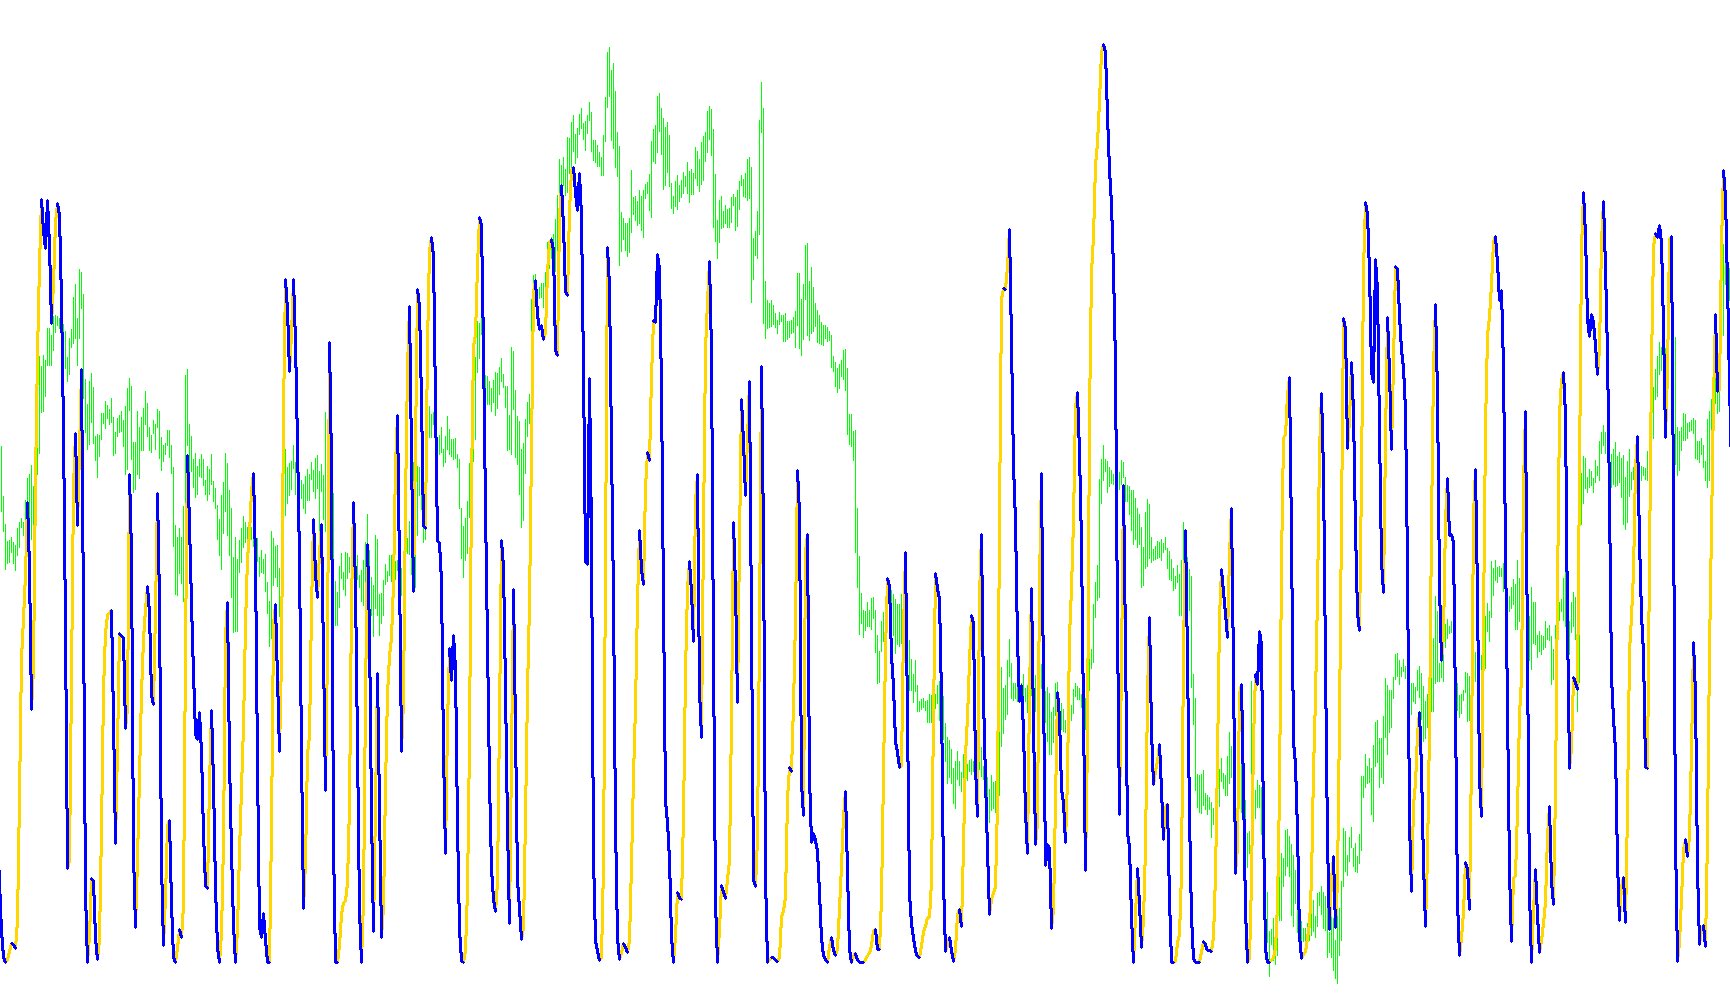
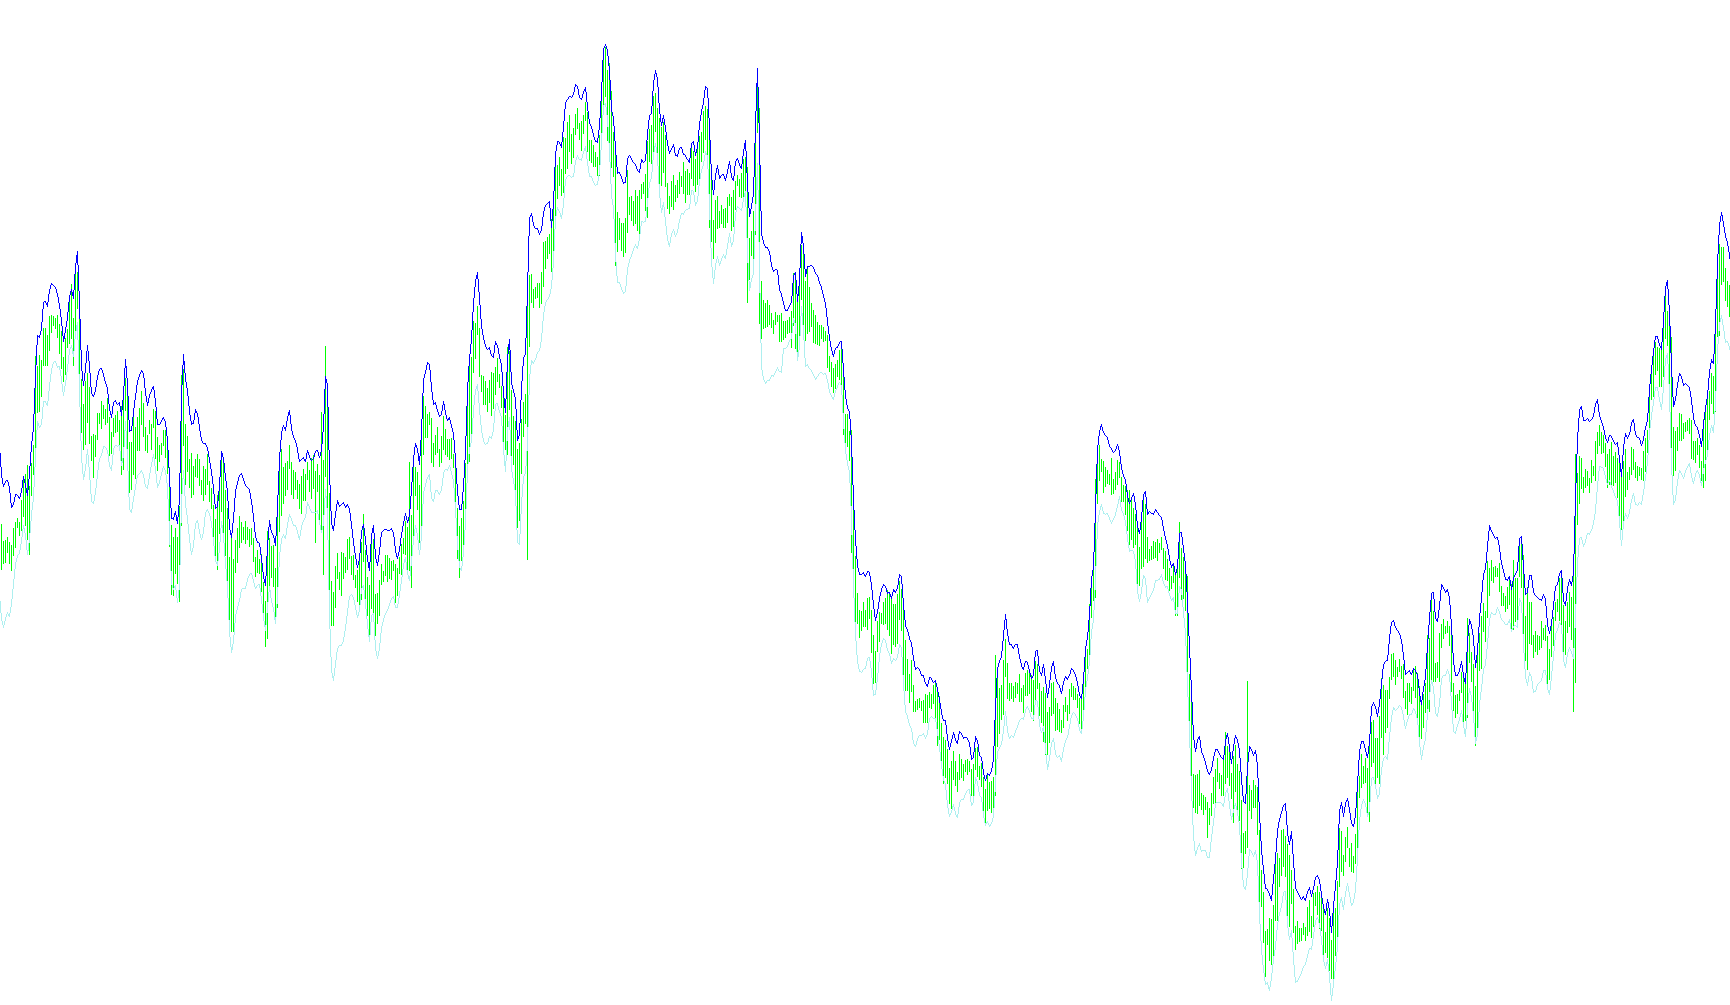
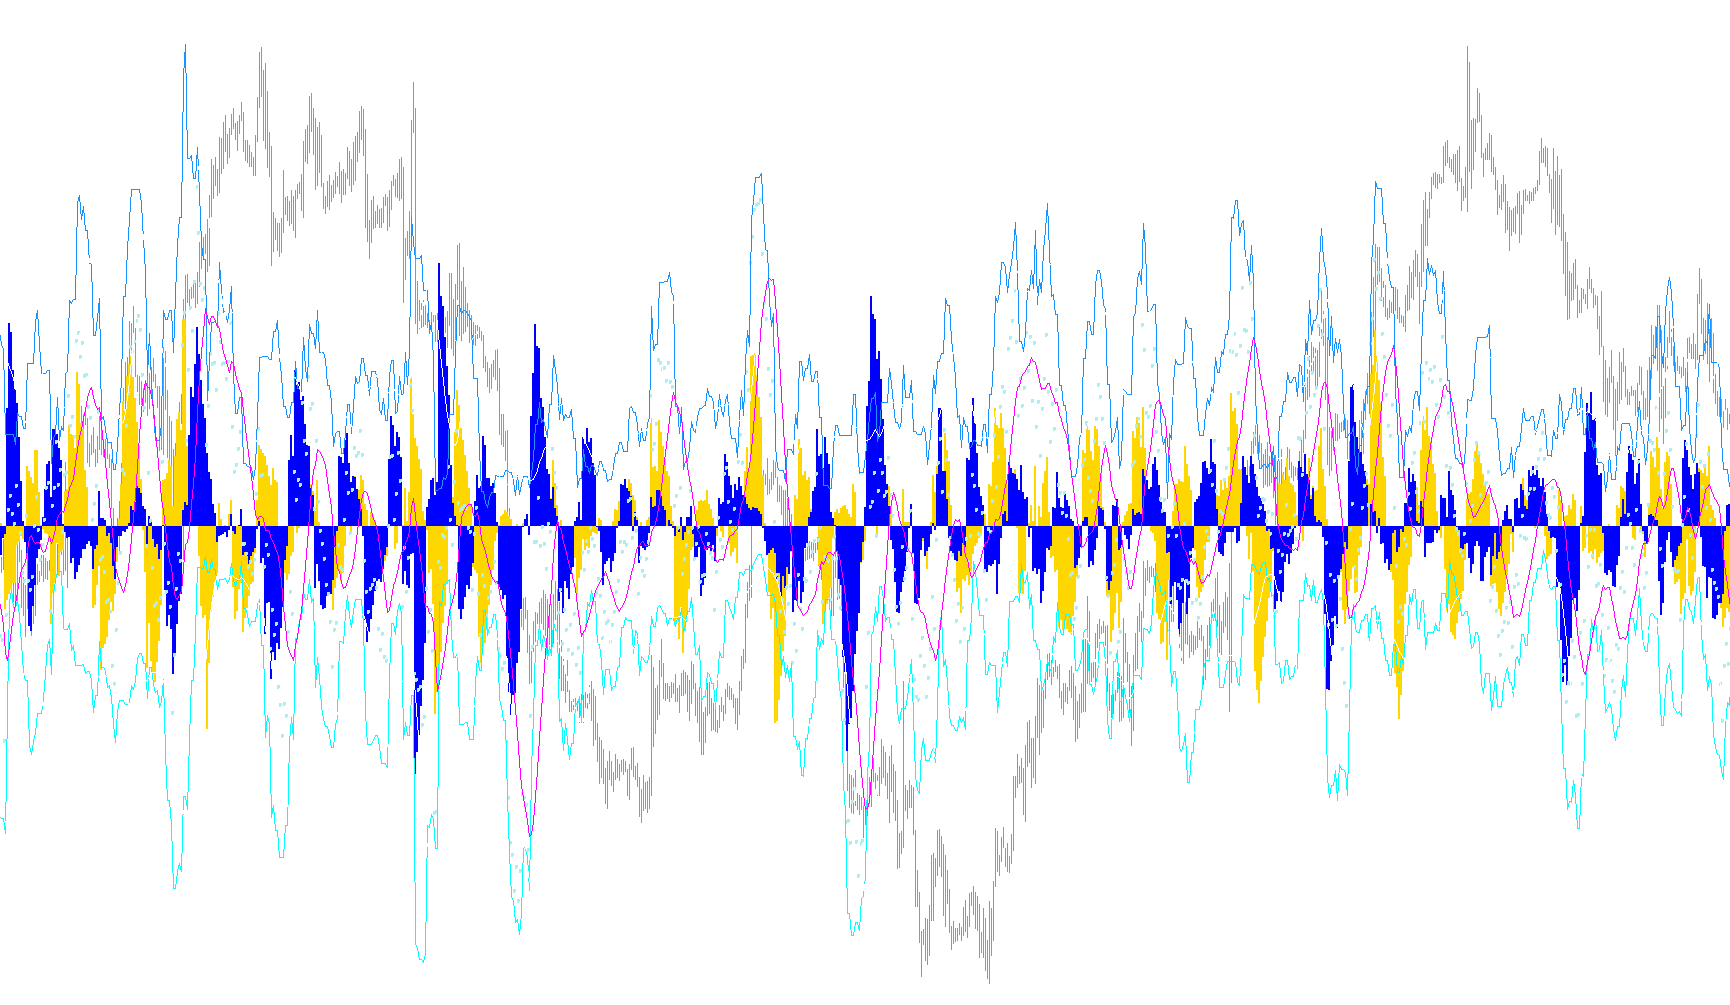
This indicator normalizes and synchronizes major currency performance into a unified 100-point scale to visualize relative strength and cross-currency divergence.

Indexes_v8L
Indicator

Indexes_v8L

iCCIOnArrayiMomentumOnArrayiMAOnArrayiRSIOnArray

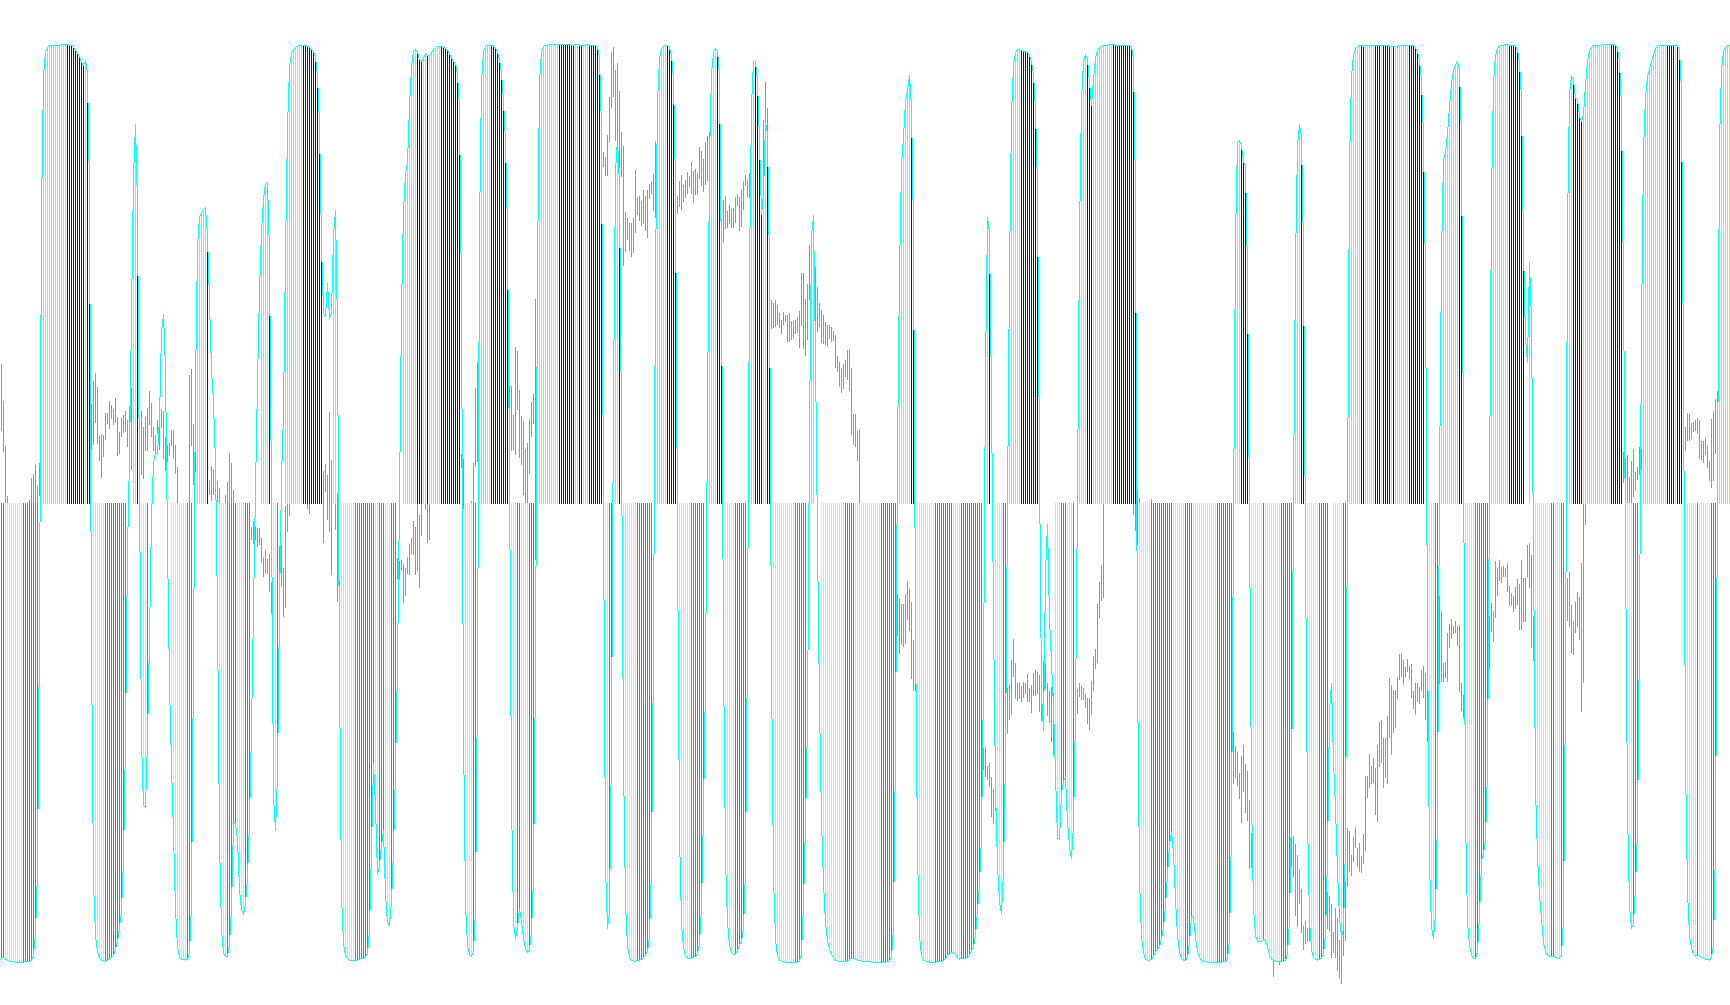
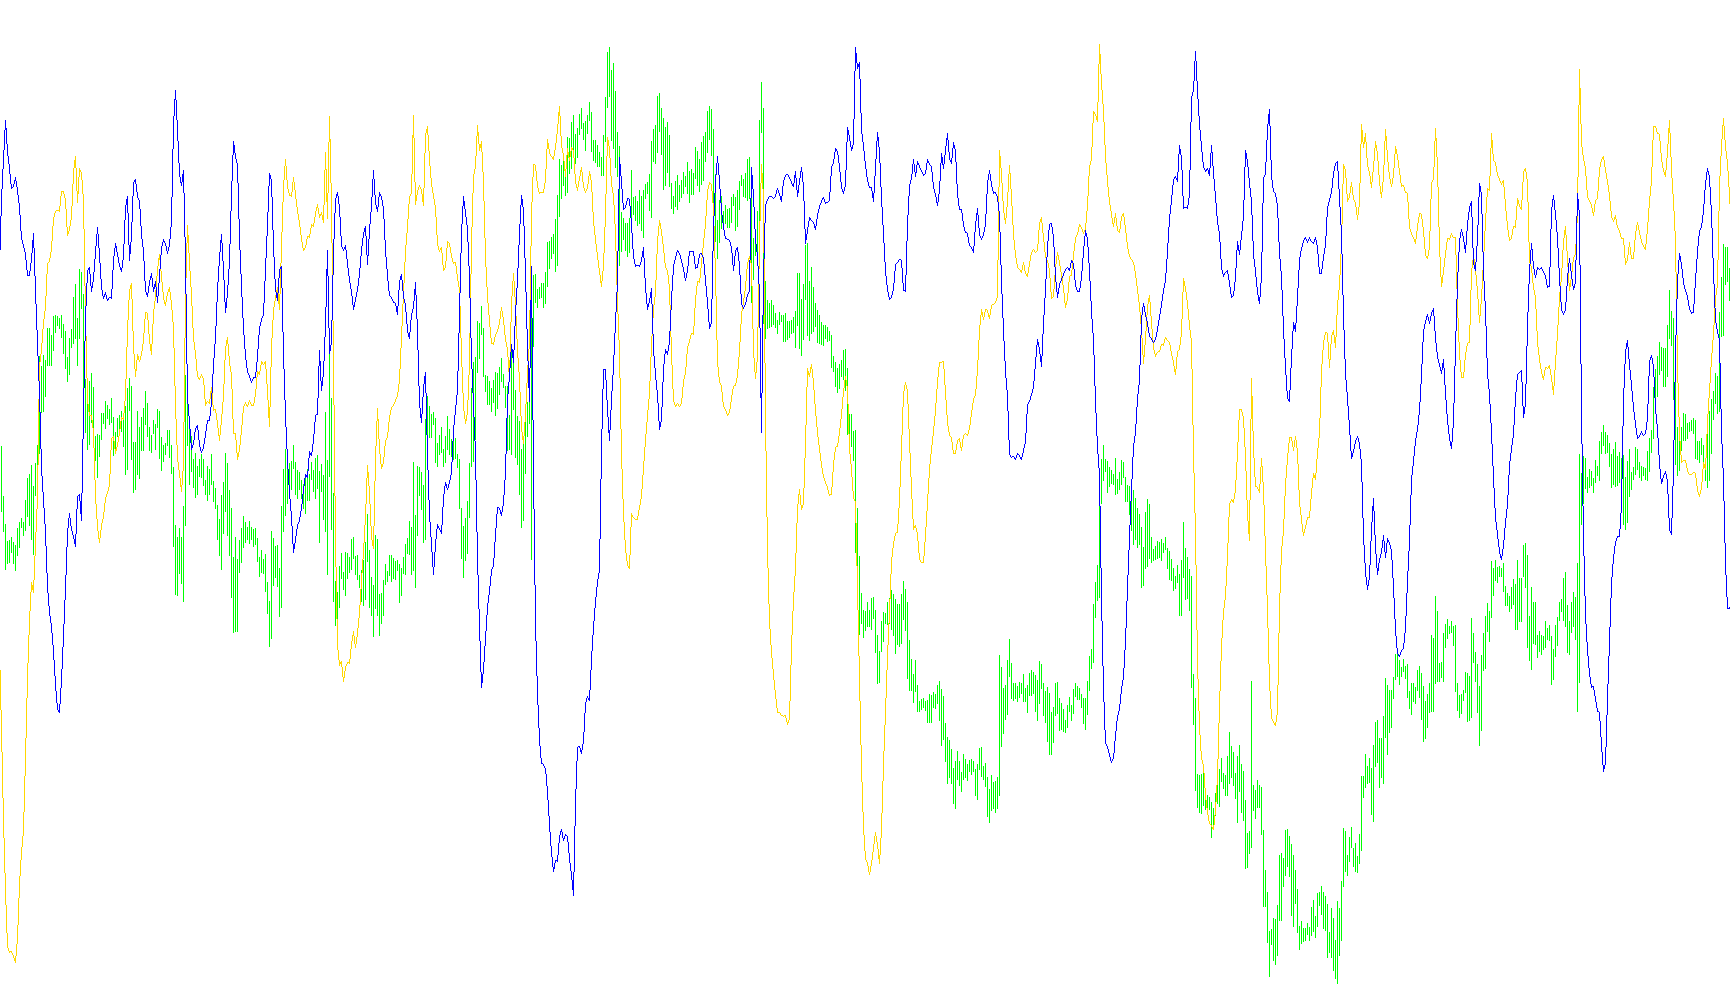
This indicator calculates and normalizes real-time performance indices for major global currencies, providing a unified comparative view of relative strength using customizable oscillators and moving averages.

Internal bar strength
Indicator

Internal bar strength

iMAOnArray

This indicator quantifies price action intensity by calculating the percentage position of the closing price relative to the high-low range and applying a smoothed moving average.

Inverse fisher transform of RSI
Indicator

Inverse fisher transform of RSI

iMAOnArrayiRSI

This indicator applies an exponential hyperbolic tangent transformation to a smoothed Relative Strength Index to normalize price momentum into a bounded range for clearer trend reversal detection.

Inverse fisher transform of Stochastic
Indicator

Inverse fisher transform of Stochastic

iMAOnArrayiStochastic

This indicator applies a hyperbolic tangent transformation to a smoothed stochastic mean to normalize momentum into a bounded range for precise trend reversal detection.

Inverse Fisher
Indicator

Inverse Fisher

iMAOnArrayiRSI

This indicator transforms normalized RSI data into a bounded momentum oscillator by applying a linear weighted moving average followed by a hyperbolic tangent function.

inverse_fisher_transform_of_Stochastic_
Indicator

inverse_fisher_transform_of_Stochastic_

iMAOnArrayiStochastic

This indicator applies an exponential hyperbolic tangent transformation to a smoothed stochastic oscillator to normalize price momentum into a distinct visual histogram.

i_DCG_ModStDev
Indicator

i_DCG_ModStDev

iMAOnArrayiStdDev

This indicator quantifies market volatility dynamics by calculating the divergence between multi-layered linear weighted moving averages of standard deviation values.

i_DCG_ModStDev_v1
Indicator

i_DCG_ModStDev_v1

iMAOnArrayiStdDev

This indicator quantifies market volatility momentum by calculating the differential between multi-layered linear weighted moving averages of standard deviation.

i_DCG_ModStDev_v2
Indicator

i_DCG_ModStDev_v2

iMAOnArrayiStdDev

This indicator calculates the momentum of market volatility by computing the differential between dual linearly weighted moving averages applied to standard deviation values, modulated by Fibonacci scaling factors.

JMA RSX_IFT
Indicator

JMA RSX_IFT

iMAOnArray

This indicator synthesizes a Jurik Moving Average and an RSX signal to generate a smoothed momentum oscillator designed for noise reduction and precise trend transition detection.

JMA_MACD [i]
Indicator

JMA_MACD [i]

iMAOnArray

This indicator quantifies price momentum by calculating the difference between two Jurik Moving Average periods and smoothing the resulting variance with a Simple Moving Average signal line.

JMA_MACD
Indicator

JMA_MACD

iMAOnArray

This indicator calculates the differential between two Jurik Moving Average (JMA) periods to identify momentum shifts, overlaid with a smoothed signal line for trend verification.

JMA_RSI_IFT
Indicator

JMA_RSI_IFT

iMAOnArrayiRSI

This indicator synthesizes a Jurik Moving Average with Relative Strength Index data to generate a non-lagging, hyper-smoothed momentum oscillator that maps cyclical price velocity.

Indicator

JoeChalhoub_FXForecasterV1

iMAOnArray
Kase CD Peak
Indicator

Kase CD Peak

iATRiMAOnArrayiStdDevOnArray

This indicator quantifies price action symmetry by normalizing high-low spreads against ATR and applying multi-stage smoothing to identify momentum shifts and volatility extremes.

KasePeakOscilator_v1
Indicator

KasePeakOscilator_v1

iATRiMAOnArrayiStdDevOnArray

This indicator identifies trend reversals by calculating a relative high-low variance normalized by volatility and filtering momentum shifts through moving average deviations.

KVO
Indicator

KVO

iMAOnArray

This indicator quantifies price momentum by calculating the difference between exponential moving averages of volume-weighted directional shifts derived from three-point price pivots.

Kwan
Indicator

Kwan

iMomentumiMAOnArrayiRSIiStochastic

This indicator synthesizes the product of Stochastic and RSI values normalized by Momentum to identify directional shifts via a smoothed moving average filter.

Kwan_indicator
Indicator

Kwan_indicator

iMomentumiMAOnArrayiRSIiStochastic

This indicator derives a synthetic momentum value by normalizing the product of Stochastic and RSI values against the Momentum oscillator, then applying a smoothing moving average to identify trend directional shifts.

LeManTrend
Indicator

LeManTrend

iMAOnArray

This indicator quantifies relative price volatility by calculating the cumulative deviation between current bar extremes and multi-period high/low peaks, smoothed via an exponential moving average.

linear-momentum
Indicator

linear-momentum

iMAOnArray

This indicator quantifies price movement intensity by calculating the rate of change of candle distance relative to time, weighted by tick volume and smoothed through an exponential moving average.

LWMA_ATR
Indicator

LWMA_ATR

iMAOnArray

This indicator calculates a linearly weighted moving average of the true range to quantify real-time market expansion and dynamic price variance.

LWMA_ATR_S
Indicator

LWMA_ATR_S

iMAOnArray

This indicator calculates a linearly weighted moving average of the Average True Range to quantify current market volatility and project a multi-factor price expansion zone.

MA-ATR
Indicator

MA-ATR

iATRiMAOnArray

This indicator projects a dynamic trading range by offsetting multiple moving average types with an ATR-based multiplier to visualize liquidity boundaries.

MA-ATR_v1
Indicator

MA-ATR_v1

iATRiMAOnArray

This indicator projects a multi-mode moving average dynamic corridor by expanding price boundaries using a calibrated Average True Range (ATR) multiplier and real-time bid-ask spreads.

MA-ATR_v2
Indicator

MA-ATR_v2

iATRiMAOnArray

This indicator projects a dual-boundary channel around a user-selectable moving average by applying an ATR-based multiplier to account for market volatility.

MA-ATR_v3
Indicator

MA-ATR_v3

iATRiMAOnArray

This indicator generates dynamic price bands by projecting a multi-method moving average forward and backward using a multiplier of the Average True Range to capture market volatility.

MA-ATR_v4
Indicator

MA-ATR_v4

iATRiMAOnArray

This indicator generates dynamic price boundaries by projecting an Average True Range (ATR) corridor around a customizable Moving Average base.

MA-Heikin
Indicator

MA-Heikin

iMAOnArray

This indicator calculates a smoothed average of historical price points and identifies directional shifts by filtering out neutral movements to highlight bullish and bearish momentum trends.

MACD_DEMA
Indicator

MACD_DEMA

iMAOnArray

This indicator calculates the momentum of price action by measuring the spread between two Double Exponential Moving Averages to reduce lag and heighten responsiveness.

MACD_FlatMarketDetector
Indicator

MACD_FlatMarketDetector

iMACDiMAOnArray

Identifies market stagnation by calculating the derivative of MACD median values and filtering volatility through an exponential smoothing gamma threshold.

MACD_LSMA
Indicator

MACD_LSMA

iMAOnArray

This indicator calculates the momentum by determining the difference between a fast and slow Least Squares Moving Average (LSMA) instead of traditional exponential averages.

MACD_LSMA_EMA
Indicator

MACD_LSMA_EMA

iMAOnArray

This indicator modifies the traditional Moving Average Convergence Divergence by substituting standard exponential averages with Least Squares Moving Averages to calculate momentum and signal lines.

MACD_TEMA
Indicator

MACD_TEMA

iMAOnArray

This indicator calculates momentum by computing the difference between two Triple Exponential Moving Averages (TEMA) and overlaying an exponential signal line to identify trend reversals.

maf_2
Indicator

maf_2

iMAOnArray

This indicator calculates price velocity using a normalized range position and transforms it via a logarithmic scale to identify trend exhaustion and momentum reversals.

MarketWay
Indicator

MarketWay

iMAOnArray

This indicator quantifies market force by calculating the variance between real-time bullish and bearish price accumulation against their respective simple moving averages.

Mass_Index
Indicator

Mass_Index

iMAOnArray

This indicator calculates the smoothed ratio of price range fluctuations by applying nested exponential moving averages to high-low spreads, then normalizing the result through a simple moving average multiplier.

MAVolumeWithJMA
Indicator

MAVolumeWithJMA

iMAOnArray

This indicator analyzes market activity by comparing real-time volume against multiple moving average types, specifically featuring a Jurik Moving Average (JMA) for ultra-smooth trend identification and a percentage-based filter level to identify high-intensity liquidity spikes.

ma_AMA_optimized_rosh
Indicator

ma_AMA_optimized_rosh

iMAOnArray

This indicator utilizes a modified Adaptive Moving Average (AMA) that adjusts its smoothing factor based on the ratio of price efficiency to volatility, complemented by a standard deviation filter for trend detection.

MA_of_RSX
Indicator

MA_of_RSX

iMAOnArray

This indicator calculates a smoothed RSX momentum value and identifies trend reversals by detecting crossovers between the primary RSX line and its customizable moving average signal.

MA_RSI
Indicator

MA_RSI

iMAOnArrayiRSI

This indicator applies a moving average filter over the Relative Strength Index values to eliminate high-frequency noise and identify underlying trend momentum.

MBA
Indicator

MBA

iMACDiMomentumiRSIiStochastic

This indicator derives a multi-factor signal by normalizing the sum of MACD and RSI against momentum, weighted by stochastic values, and then filters the resulting trajectory to highlight directional shifts.

MBA_Thesis_Indicator_ok
Indicator

MBA_Thesis_Indicator_ok

iMACDiMomentumiRSIiStochastic

This indicator calculates a multi-factor composite value by multiplying Stochastic values with the sum of MACD and RSI, normalized by Momentum, then applying a directional SMA smoothing filter.

MBA_Thesis_Indicator_ok_v1
Indicator

MBA_Thesis_Indicator_ok_v1

iMACDiMomentumiRSIiStochastic

The indicator calculates a composite oscillator by normalizing the sum of MACD and RSI values against Momentum, then applies a Moving Average to identify directional trend shifts.

Median+ATRm
Indicator

Median+ATRm

iMAOnArray

This indicator calculates a central median price between period highs and lows, establishing an upper and lower boundary based on a volatility-adjusted ATR multiplier to visualize market range.

Median
Indicator

Median

iMAOnArray

This indicator constructs a dynamic trading corridor by calculating the midpoint of local price extremes and expanding it using a multiplier of the Average True Range.

Median_v1
Indicator

Median_v1

iMAOnArray

This indicator constructs a volatility-adjusted pricing envelope by calculating the midpoint between local price extremes and projecting an upper and lower boundary based on a multiplier of the Average True Range.

MFI_MACD_mtf
Indicator

MFI_MACD_mtf

iMFIiMAOnArray

This indicator calculates the differential between two Money Flow Index (MFI) periods across higher timeframes and applies a Simple Moving Average to smooth the resulting momentum signal.

MFI_OsWAD_macdosma4c
Indicator

MFI_OsWAD_macdosma4c

iMFIiMAOnArray

This indicator synthesizes Money Flow Index (MFI) dynamics with an oscillating momentum filter to identify directional shifts in volume-weighted price velocity.