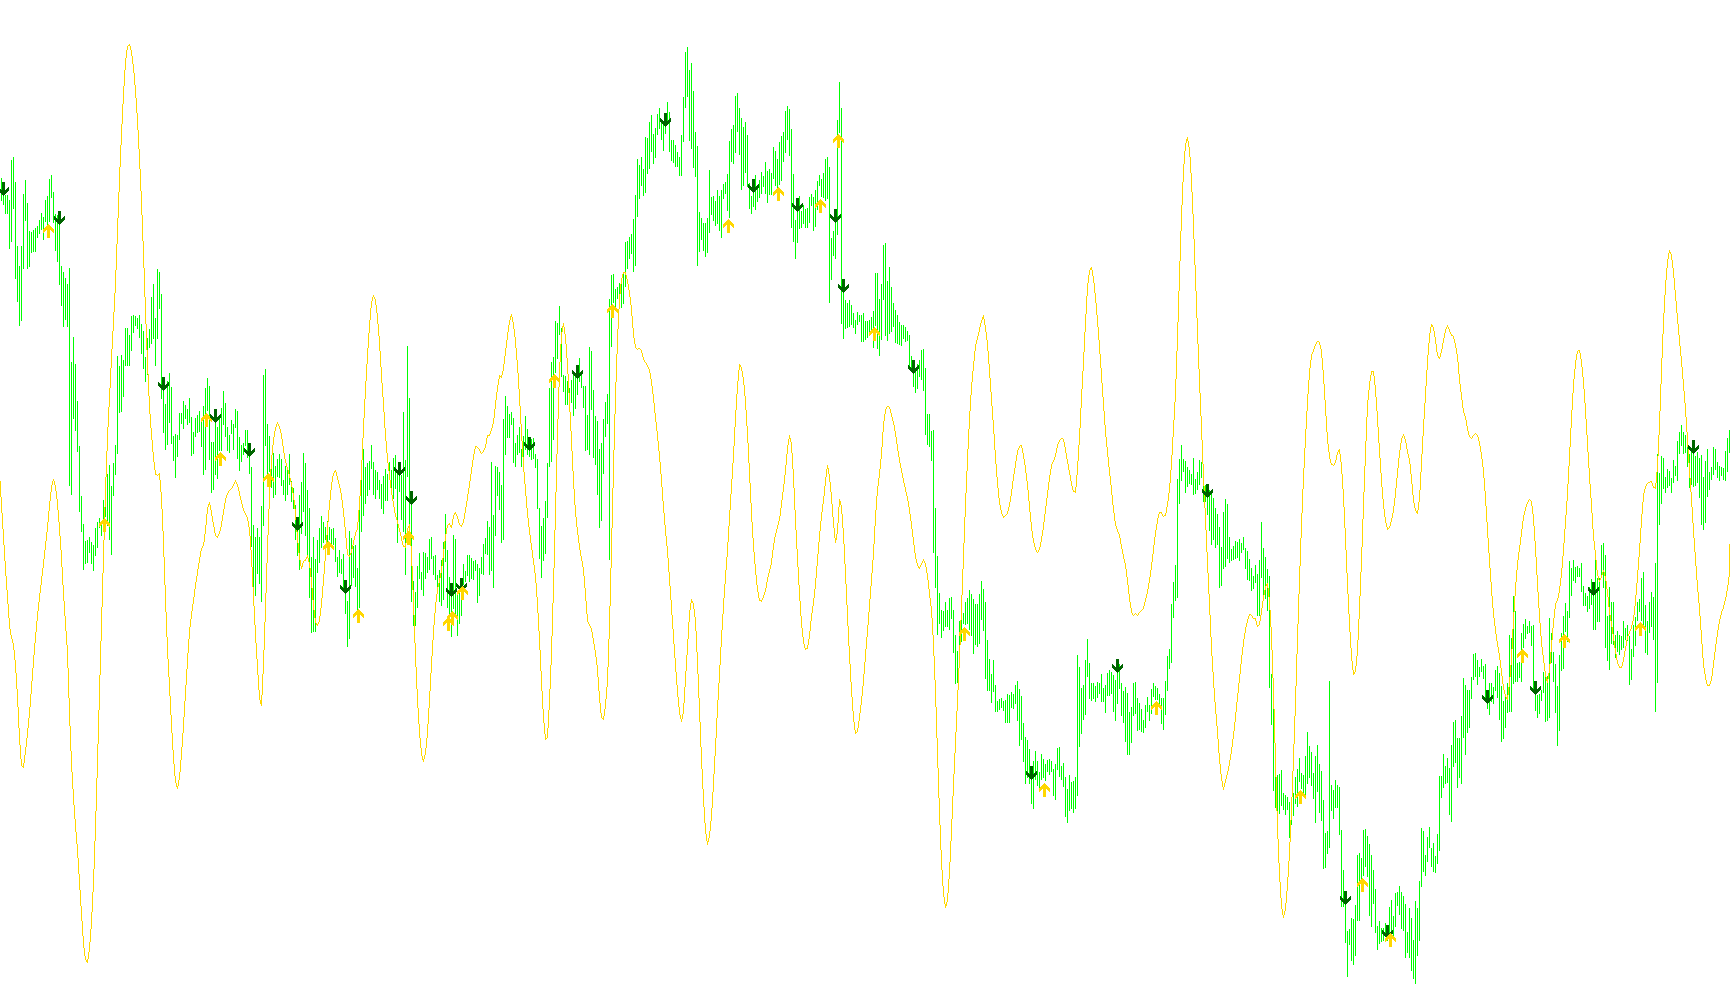
CCI_TriggerBars
Indicator

CCI_TriggerBars

iCCIiMAOnArray

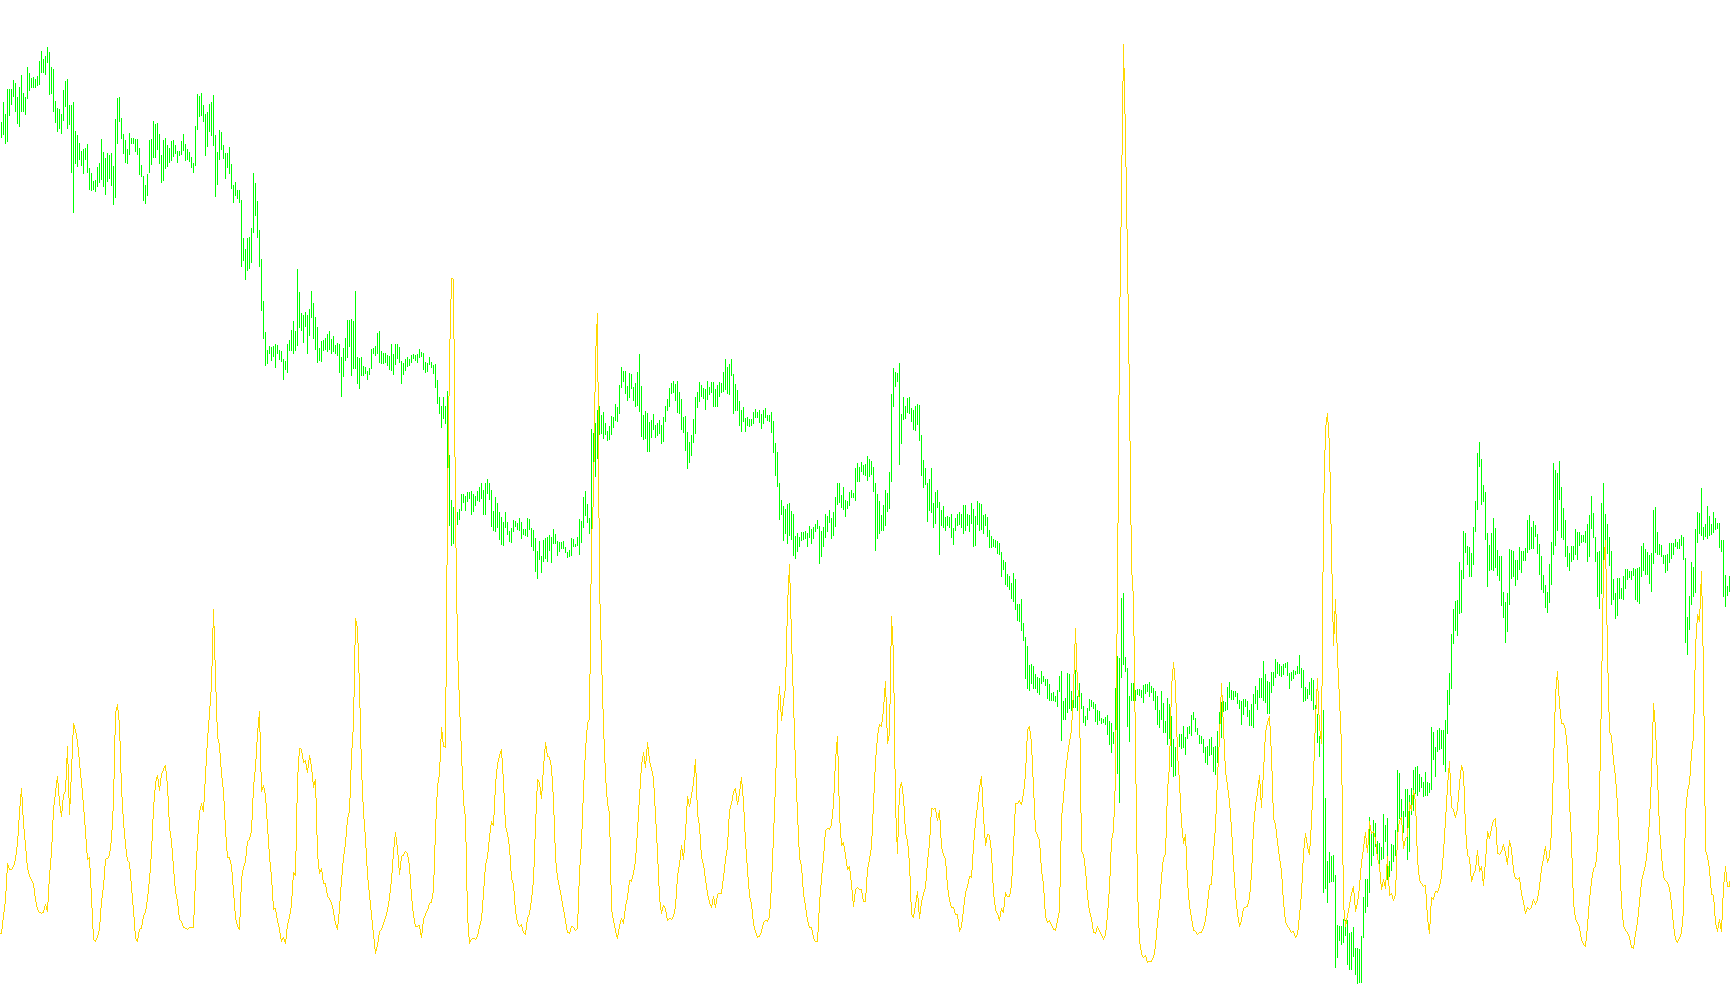
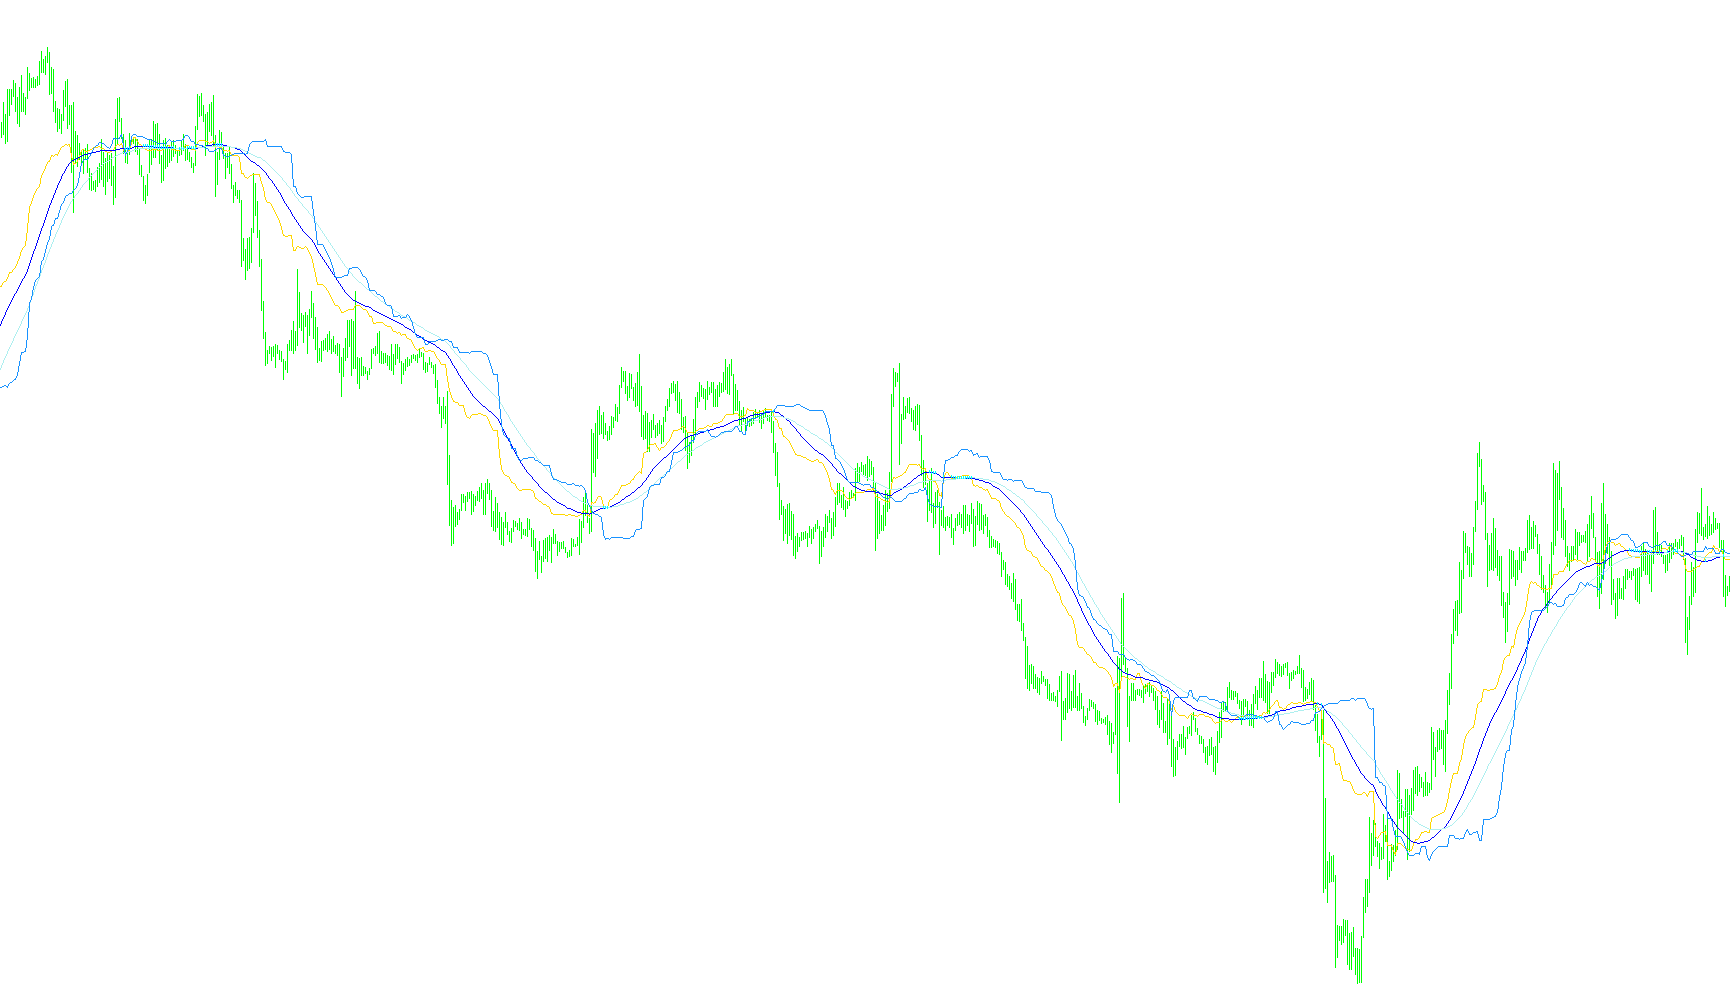
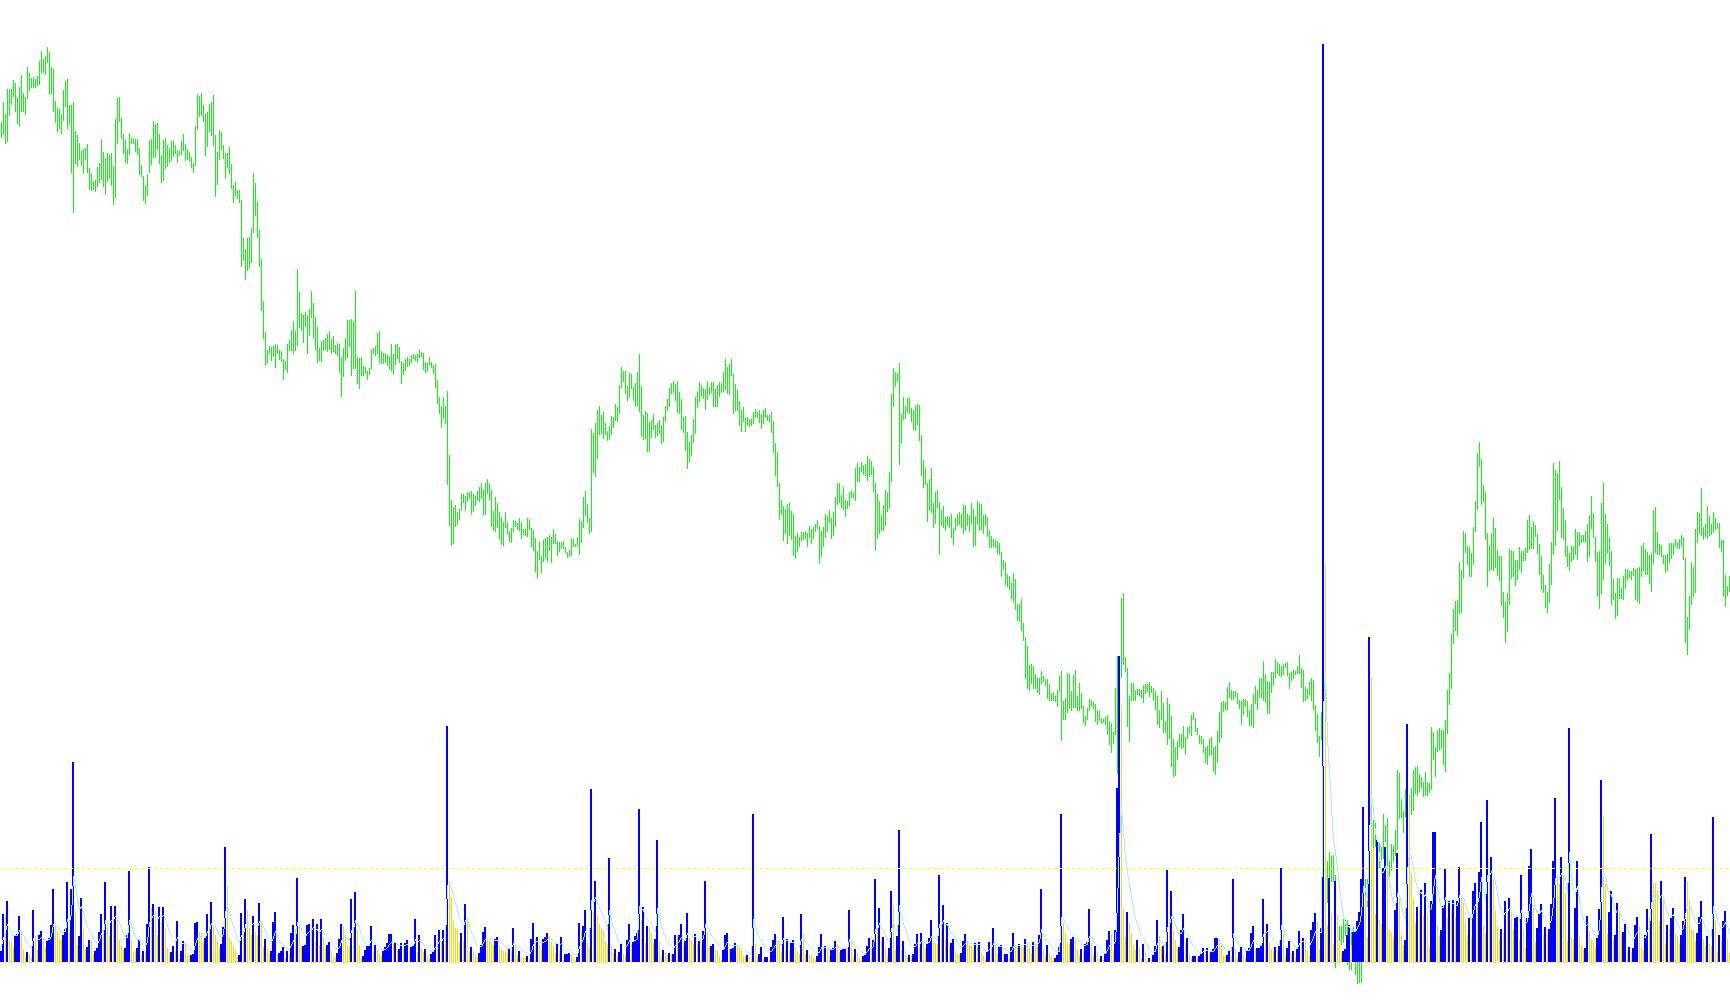
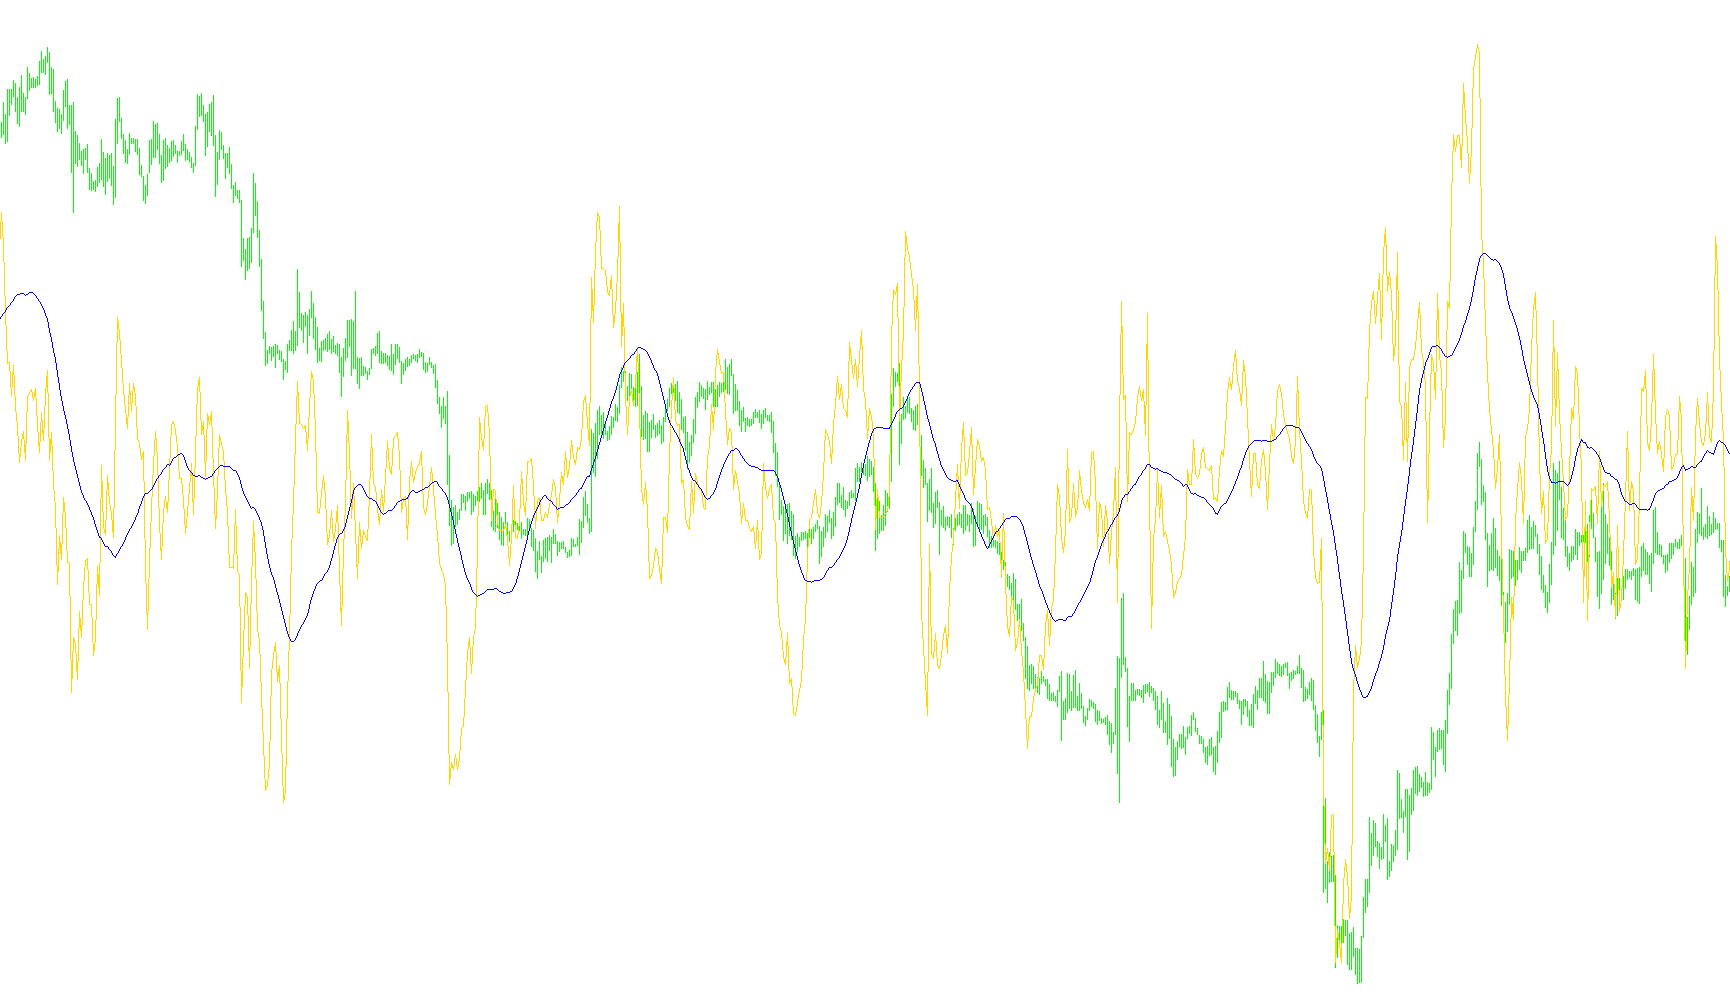
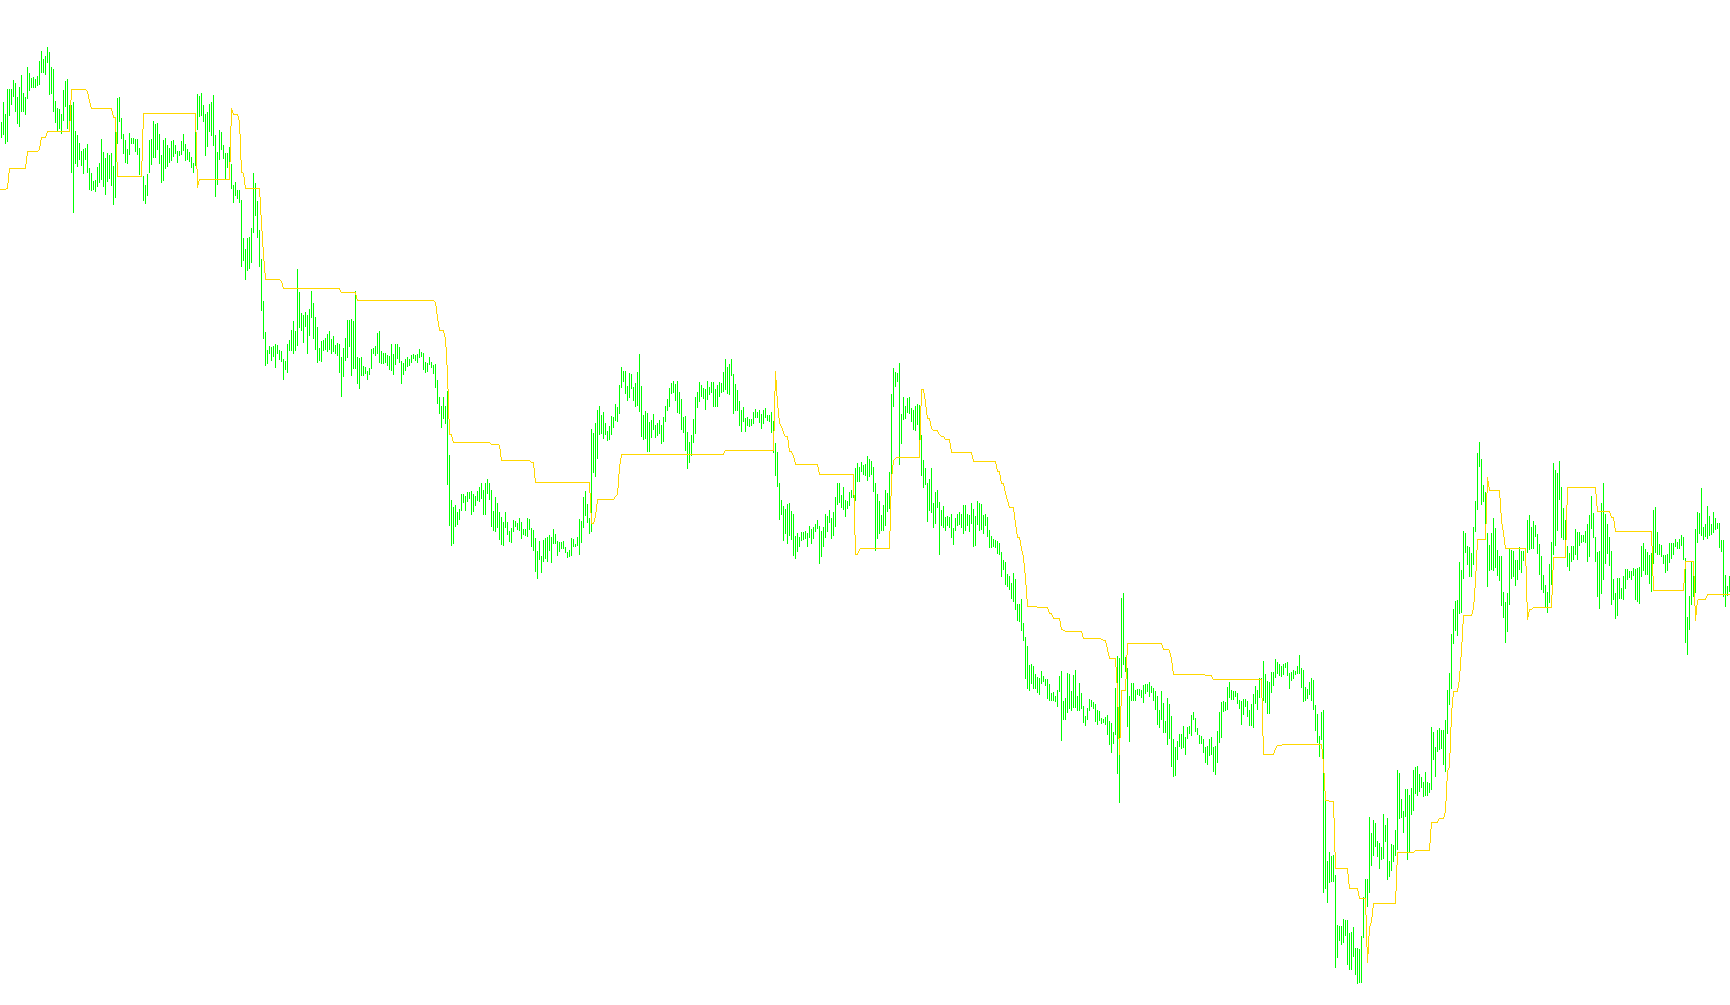
This indicator identifies trend reversals by evaluating the crossover between a Smoothed Moving Average (SMMA) and a Linear Weighted Moving Average (LWMA) applied to the Commodity Channel Index.

cdrvolatility
Indicator

cdrvolatility

iMAOnArray

This indicator quantifies market momentum by calculating the SMA of price deviations from a specific opening reference point, distinguishing between expansionary and contractionary movement relative to a user-defined delta threshold.

Chaikin's Volatility (2 lines)
Indicator

Chaikin's Volatility (2 lines)

iMAOnArray

This indicator calculates the percentage rate of change between dual smoothed exponential moving averages of price range expansion to identify momentum shifts.

Chaikin's Volatility (2 lines)_v2
Indicator

Chaikin's Volatility (2 lines)_v2

iMAOnArray

This indicator measures relative price expansion by calculating the percentage divergence between fast and slow exponential moving averages of the bar range.

Chaikin's Volatility StochasticM2
Indicator

Chaikin's Volatility StochasticM2

iMAOnArray

This indicator calculates a smoothed stochastic percentage based on the exponential moving average of price range fluctuations to identify momentum within volatility shifts.

Chaikin's Volatility(1)
Indicator

Chaikin's Volatility(1)

iMAOnArray

This indicator calculates the percentage rate of change between the Exponential Moving Average of price ranges over specific lookback periods.

Chaikin's Volatility_v1
Indicator

Chaikin's Volatility_v1

iMAOnArray

This indicator quantifies the relative rate of change in price range expansion by calculating the percentage deviation of an exponential moving average of high-low differentials over a specific lookback period.

Chaikin's Volatility_v2
Indicator

Chaikin's Volatility_v2

iMAOnArray

This indicator quantifies relative price range expansion by calculating the percentage rate of change between exponential moving averages of high-low spreads.

Chaikin
Indicator

Chaikin

iMAOnArrayiOBV

The algorithm calculates the distance between the raw On-Balance Volume and its long-term moving average to identify trend momentum.

ChandeQStik_v1
Indicator

ChandeQStik_v1

iMAOnArray

This indicator quantifies price action volatility by applying a moving average to the difference between closing and opening prices to identify directional trend shifts.

ChandeQStik_v1_001
Indicator

ChandeQStik_v1_001

iMAOnArray

This indicator calculates a moving average of the daily price range differences to visualize momentum direction and velocity through dual-colored histograms.

ChandeQStik_v1_002
Indicator

ChandeQStik_v1_002

iMAOnArray

This indicator calculates a moving average of the price action delta to visualize directional momentum shifts through distinct bullish and bearish histograms.

CHO
Indicator

CHO

iADiMAOnArray
CHV
Indicator

CHV

iMAOnArray

This indicator quantifies the percentage rate of change between smoothed price range extremes to identify accelerating volatility shifts.

Cronex DeMarker
Indicator

Cronex DeMarker

iDeMarkeriMAOnArray

This indicator applies nested Linear Weighted Moving Averages over a DeMarker oscillator to filter noise and identify trend shifts in momentum.

Cronex DeMarker_v1
Indicator

Cronex DeMarker_v1

iDeMarkeriMAOnArray

This indicator identifies trend reversals by applying dual linear weighted moving averages to the DeMarker momentum values to filter market noise.

Cronex T Taichi GF
Indicator

Cronex T Taichi GF

iIchimokuiMAOnArray
Cronex Taichi
Indicator

Cronex Taichi

iIchimokuiMAOnArray
Cronex Taichi_003
Indicator

Cronex Taichi_003

iIchimokuiMAOnArray
CS-MAofVol-w-Voluometer
Indicator

CS-MAofVol-w-Voluometer

iMAOnArray

This indicator analyzes volume dynamics by calculating multiple moving averages with an automated intensity filter and a real-time velocity ratio to identify accelerating or decelerating market activity.

DayImplus 1.1
Indicator

DayImplus 1.1

iMAOnArray

This indicator calculates the cumulative sum of price discrepancies between opening and closing prices over a rolling window, applying an optional smoothing average to identify momentum shifts.

DayImplus 1.1_v1
Indicator

DayImplus 1.1_v1

iMAOnArray

Quantifies historical price action by aggregating the cumulative difference between opening and closing prices over a defined period to identify directional bias.

DayImpulse2DD
Indicator

DayImpulse2DD

iMAOnArray

This indicator quantifies cumulative price displacement over a defined lookback period and projects the resulting aggregate momentum forward to visualize potential trend trajectory.

DayImpulse2DD_v1
Indicator

DayImpulse2DD_v1

iMAOnArray

This indicator quantifies cumulative price momentum by aggregating historical candle body ranges and projecting the resulting aggregate value forward into a predefined offset.

DayImpulse2DD_v2
Indicator

DayImpulse2DD_v2

iMAOnArray

This indicator calculates the aggregate price movement over a specific period and projects it forward to visualize potential momentum trends.

DECEMA
Indicator

DECEMA

iMAOnArray

The indicator calculates a complex weighted sum of nested exponential moving averages derived from an underlying custom signal to identify momentum shifts.

DECEMA_v2
Indicator

DECEMA_v2

iMAOnArray

This indicator calculates a complex weighted harmonic signal by applying nested exponential moving averages to external custom data points.

delta-stop
Indicator

delta-stop

iATRiMAOnArray

The indicator calculates a dynamic price floor or ceiling by applying a multiplier to smoothed Average True Range volatility to track structural price shifts.

DeMarker
Indicator

DeMarker

iMAOnArray

This indicator quantifies price action momentum by calculating the normalized ratio between cumulative upward and downward price fluctuations over a specific period.

dex_RSIndex
Indicator

dex_RSIndex

iMAOnArrayiRSIOnArray

This indicator calculates and visualizes the smoothed RSI values of synthetic currency indices derived from a proprietary weighted cross-calculation of USD, GBP, EUR, CHF, and JPY price actions.

dex_SolarWind
Indicator

dex_SolarWind

iMAOnArray

The algorithm calculates a normalized price position relative to the highest highs and lowest lows of a set period, applying an exponential smoothing weight and a logarithmic transformation to isolate momentum shifts.

Indicator

DigBollingerBands

iMAOnArray
DoubleCCI-With_EMA
Indicator

DoubleCCI-With_EMA

iCCIiMAOnArray

This indicator analyzes momentum by correlating a long-period Trend CCI with a short-period Entry CCI, utilizing an optional Exponential Moving Average and multi-timeframe adaptive period scaling to identify simultaneous directional shifts.

DoubleCCI-With_EMA_v1
Indicator

DoubleCCI-With_EMA_v1

iCCIiMAOnArray

This indicator synchronizes a fast and slow Commodity Channel Index (CCI) to visualize momentum trends while providing an optional Exponential Moving Average filter for smoothed signal analysis.

DoubleCCI-With_SMAvbobslowVK
Indicator

DoubleCCI-With_SMAvbobslowVK

iCCIiMAOnArray

This indicator identifies trend momentum by correlating two separate Commodity Channel Index (CCI) periods with dynamic SMA smoothing and automated timeframe optimization.

DoubleCCI-With_SMAvbobslowVK_WithCrossAlert
Indicator

DoubleCCI-With_SMAvbobslowVK_WithCrossAlert

iCCIiMAOnArray

This indicator identifies market momentum by synchronizing dual-period Commodity Channel Index (CCI) values with a Simple Moving Average crossover and automated timeframe optimization.

DoubleCCI_With_EMA_Email
Indicator

DoubleCCI_With_EMA_Email

iCCIiMAOnArray

This indicator identifies trend direction and potential entry points by analyzing the divergence between a long-period Trend CCI and a short-period Entry CCI, complemented by optional EMA smoothing and multi-timeframe adaptive logic.

Indicator

DTosc_mtf_

iMAOnArrayiRSI
Indicator

DTosc_yb_mtf_

iMAOnArrayiRSI
DTS-Monta§a
Indicator

DTS-Monta§a

iMAOnArray

This indicator identifies trend reversals by applying a logarithmic transformation to normalized price positions relative to local high-low extremes.

DynamicRS
Indicator

DynamicRS

iMAOnArray

The logic identifies structural supply and demand zones by capturing extreme price pivots triggered by the momentum crossover of a weighted average price basis against its simple moving average.

DynamicRS_v1
Indicator

DynamicRS_v1

iMAOnArray

This indicator identifies structural price boundaries by capturing historical extremes at the precise moment weighted price momentum crosses its moving average.

Dynamo Stochastic
Indicator

Dynamo Stochastic

iMAOnArray

This indicator synthesizes a standard stochastic oscillator with a unique 'Dynamo' calculation that measures the relative variance between the main %K line and its moving average signal against a central equilibrium.

Dynamo Stochastic_v1
Indicator

Dynamo Stochastic_v1

iMAOnArray

This indicator calculates a modified stochastic momentum by blending the %K line and its simple moving average signal against a 50-point equilibrium axis.

ECO
Indicator

ECO

iMAOnArray

This indicator calculates a normalized ratio between smoothed price action (Open-Close) and volatility (High-Low) to identify trend momentum and exhaustion points.

ECO_v1
Indicator

ECO_v1

iMAOnArray

This indicator quantifies relative price momentum by calculating the ratio of nested moving averages of candle bodies against their total ranges to identify overextended market behavior.

EES V Speed v1.1
Indicator

EES V Speed v1.1

iMAOnArray

This indicator calculates a smoothed moving average of the price range per point to quantify and visualize market expansion speed.

EMAOsMA
Indicator

EMAOsMA

iOsMAiMAOnArray
EMAOsMA_v1
Indicator

EMAOsMA_v1

iOsMAiMAOnArray
EMAOsMA_v2
Indicator

EMAOsMA_v2

iOsMAiMAOnArray