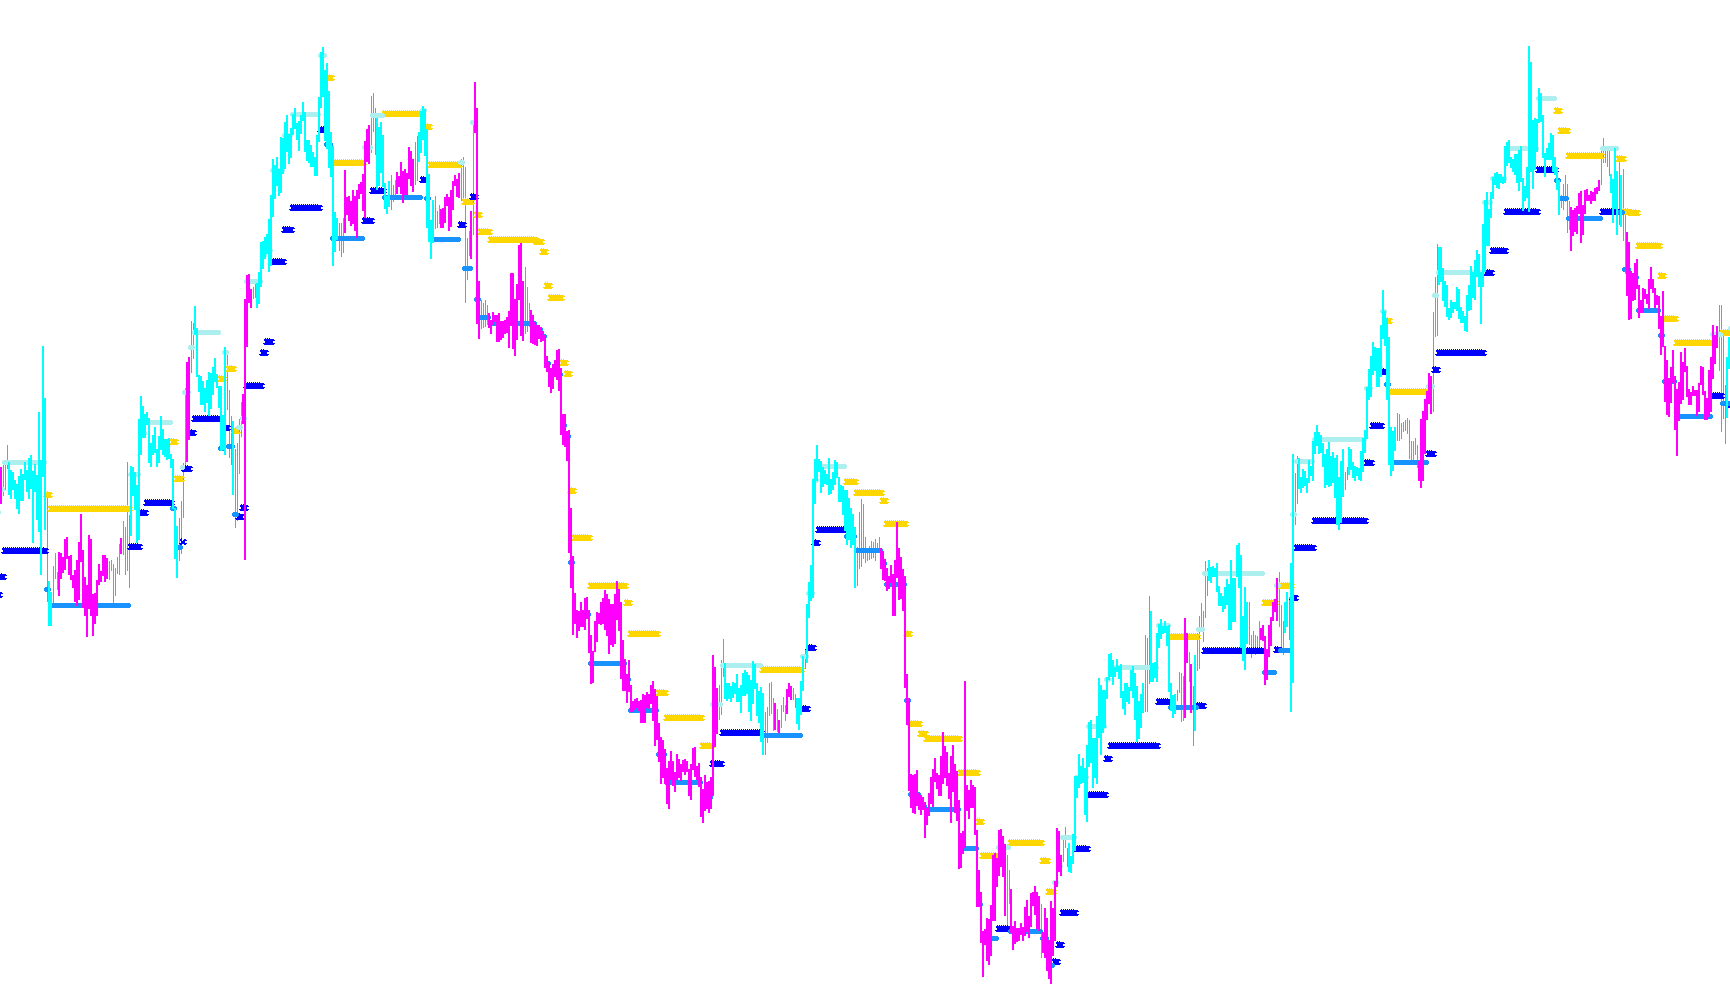
NonLag_ATR_v2
Indicator

NonLag_ATR_v2

iATRiMAOnArray

This indicator calculates a non-lagging moving average of Average True Range values using a trigonometric weight distribution to identify trend shifts and volatility momentum.

NonLag_ATR_v3
Indicator

NonLag_ATR_v3

iATRiMAOnArray

This indicator calculates a weighted average of Average True Range values using a non-lagging mathematical coefficient to identify momentum shifts and trend reversals.

nr4id-atr_761
Indicator

nr4id-atr_761

iATR

The logic identifies internal bar patterns where the price action is contained within previous highs and lows, specifically signaling a reversal or consolidation point when the current Average True Range reaches a local minimum over a defined historical lookback.

NRTR Gator
Indicator

NRTR Gator

iAlligatoriATR

This indicator combines NRTR (Nick Rypock Trailing Reverse) with the Alligator indicator to generate buy/sell signals based on trend reversals and volatility-adjusted price levels.

NRTR Rosh v2
Indicator

NRTR Rosh v2

iATR

This indicator identifies trend reversals and volatility-adjusted support/resistance levels by monitoring price breaches relative to ATR-based dynamic buffers.

NRTR Rosh v2_v1
Indicator

NRTR Rosh v2_v1

iATR

This indicator identifies trend shifts and volatility-adjusted price levels by monitoring structural breaks relative to ATR-based dynamic buffers.

NRTR Rosh v2_v2
Indicator

NRTR Rosh v2_v2

iATR

This indicator detects structural market shifts by monitoring price breaches against volatility-adjusted ceiling and floor levels derived from the Average True Range.

NRTR Rosh v2_v3
Indicator

NRTR Rosh v2_v3

iATR

This indicator identifies trend shifts by monitoring price breaches of volatility-adjusted ceilings and floors derived from Average True Range dynamics.

NRTR Rosh
Indicator

NRTR Rosh

iATR

This indicator identifies market directional shifts by dynamically recalculating support and resistance levels based on Average True Range volatility to signal trend reversals.

NRTR_ATR_STOP
Indicator

NRTR_ATR_STOP

iATR

This indicator dynamically plots trailing support and resistance levels based on a multiplier of the Average True Range to identify structural pivots and trend reversals.

NRTR_ATR_STOP_v1
Indicator

NRTR_ATR_STOP_v1

iATR

This indicator dynamically plots trailing support and resistance levels based on ATR volatility to identify trend reversals and breakout shifts.

Indicator

NRTR_Rosh_v2eAlert_mtf

iATR
Indicator

NRTR_Rosh_v2e_mtf[1]

iATR
OBTR
Indicator

OBTR

iATRiMAOnArray

This indicator calculates a cumulative true range value that adjusts dynamically based on price direction, applying dual moving averages to identify trend exhaustion and momentum shifts.

Indicator

OnChart MFI

iATRiMA
Indicator

OnChart Rsi

iATRiMAiRSI
Indicator

OnChart Rsi[1]

iATRiMAiRSI
Indicator

OnChart Rsi_001

iATRiMAiRSI
Indicator

OnChart Rsi_v1

iATRiMAiRSI
Indicator

OnChart Stochastic

iATRiMAiStochastic
Indicator

OnChart Stochastic_v1

iATRiMAiStochastic
Indicator

OnChart_Stochastic_Channel_(FL_MTF)

iATRiMAiStochastic
Indicator

OnChart_Stochastic_Channel_3TFx3

iATRiMAiStochastic
OzFx Signals v1.2
Indicator

OzFx Signals v1.2

iACiATRiMAiStochastic

This indicator scans a custom list of currency pairs to identify high-probability long and short entries by synchronizing Awesome Oscillator momentum shifts, Stochastic oscillator crossovers, and SMA trend filtering.

OzFx Signals v1.7
Indicator

OzFx Signals v1.7

iACiAOiATRiStochastic

A multi-currency dashboard that concurrently processes Awesome Oscillator, Stochastic, and ATR metrics across multiple timeframes to identify synchronized momentum shifts and volatility breakouts.

OzFx Signals v1.7_v1
Indicator

OzFx Signals v1.7_v1

iACiAOiATRiStochastic

This multi-currency dashboard identifies bullish and bearish opportunities by synchronizing Awesome Oscillator reversals, Stochastic momentum thresholds, and SMA trend filters across multiple pairs simultaneously.

OzFX smD1 iLines v4
Indicator

OzFX smD1 iLines v4

iACiATRiStochastic

This indicator projects dynamic profit targets and stop-loss levels based on combined Stochastic momentum and AC Oscillator trend filters, featuring built-in performance statistics.

OzFX smD1 iSignals v4
Indicator

OzFX smD1 iSignals v4

iACiATRiMAiStochastic

This indicator synthesizes momentum from the Awesome Oscillator, Stochastic oscillators, and moving averages to trigger three distinct entry methodologies: standard trend confirmation, AES volatility logic, and swing point detection.

PA IO detection v2
Indicator

PA IO detection v2

iATRiMAOnArray

This indicator identifies specific candlestick formations by filtering for inside bars, nested multi-bar contractions, and high-momentum outside bars based on ATR-adjusted price ranges.

pairsindex
Indicator

pairsindex

iCCIiATRiMAiMAOnArray
PA_adaptive_MACD
Indicator

PA_adaptive_MACD

iATR

This indicator calculates the difference between two Hilbert-transformed Exponential Moving Averages to identify momentum shifts, utilizing quantile and floating thresholds to signal trend reversals and pullbacks.

PipNailer iSignals_v2
Indicator

PipNailer iSignals_v2

iACiAOiATRiSAR

This indicator identifies high-probability trade entries by detecting simultaneous directional flips across the Parabolic SAR, Awesome Oscillator, and Awesome Chart filters.

PIPQInd
Indicator

PIPQInd

iATR

This indicator identifies trend reversals and momentum shifts by tracking price action relative to a dynamic trailing stop level adjusted by ATR volatility.

PIPQInd_SLTSm
Indicator

PIPQInd_SLTSm

iATR

This indicator identifies trend reversals by tracking a dynamic trailing stop level and generating visual alerts when price action breaches established support or resistance boundaries combined with ATR-based volatility filters.

PIPQInd_v1
Indicator

PIPQInd_v1

iATR

This indicator identifies potential trend reversals by monitoring price breaches of a volatility-adjusted trailing stop level integrated with ATR-based expansion zones.

PIPQInd_v2
Indicator

PIPQInd_v2

iATR

This indicator identifies trend reversals by tracking a dynamic price boundary that adjusts based on volatility-adjusted pip offsets and historical price pivots.

Indicator

precentualzz_victor-mtf

iATR
Pretty_t3_LK_V1.2
Indicator

Pretty_t3_LK_V1.2

iATRiMA

This indicator calculates a high-order smoothing moving average using the Tim Tillson T3 algorithm, augmented by an Inverse Fisher Transform of the rate of change normalized by ATR to determine dynamic trend momentum.

Pretty_t3_LK_V1.3
Indicator

Pretty_t3_LK_V1.3

iATRiMA

This indicator calculates a high-order smoothed moving average using the Tillson T3 algorithm combined with a Fisher Transform filter to visualize trend velocity and momentum intensity via dynamic color shifting.

PriceChannel_Signal_v1
Indicator

PriceChannel_Signal_v1

iATRiMA

This indicator identifies trend reversals and momentum continuations by monitoring price breaches of volatility-adjusted upper and lower boundaries based on high/low extremes.

RAVI FX Fisher
Indicator

RAVI FX Fisher

iATRiMA

This indicator calculates a normalized momentum value by scaling the difference between two Linear Weighted Moving Averages against their respective ATR volatility, optionally applying an Inverse Fibonacci Transform for smoother trend identification.

RAVI FX Fisher2
Indicator

RAVI FX Fisher2

iATRiMA

This indicator transforms the spread between two Linear Weighted Moving Averages into a hyperbolic tangent function to normalize price momentum and volatility into an oscillatory range.

RAVI FX Fisher2_v1
Indicator

RAVI FX Fisher2_v1

iATRiMA

This indicator quantifies price velocity by calculating the exponential transformation of linear weighted moving average differentials normalized against volatility.

RAVI FX Fisher_001
Indicator

RAVI FX Fisher_001

iATRiMA

This indicator quantifies price velocity by calculating the normalized difference between fast and slow linear weighted moving averages, optionally applying a hyperbolic tangent transformation to stabilize extreme variance.

RAVI FX Fisher_v1
Indicator

RAVI FX Fisher_v1

iATRiMA

This indicator quantifies price momentum by calculating the normalized variance between two linear weighted moving averages adjusted by Average True Range volatility.

RAVI FX Fisher_v2
Indicator

RAVI FX Fisher_v2

iATRiMA

This indicator calculates a normalized momentum value by processing the relative distance between fast and slow linear weighted moving averages adjusted by volatility, then maps it onto a hyperbolic tangent curve.

RAVI FX Fisher_v3
Indicator

RAVI FX Fisher_v3

iATRiMA

This indicator normalizes the distance between two linear weighted moving averages relative to volatility, then applies a hyperbolic tangent transformation to map momentum into a bounded range.

RAVI FX Fisher_v4
Indicator

RAVI FX Fisher_v4

iATRiMA

This indicator quantifies price velocity by normalizing the spread between a fast and slow linear weighted moving average against their respective average true ranges, mapped through a hyperbolic tangent function.

RAVI FX Fisher_v5
Indicator

RAVI FX Fisher_v5

iATRiMA

This indicator quantifies relative price velocity by normalizing the spread between linear weighted moving averages against average true range volatility and mapping the result onto a hyperbolic tangent curve.

RAVI FX
Indicator

RAVI FX

iATRiMA

This indicator transforms the normalized price momentum between two linear weighted moving averages into a bounded distribution to identify trend extremes.