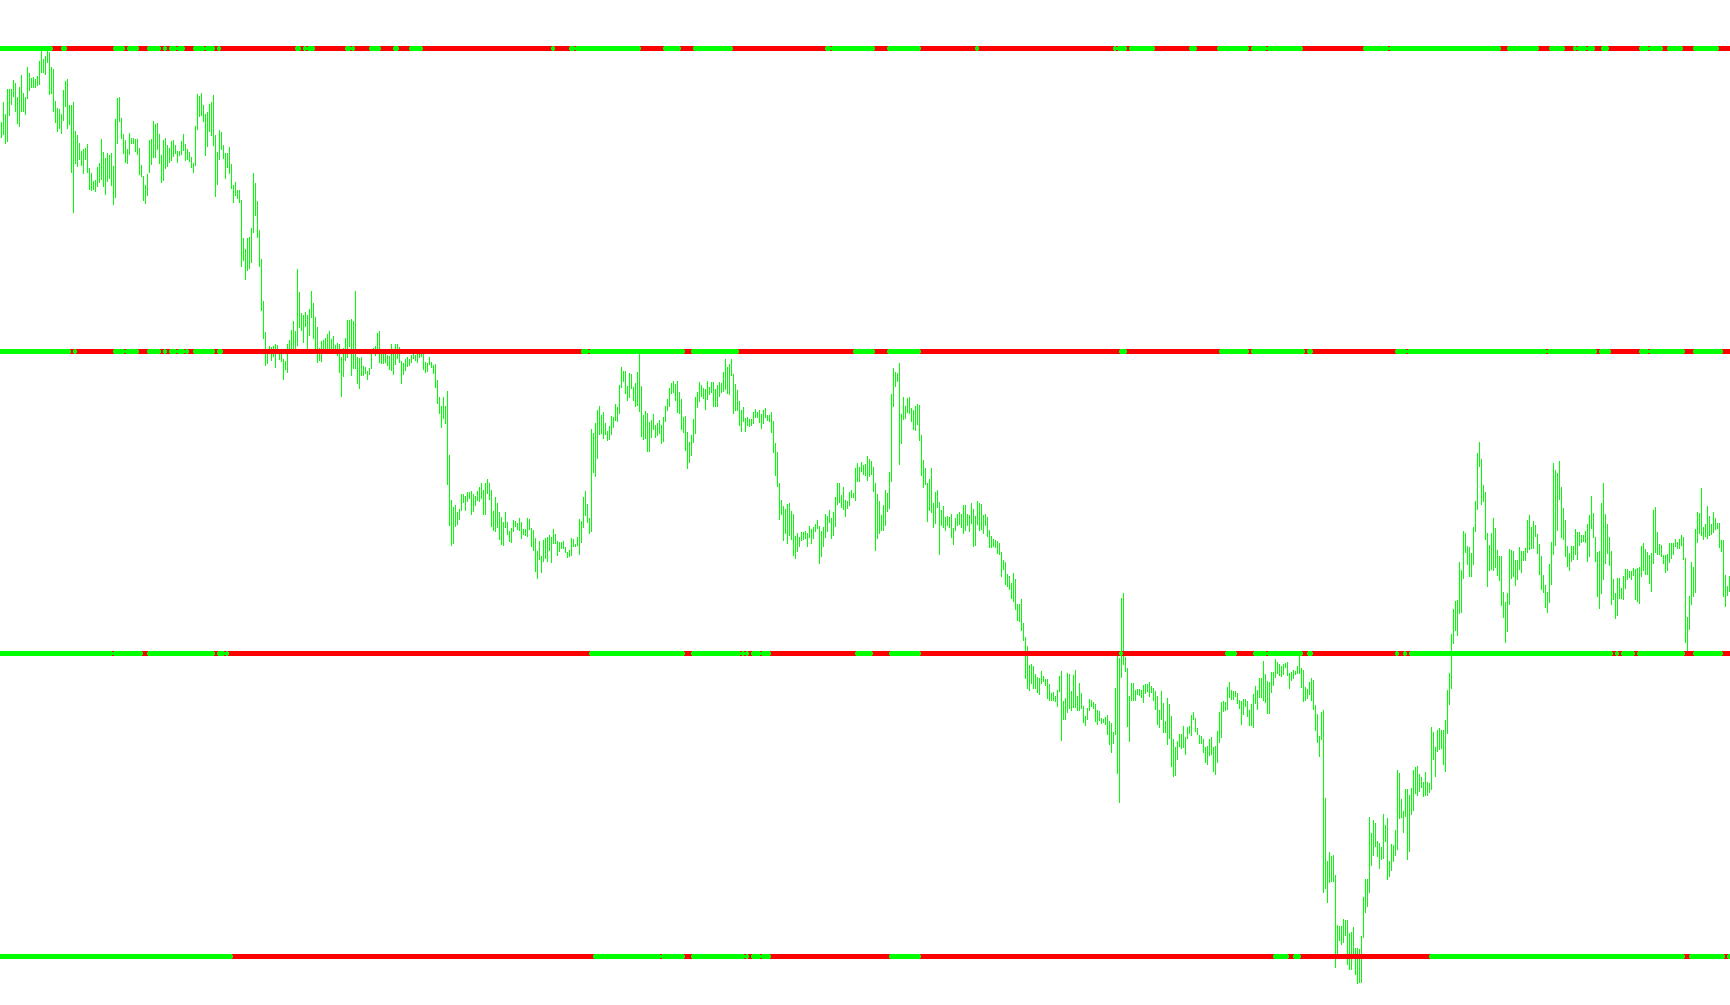
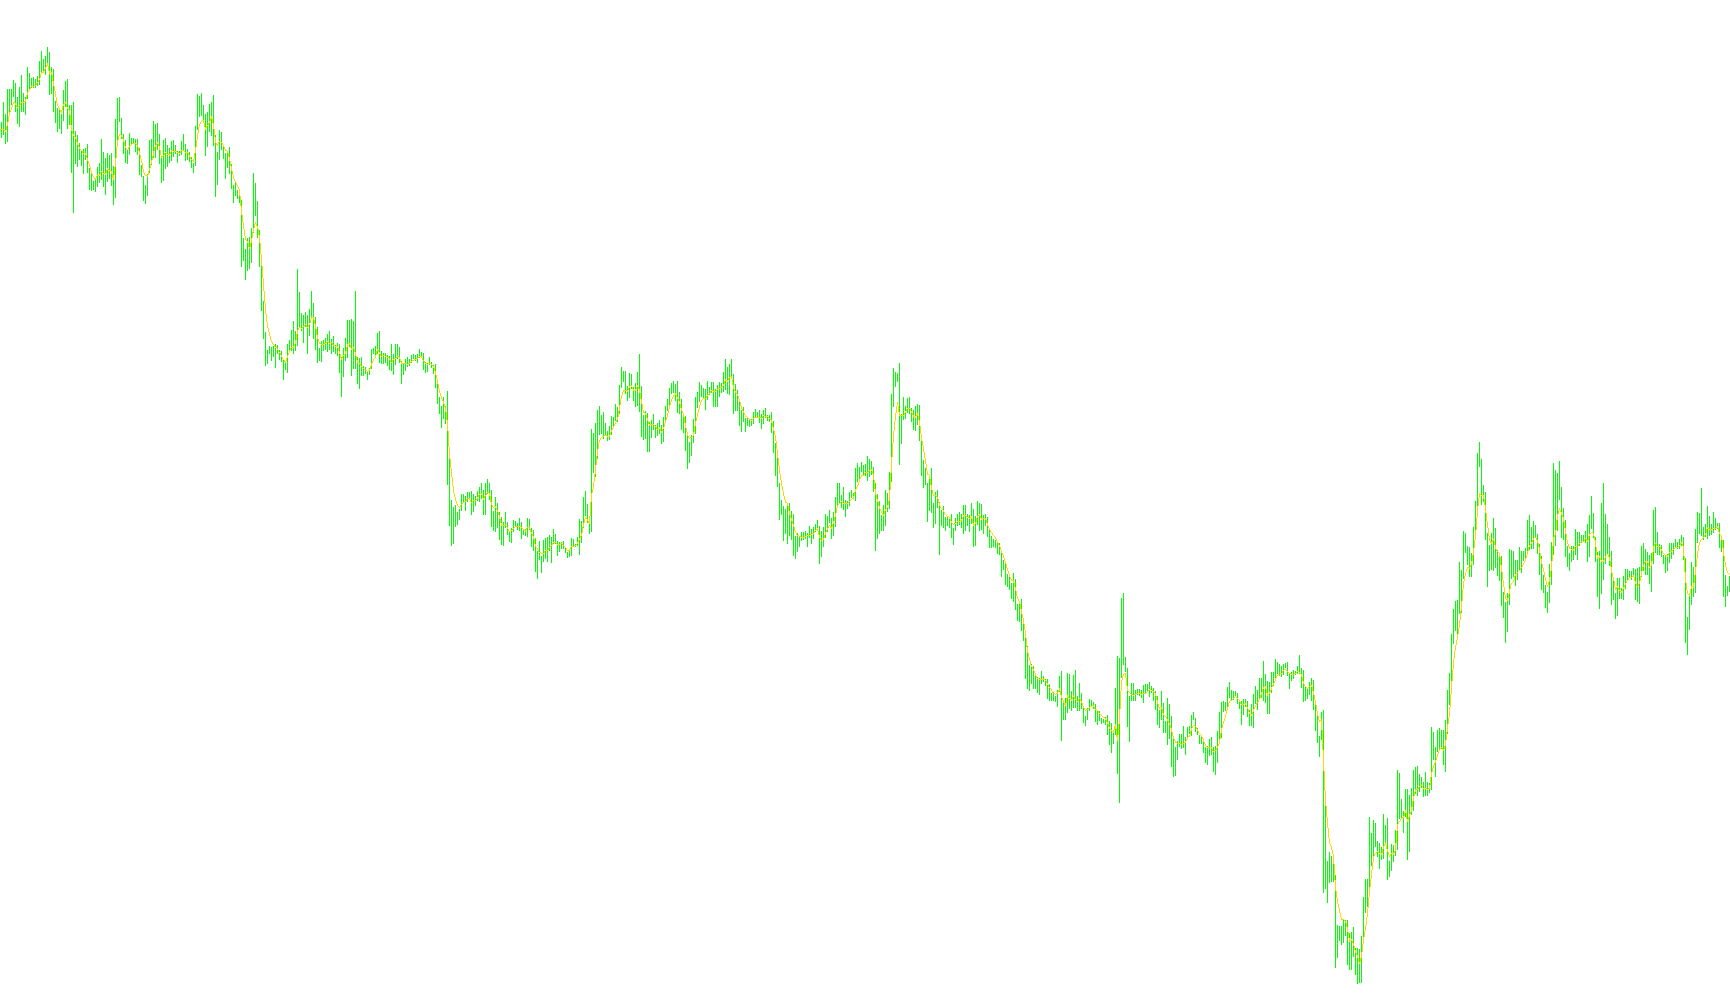
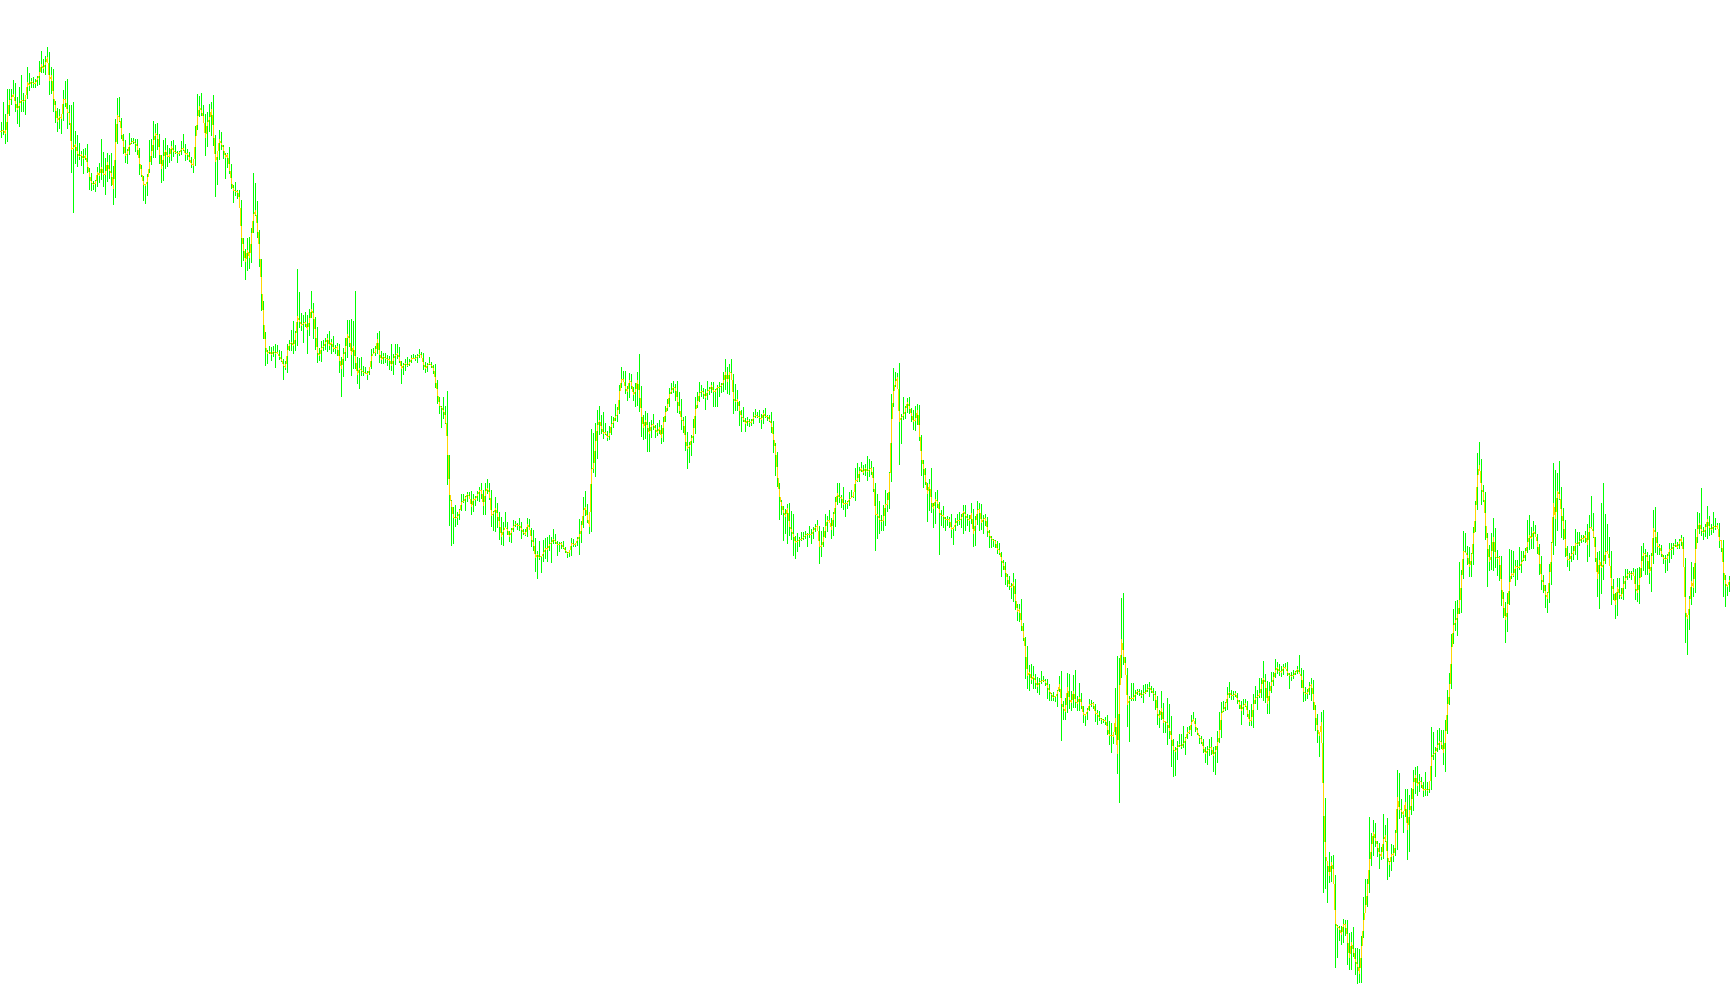
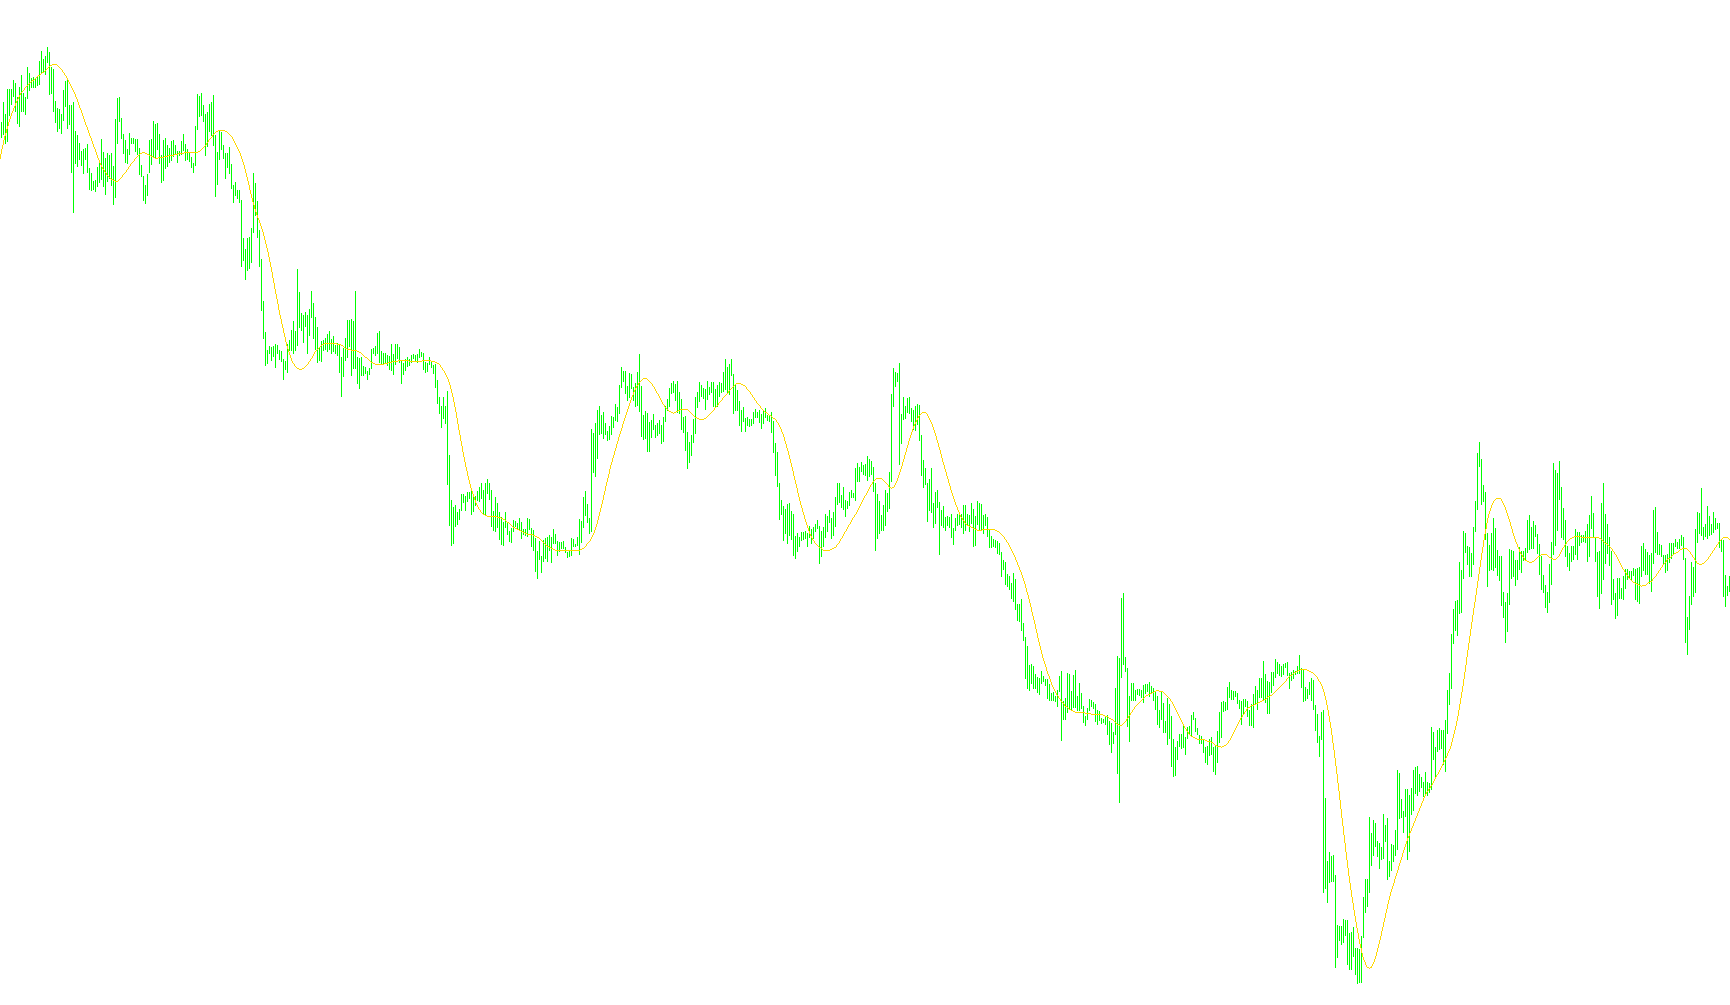
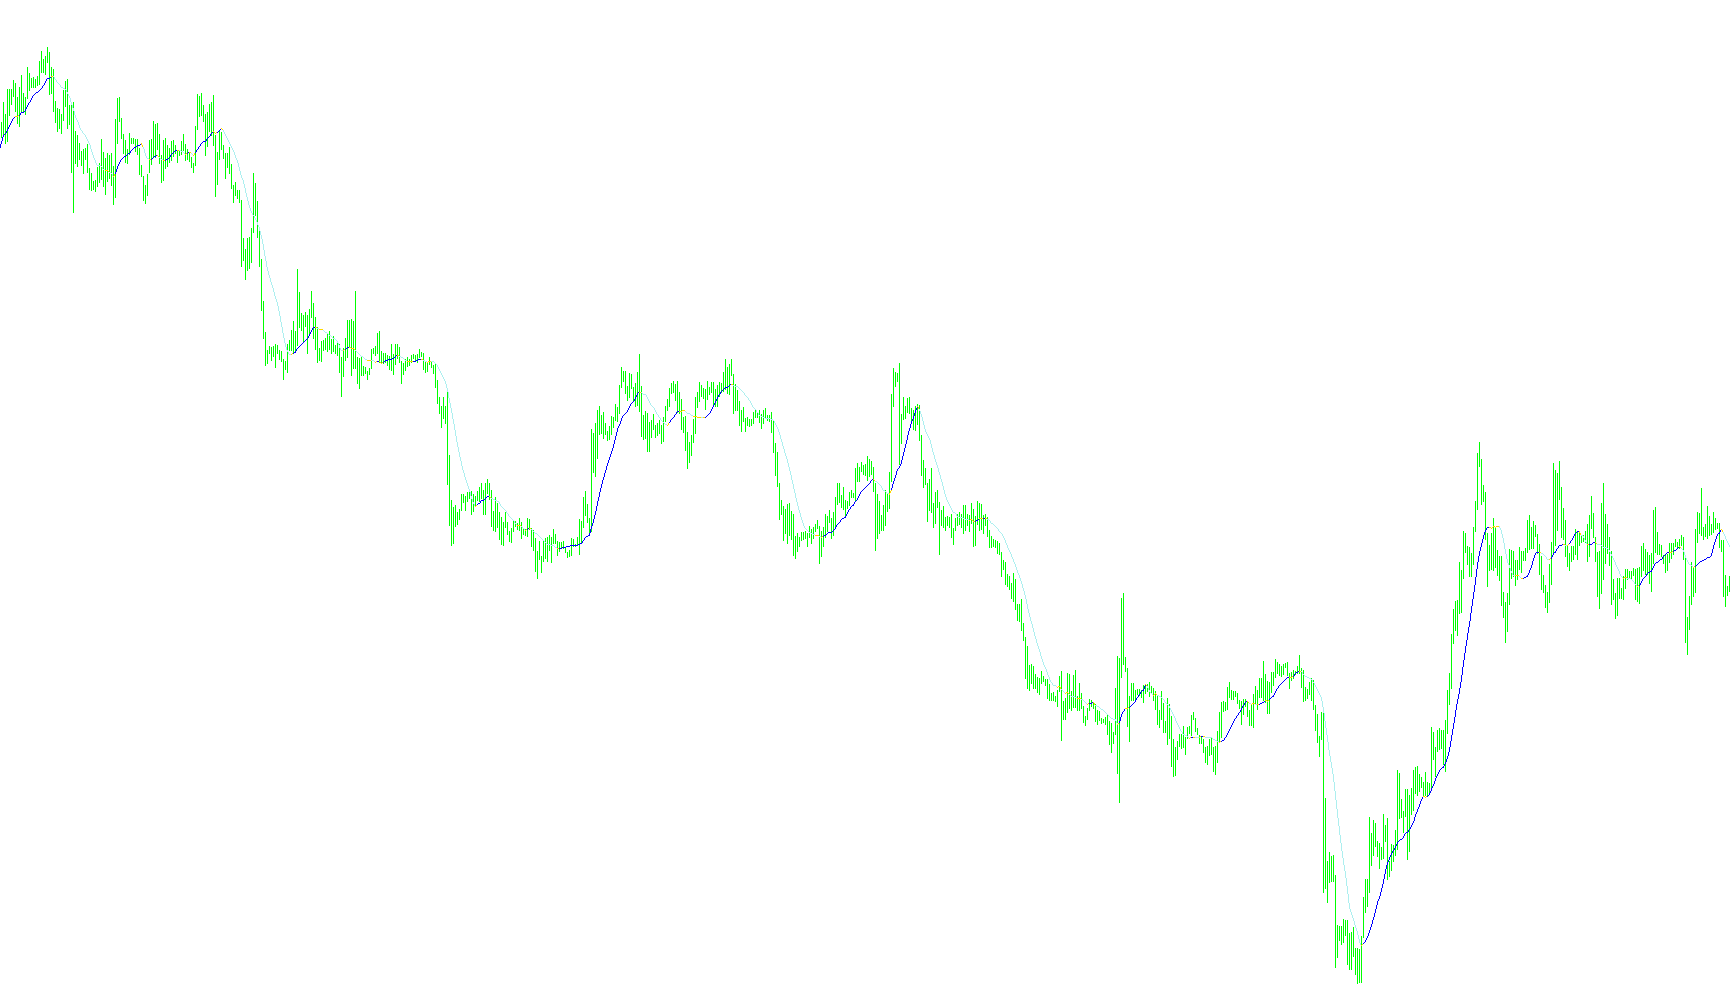
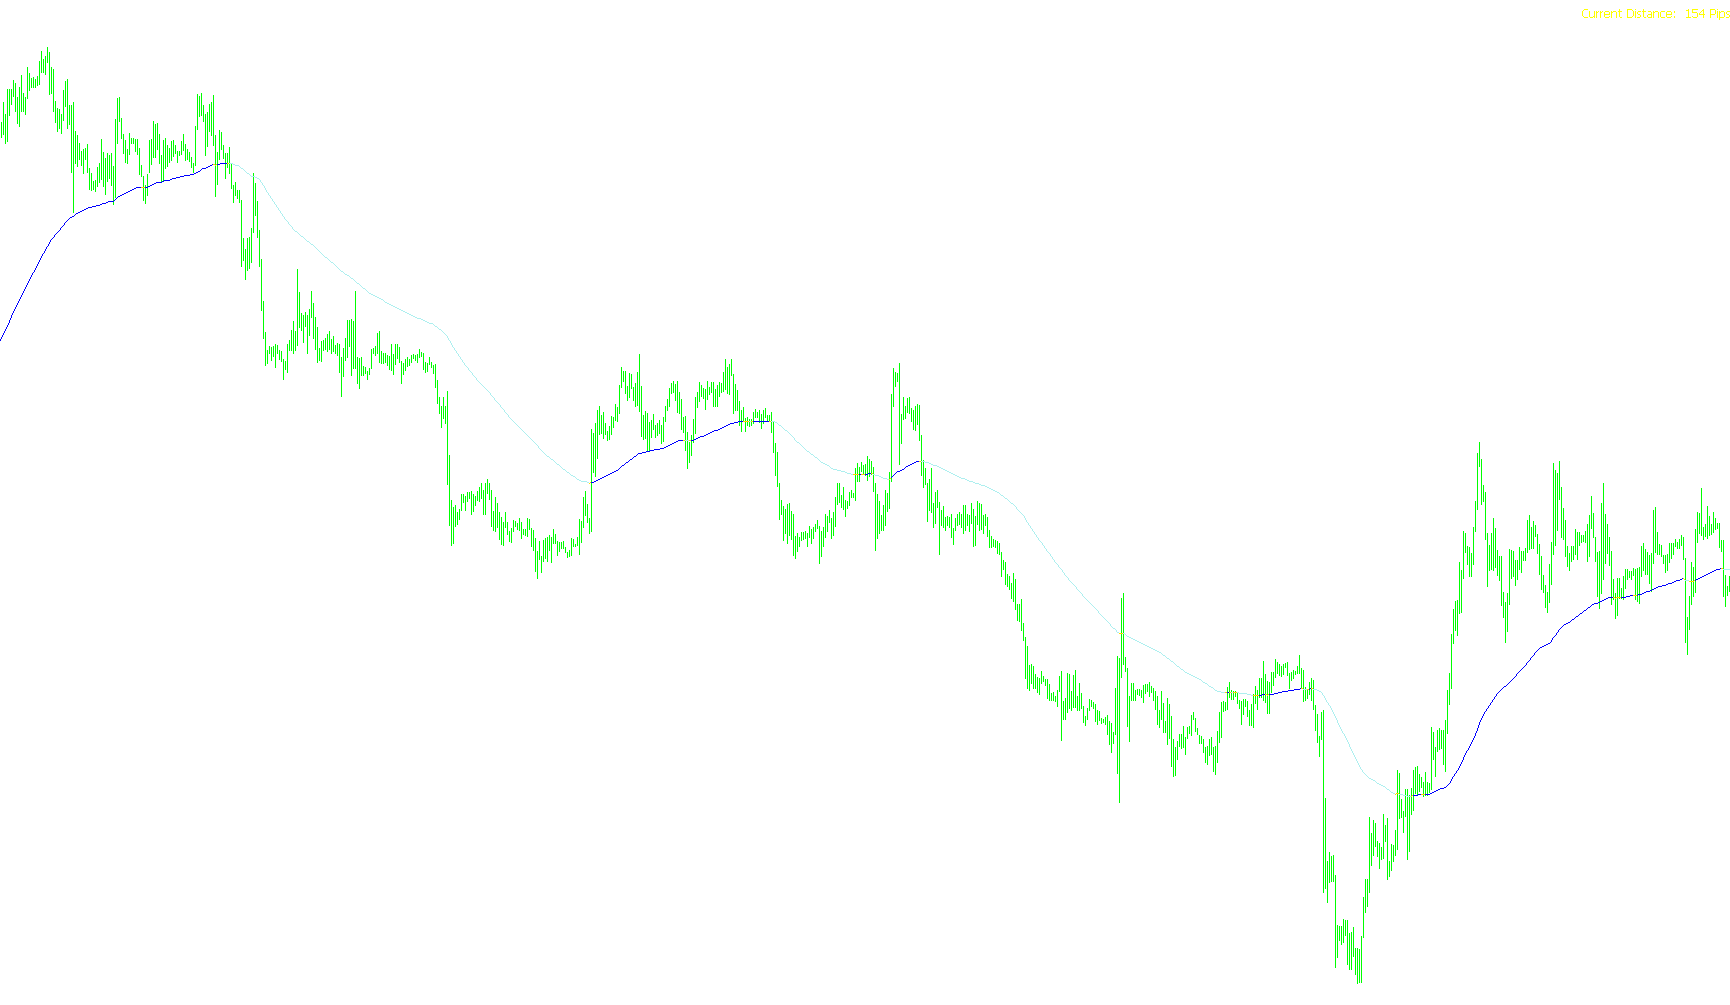
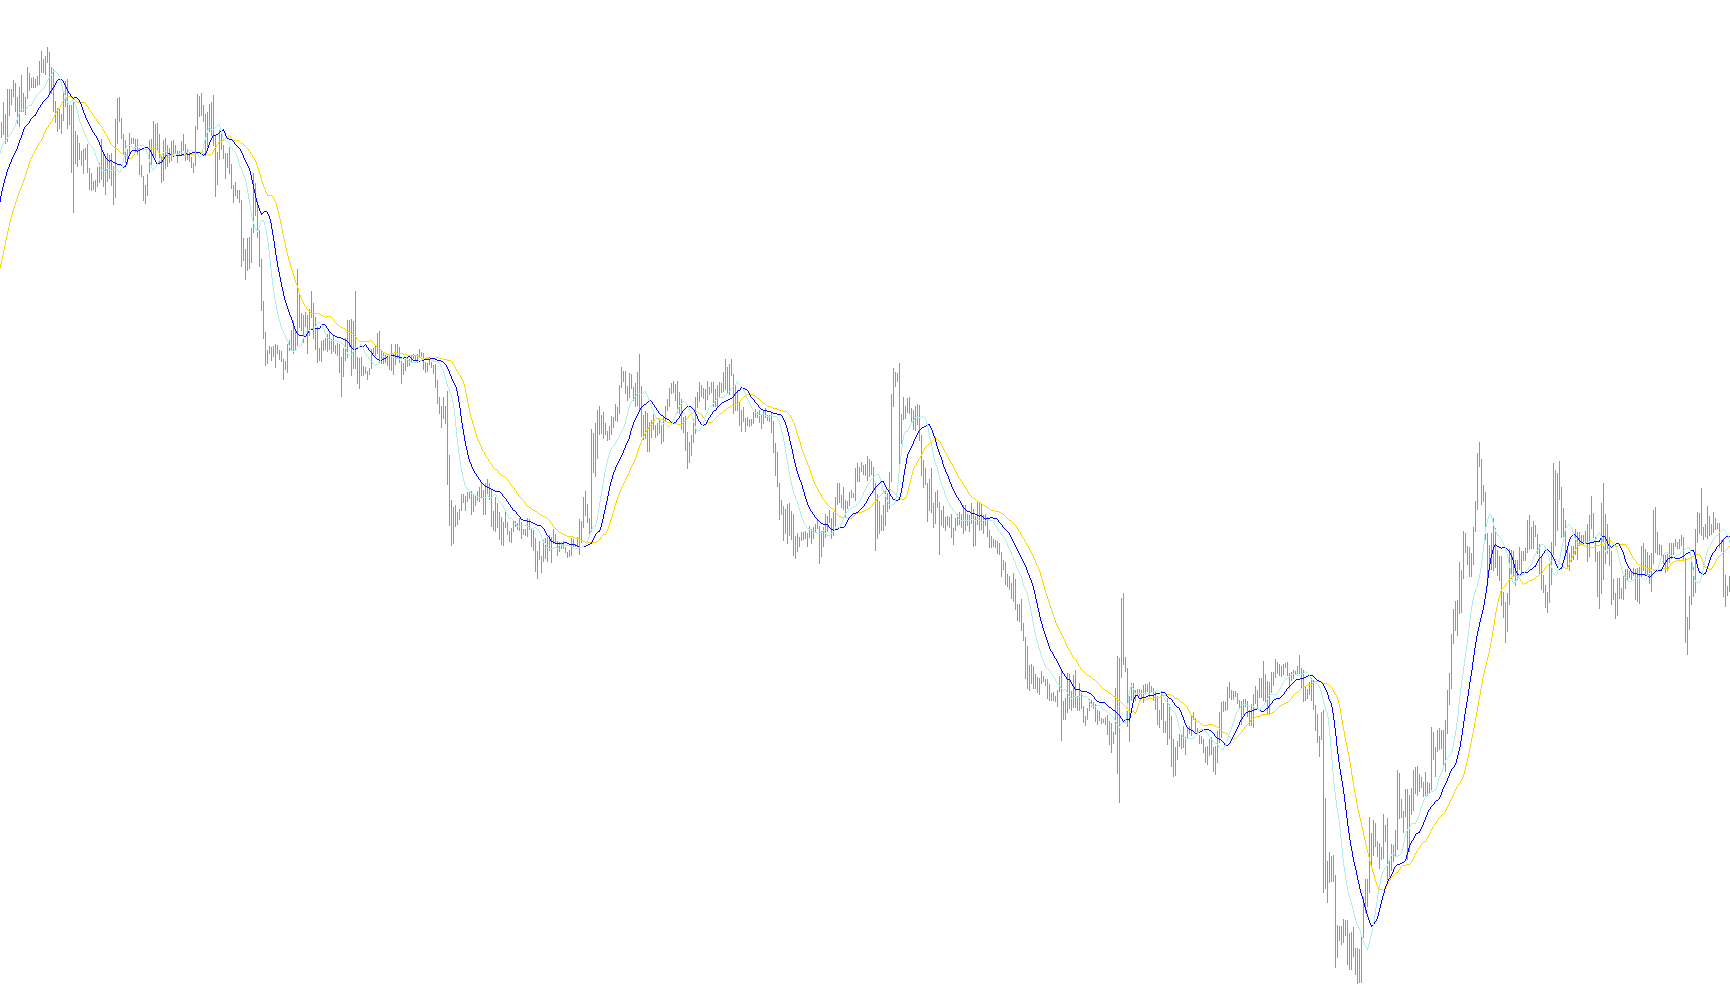
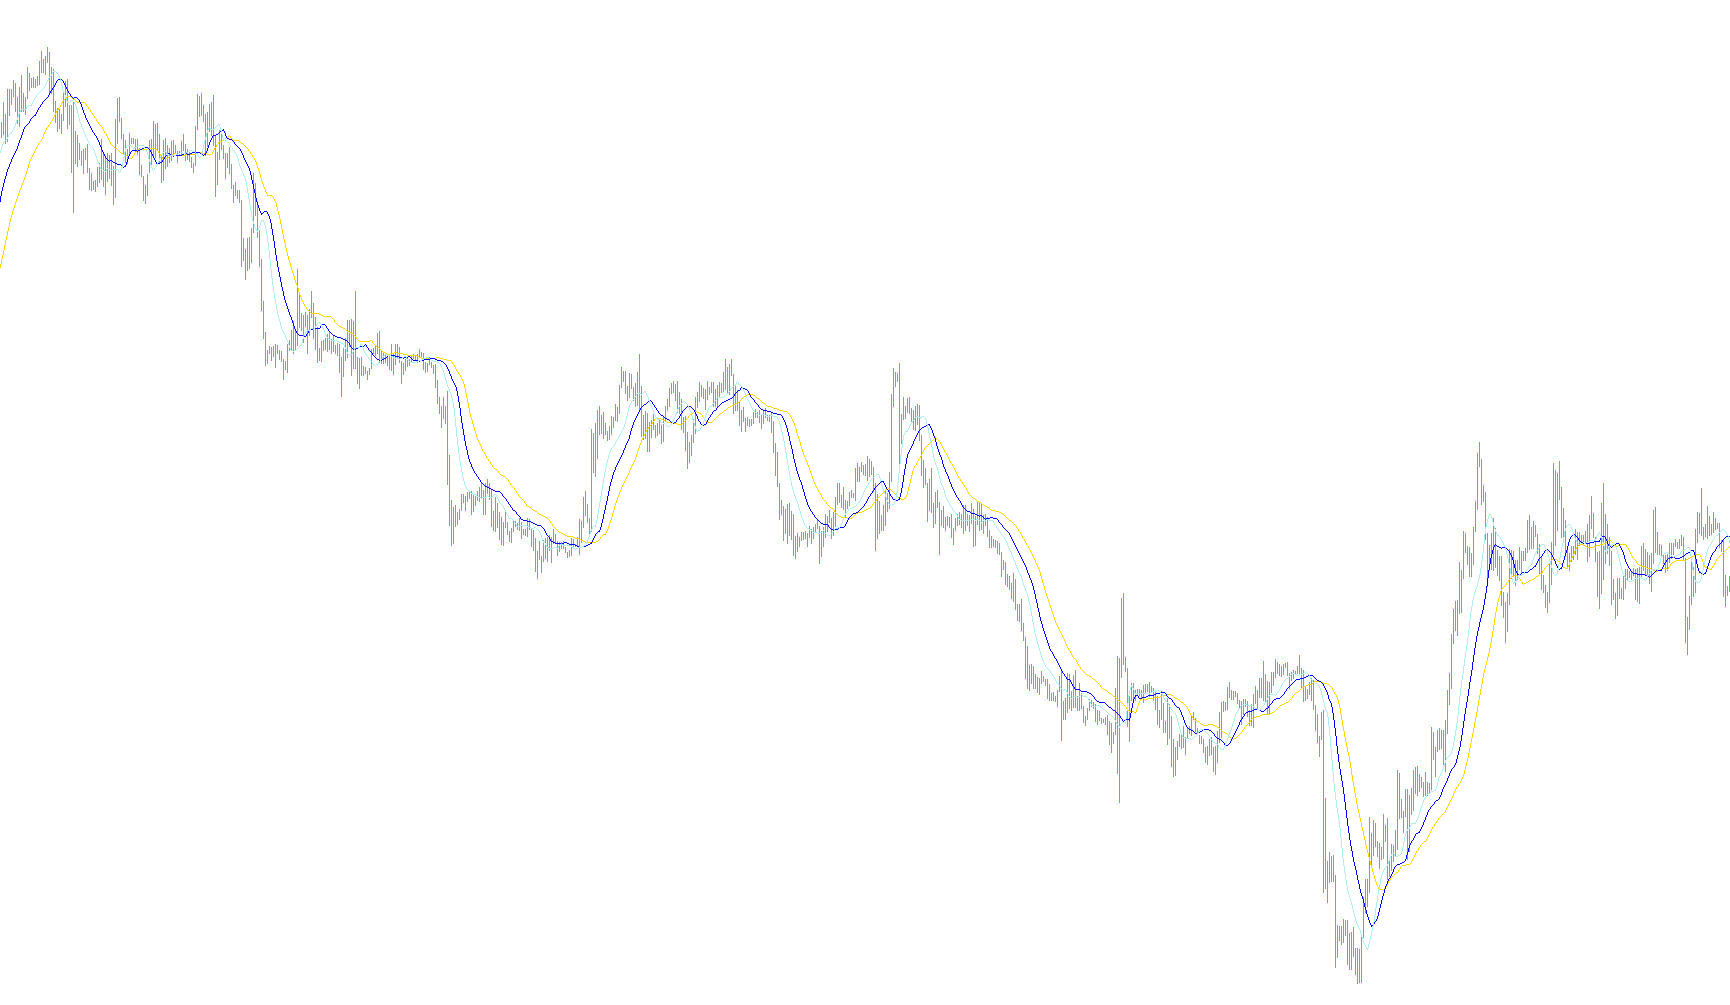
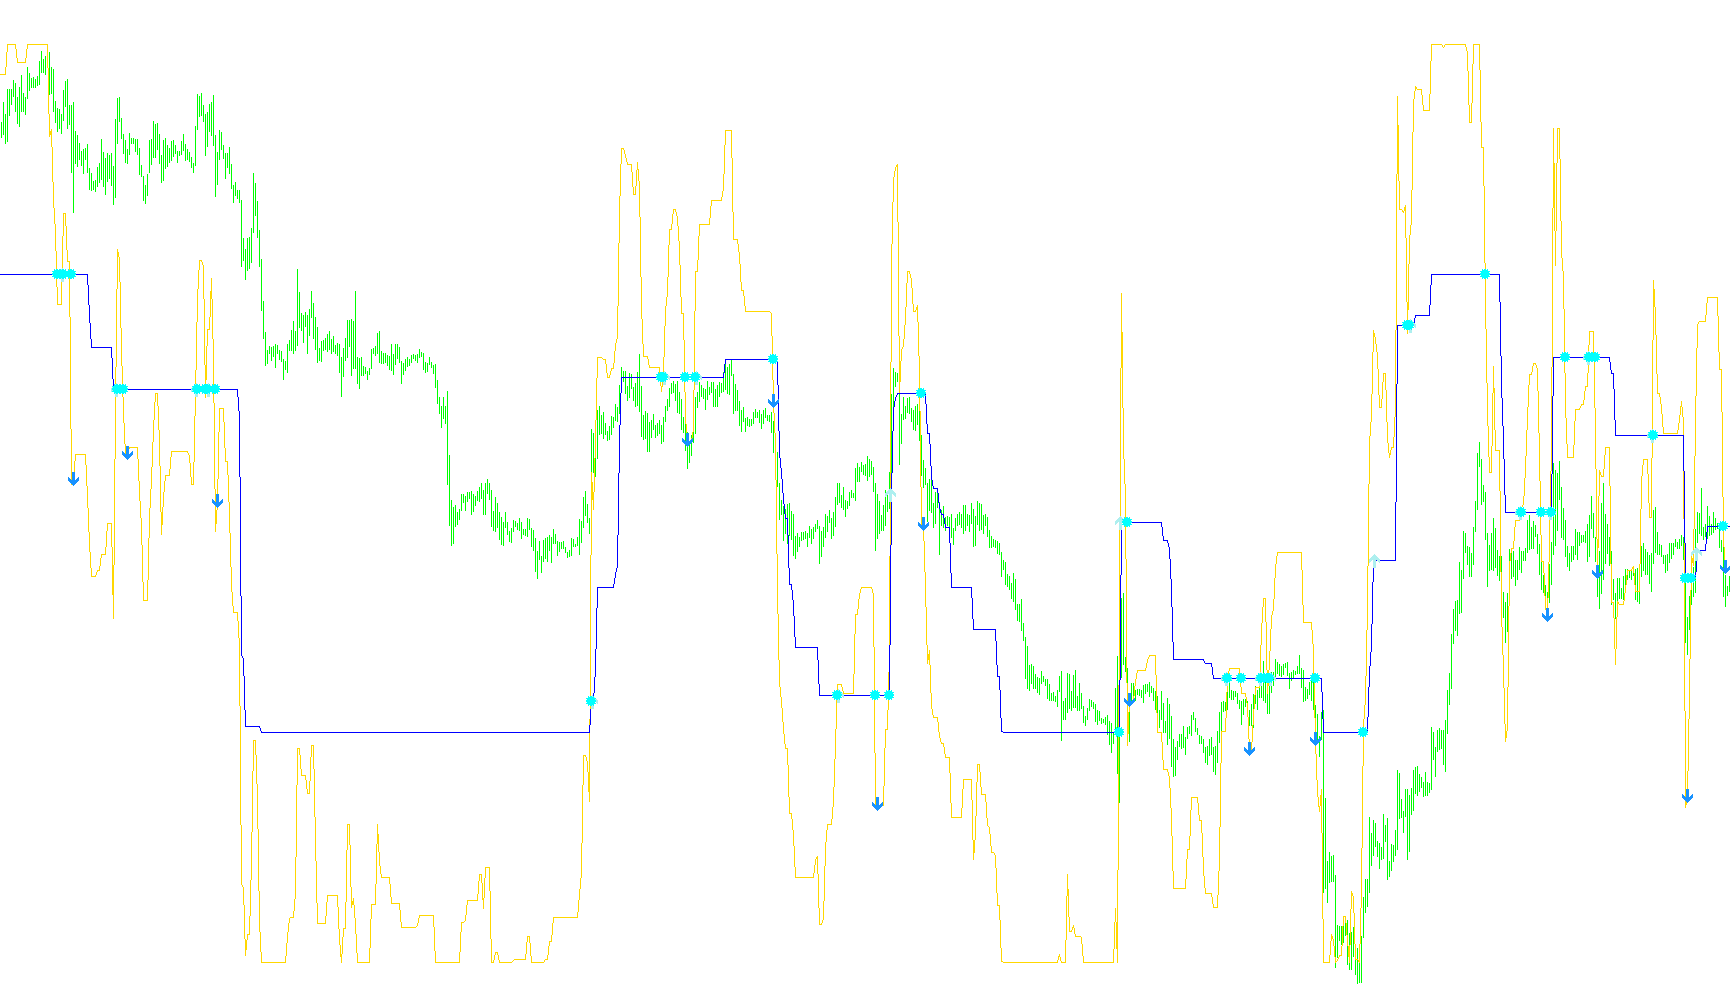
Akuma99 Storm Clouds
Indicator

Akuma99 Storm Clouds

iBandsiFractalsiATRiMA
Alert MACD Slow
Indicator

Alert MACD Slow

iMACDiMA

This algorithm identifies trend reversal points by detecting specific MACD price fluctuations combined with EMA crossovers and breakout price action.

Alert SMA-EMA CrossOver
Indicator

Alert SMA-EMA CrossOver

iMA

This indicator identifies trend reversals by detecting precise momentum shifts when short-term and long-term moving averages intersect, triggering visual signals and real-time notifications.

Alert SMA-EMA CrossOver1
Indicator

Alert SMA-EMA CrossOver1

iMA

This indicator identifies trend reversals by detecting the precise intersection points between a fast exponential moving average and a slower simple moving average across specific multi-timeframe parameters.

Indicator

Alert

iMAiMAOnArrayiRSIiStochastic
Indicator

Alert_3MA_Cross

iMA
Alert_3MA_Cross_nc
Indicator

Alert_3MA_Cross_nc

iMA

This indicator detects dynamic trend shifts by monitoring bullish or bearish intersections between three customizable moving averages and visualizes the volatility-adjusted entry points.

Alert_MA
Indicator

Alert_MA

iMA

Triggers real-time alerts when the current market bid price converges within a user-defined point threshold of a specified exponential moving average.

Alert_MA_v1
Indicator

Alert_MA_v1

iMA

This script triggers an immediate alert whenever the current Ask price intersects within a user-defined point range of a specified Exponential Moving Average.

Alert_MA_v2
Indicator

Alert_MA_v2

iMA

This indicator triggers alerts when the current market price enters a specific proximity of a Moving Average or when the Moving Average crosses a predefined numerical level.

Indicator

Alert_MA_v3

iMA
Alex5757000 - Multi Moving Average v2.1
Indicator

Alex5757000 - Multi Moving Average v2.1

iMA

A multi-threaded moving average system that synchronizes trend direction across various timeframes to provide visual harmony and unified momentum alerts.

Alex5757000 - Multi Moving Average v2
Indicator

Alex5757000 - Multi Moving Average v2

iMA

This indicator identifies high-probability trend alignment by synchronizing the directional momentum of four independent moving averages across multiple timeframes simultaneously.

Indicator

Alex5757000 - Multi Moving Average

iMA
Indicator

All Woodies CCI v1.0

iCCIiMA
AllAverages_v1-Labeled
Indicator

AllAverages_v1-Labeled

iMA

This indicator calculates and visualizes a wide spectrum of advanced moving averages, including HMA, ZeroLagEMA, and SineWMA, by processing price data through various weighted and smoothed algorithms.

AllAverages_v1-Lab_tab1
Indicator

AllAverages_v1-Lab_tab1

iMA

A comprehensive technical indicator that calculates and visualizes ten distinct moving average types, including HMA, LSMA, and ZeroLagEMA, to provide multifaceted trend smoothing.

AllAverages_v1-Lab_tab1_v1
Indicator

AllAverages_v1-Lab_tab1_v1

iMA

A versatile technical indicator that calculates and visualizes multiple advanced moving average algorithms, including HMA, LSMA, and ZeroLagEMA, from a single price input.

AllAverages_v1-Lab_tabfix
Indicator

AllAverages_v1-Lab_tabfix

iMA

This indicator computes a comprehensive suite of advanced moving averages including HMA, LSMA, SineWMA, and ZeroLagEMA by recursively processing price data through specialized weighted kernels.

AllAverages_v1.1
Indicator

AllAverages_v1.1

iMA

This indicator provides a comprehensive suite of advanced moving average calculations including T3, Hull, and ZeroLag variants by applying sophisticated smoothing algorithms to primary price data.

AllAverages_v1
Indicator

AllAverages_v1

iMA

This indicator calculates a nested smoothing effect by applying various weighted moving average algorithms to an initial moving average of the price data.

AllAverages_v2.1.Lb_mtf
Indicator

AllAverages_v2.1.Lb_mtf

iMA

A versatile technical analysis engine that calculates eighteen distinct moving average methodologies, including regression-based and smoothed variants, with multi-timeframe synchronization capabilities.

AllAverages_v2.1
Indicator

AllAverages_v2.1

iMA

A comprehensive technical analysis tool providing multi-timeframe synchronization for seventeen distinct moving average algorithms, including linear regression and zero-lag smoothing.

AllAverages_v2.2
Indicator

AllAverages_v2.2

iMA

A comprehensive technical analysis tool that enables seamless switching between nineteen distinct moving average algorithms and diverse price input types including Heiken Ashi data.

Indicator

AllAverages_v2.2_TRO_MODIFIED_VERSION

iMA
AllAverages_v2.5
Indicator

AllAverages_v2.5

iMA

A comprehensive technical indicator providing an extensive library of 21 distinct moving average algorithms, including Heiken Ashi price filtering and multi-timeframe trend synchronization.

AllAverages_v2.5_Distance
Indicator

AllAverages_v2.5_Distance

iMA

A comprehensive technical indicator that computes 21 distinct moving average variants, including complex mathematical models and Heiken Ashi price smoothing, to detect trend shifts and proximity alerts.

AllAverages_v2.5_Dist_Up_Dn_alert
Indicator

AllAverages_v2.5_Dist_Up_Dn_alert

iMA

This comprehensive indicator calculates twenty distinct moving average algorithms, including high-frequency and volume-weighted variants, to identify trend momentum and proximity alerts across multiple price types.

AllAverages_v2.5_Stats
Indicator

AllAverages_v2.5_Stats

iMA

A comprehensive technical analysis tool providing real-time calculation for twenty distinct moving average methodologies and Heiken Ashi price variants with integrated trend detection and distance volatility alerts.

AllFramesTrend
Indicator

AllFramesTrend

iMA

This indicator identifies synchronized bullish or bearish momentum by validating moving average slopes across multiple concurrent timeframes.

alligator
Indicator

alligator

iMA

This indicator calculates three distinct Smoothed Moving Averages based on median prices to identify momentum shifts and trend trajectories through multi-period shifting.

alligator_v1
Indicator

alligator_v1

iMA

The script calculates three distinct smoothed moving averages with varying periods and offsets to visualize trend direction, strength, and potential price exhaustion.

Alligator_v2
Indicator

Alligator_v2

iMA

This indicator identifies trend momentum by plotting three distinct smoothed moving averages with staggered periods and temporal shifts to visualize price volatility.

all_in_one_grab
Indicator

all_in_one_grab

iATRiMA

A comprehensive visual dashboard that overlays daily, weekly, and monthly pivot points, OHLC boundaries, moving averages, and real-time market analytics including ATR and spread monitoring.

Indicator

All_Woodies_CCI_v1.0.MM1

iCCIiMA
Alma
Indicator

Alma

iMA

This indicator calculates a trend line by applying a Gaussian distribution weight to a series of simple moving averages, optimizing the balance between noise reduction and lag minimization.

ALMA_v1
Indicator

ALMA_v1

iMA

This algorithm applies a weighted moving average utilizing a Gaussian distribution to prioritize recent price data while employing dynamic standard deviation filtering to minimize signal noise during lateral movements.

alphatrendspotter_free
Indicator

alphatrendspotter_free

iMAiSAR

This indicator synchronizes multi-period EMA crossovers and Parabolic SAR values across daily, weekly, and hourly timeframes to identify high-probability trend alignment.

alx_RSI_BANDS_MA
Indicator

alx_RSI_BANDS_MA

iMAiMAOnArrayiRSI

This indicator overlays Moving Average and Bollinger Bands directly onto the RSI values to identify volatility envelopes and trend shifts within momentum data.
alx_RSI_BANDS_MA_change
Indicator

alx_RSI_BANDS_MA_change

iMAiMAOnArrayiRSI

This indicator calculates a moving average and Bollinger Bands directly on the RSI oscillator values to identify momentum extremes and volatility within relative strength levels.

aNina
Indicator

aNina

iMA

This indicator calculates dynamic volatility boundaries using a weighted range sum to identify trend exhaustion and generate signal crossovers based on price action relative to multi-level momentum bands.

aNina_v1
Indicator

aNina_v1

iMA

This indicator utilizes a weighted range-based volatility algorithm to generate multi-level trend lines, providing crossover signals validated by an exponential moving average filter for precise entry identification.

aNina_v1m
Indicator

aNina_v1m

iMA

This indicator utilizes a weighted volatility range to calculate dynamic support and resistance levels, generating directional trade signals based on the crossover of momentum-based stochastic buffers filtered by an EMA trend bias.

aNina_v2
Indicator

aNina_v2

iMA

This indicator utilizes a weighted price range expansion logic to calculate volatility-adjusted support and resistance levels, identifying trend reversals through the intersection of dual stochastic-normalized trend lines.

aNina_v3
Indicator

aNina_v3

iMA

This indicator identifies directional momentum by calculating dynamic volatility bounds and detecting signal crossovers between multi-layered stochastic levels.

another_symbol_ad
Indicator

another_symbol_ad

iMA

This indicator projects the Simple Moving Average of a secondary asset and timeframe into a dedicated subwindow for real-time correlation analysis.

AnyMA_Rsi_R2_Indi_Opt
Indicator

AnyMA_Rsi_R2_Indi_Opt

iMAiMAOnArrayiRSI

This indicator identifies trend reversal entries by filtering Hull Moving Average momentum against progressive RSI velocity shifts and primary trend bias.

AO EfMA
Indicator

AO EfMA

iMAiMAOnArray

This indicator calculates the difference between two exponentially smoothed moving averages of moving averages to visualize momentum trends and zero-cross signals.

AO-AC(AM)
Indicator

AO-AC(AM)

iMAiMAOnArray

This indicator identifies trend exhaustion and momentum shifts by calculating the velocity differences between Accelerator and Decelerator oscillators using dual-period moving average offsets.

AO-Esp-MTF_v1.2
Indicator

AO-Esp-MTF_v1.2

iMA

This tool calculates the Awesome Oscillator across higher timeframes by measuring the differential between dual moving averages to identify trend reversals and momentum shifts.