mikko_painmeter2
Indicator

mikko_painmeter2

iMAOnArray

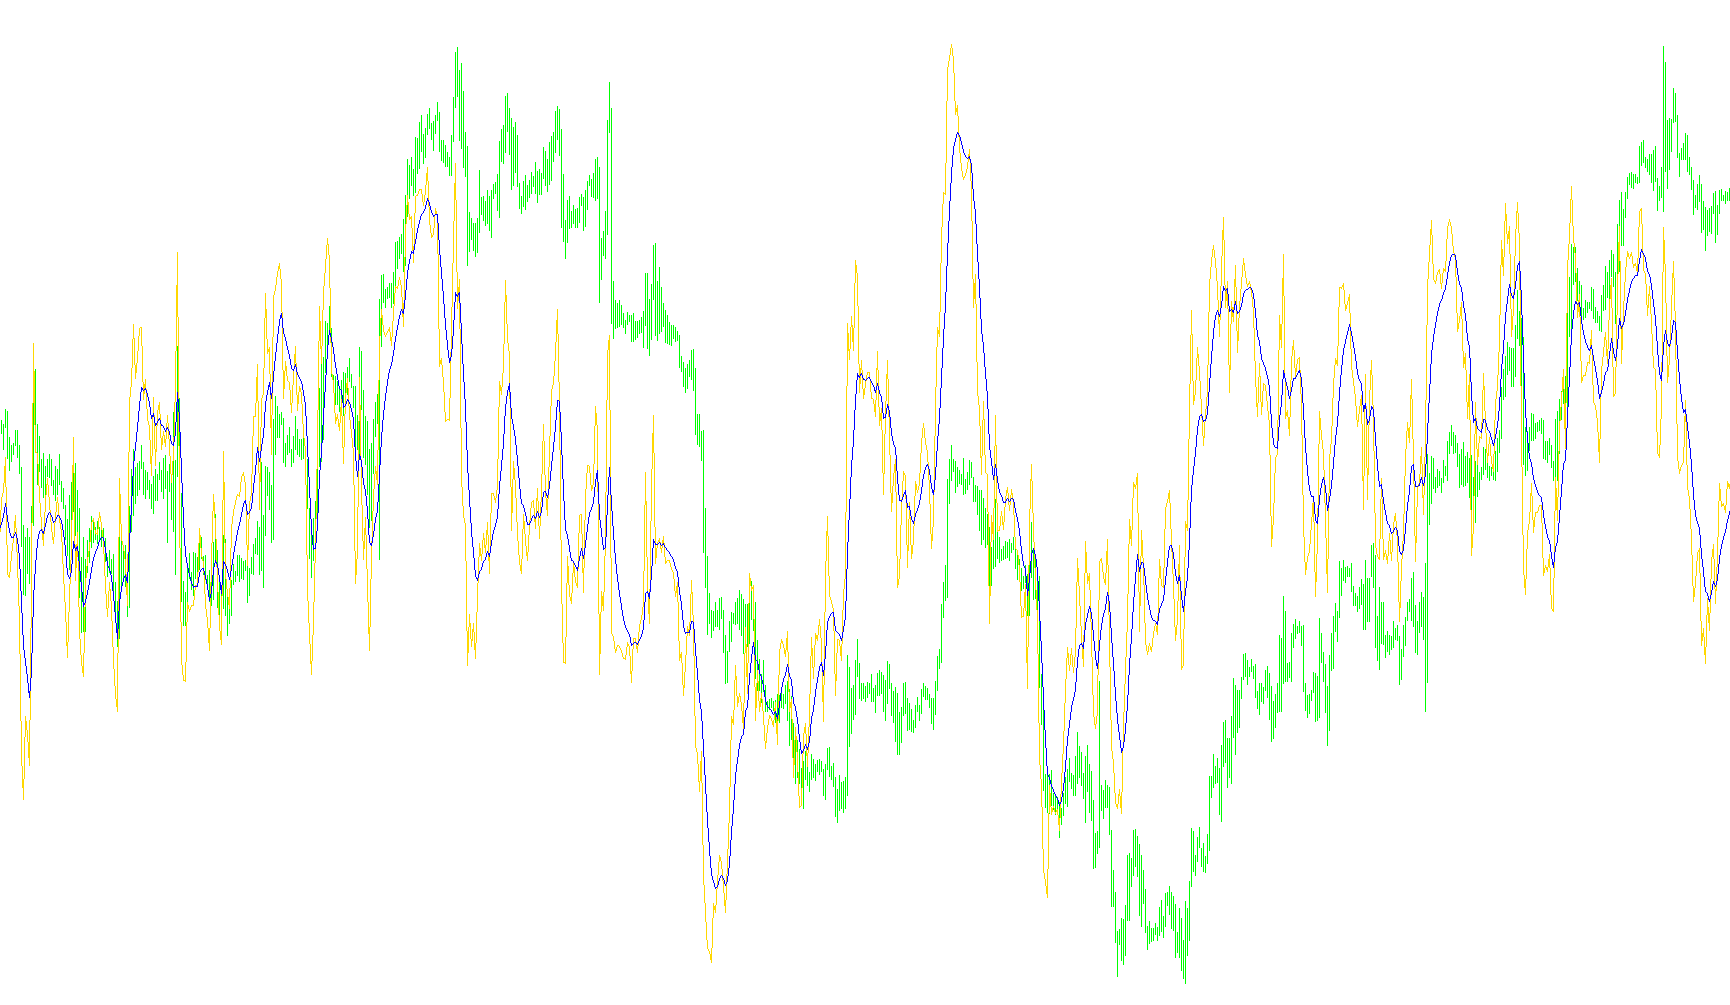
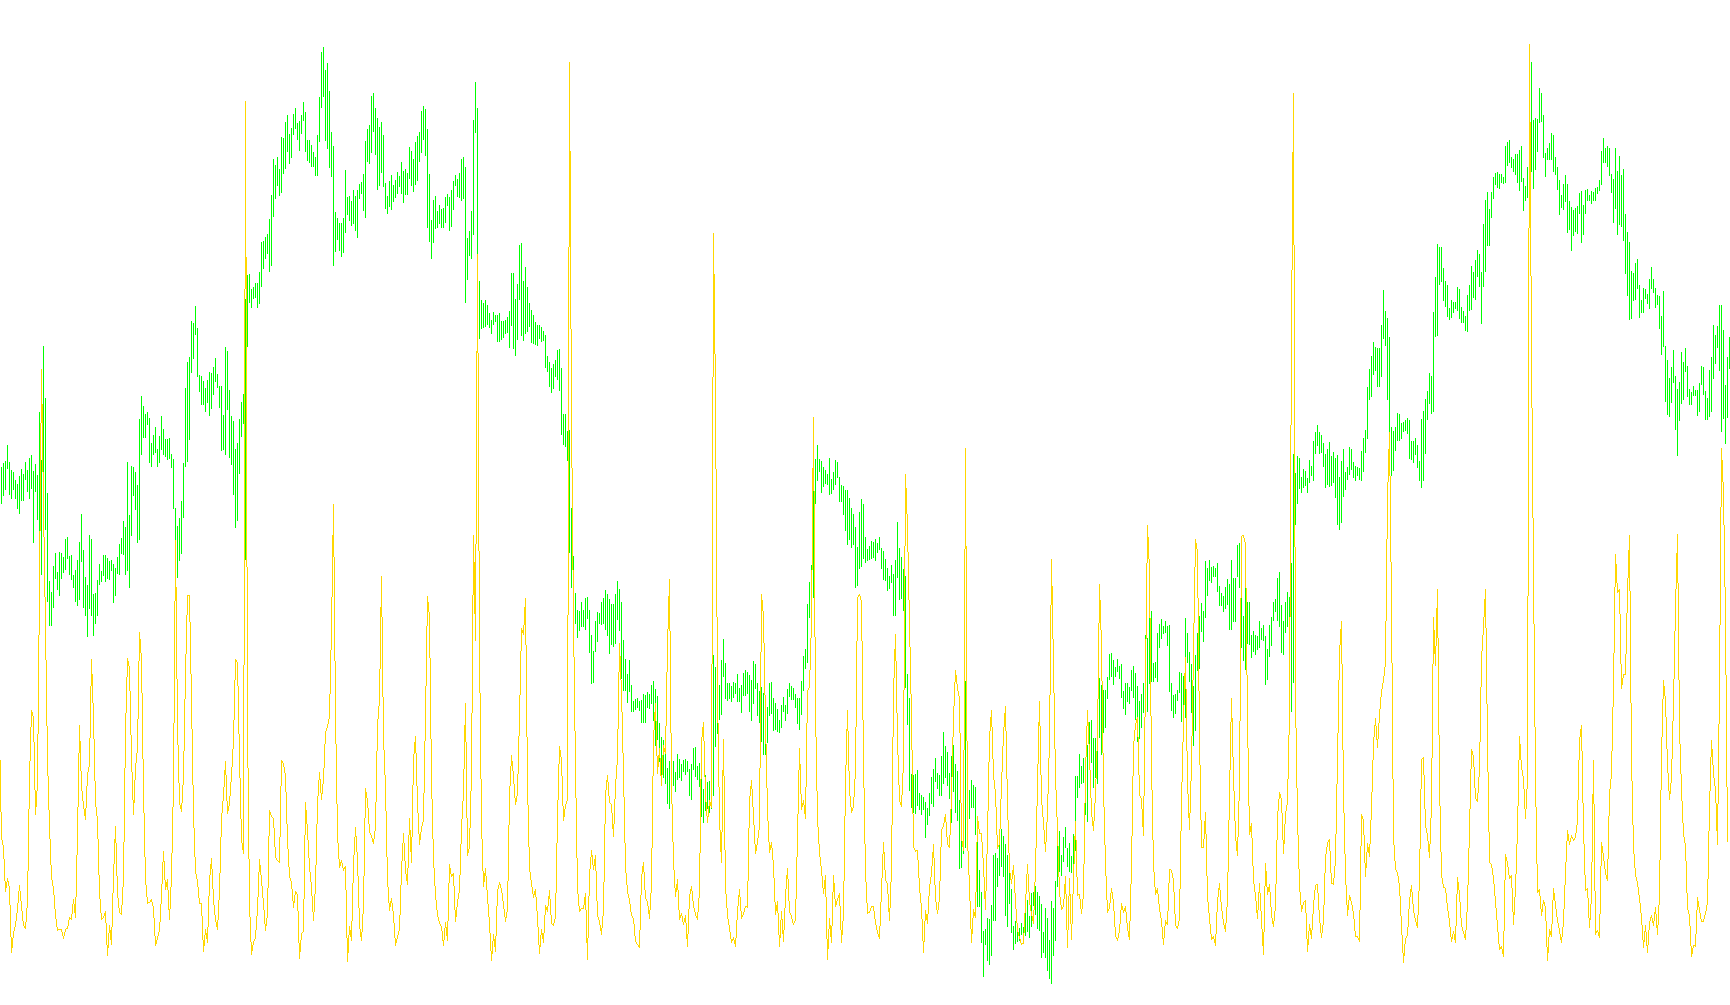
This indicator quantifies market emotional pressure by calculating the cumulative price displacement between current bars and a historical window to identify trend exhaustion via moving average troughs and peaks.
mnl_price
Indicator

mnl_price

iMAOnArray

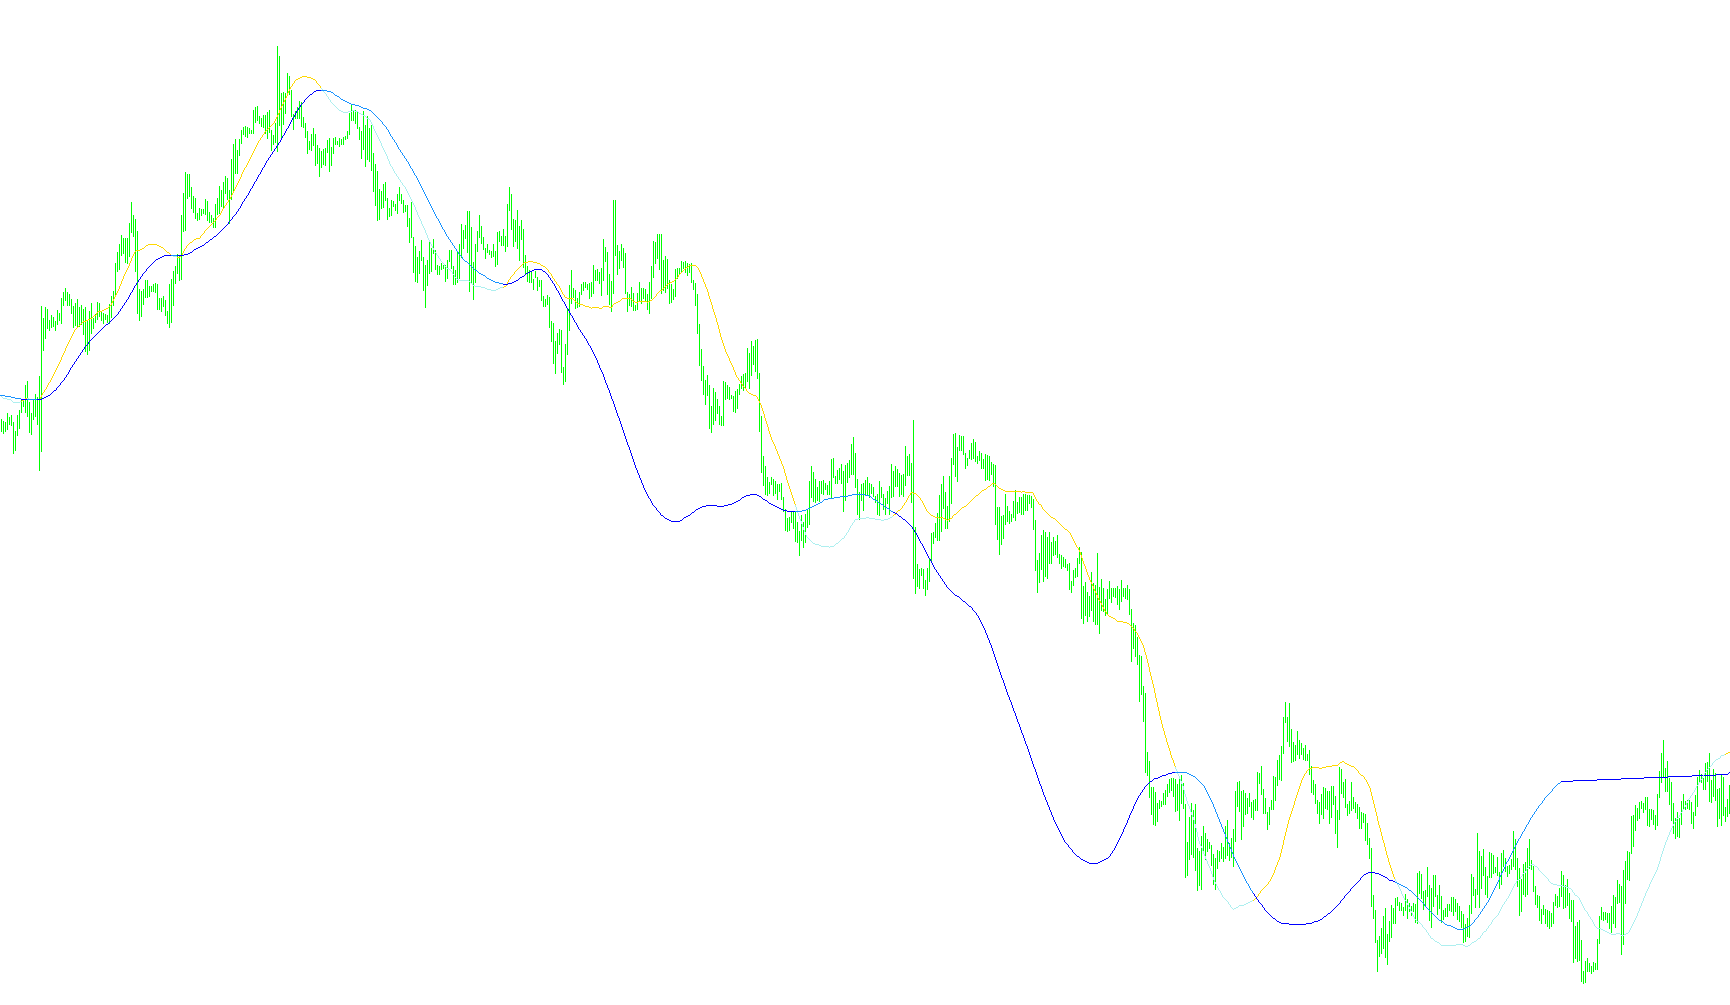
This indicator calculates price percentage fluctuations over a specific lookback period and applies dual-layer moving averages to identify trend acceleration and momentum shifts.

MoR
Indicator

MoR

iMAOnArrayiRSI

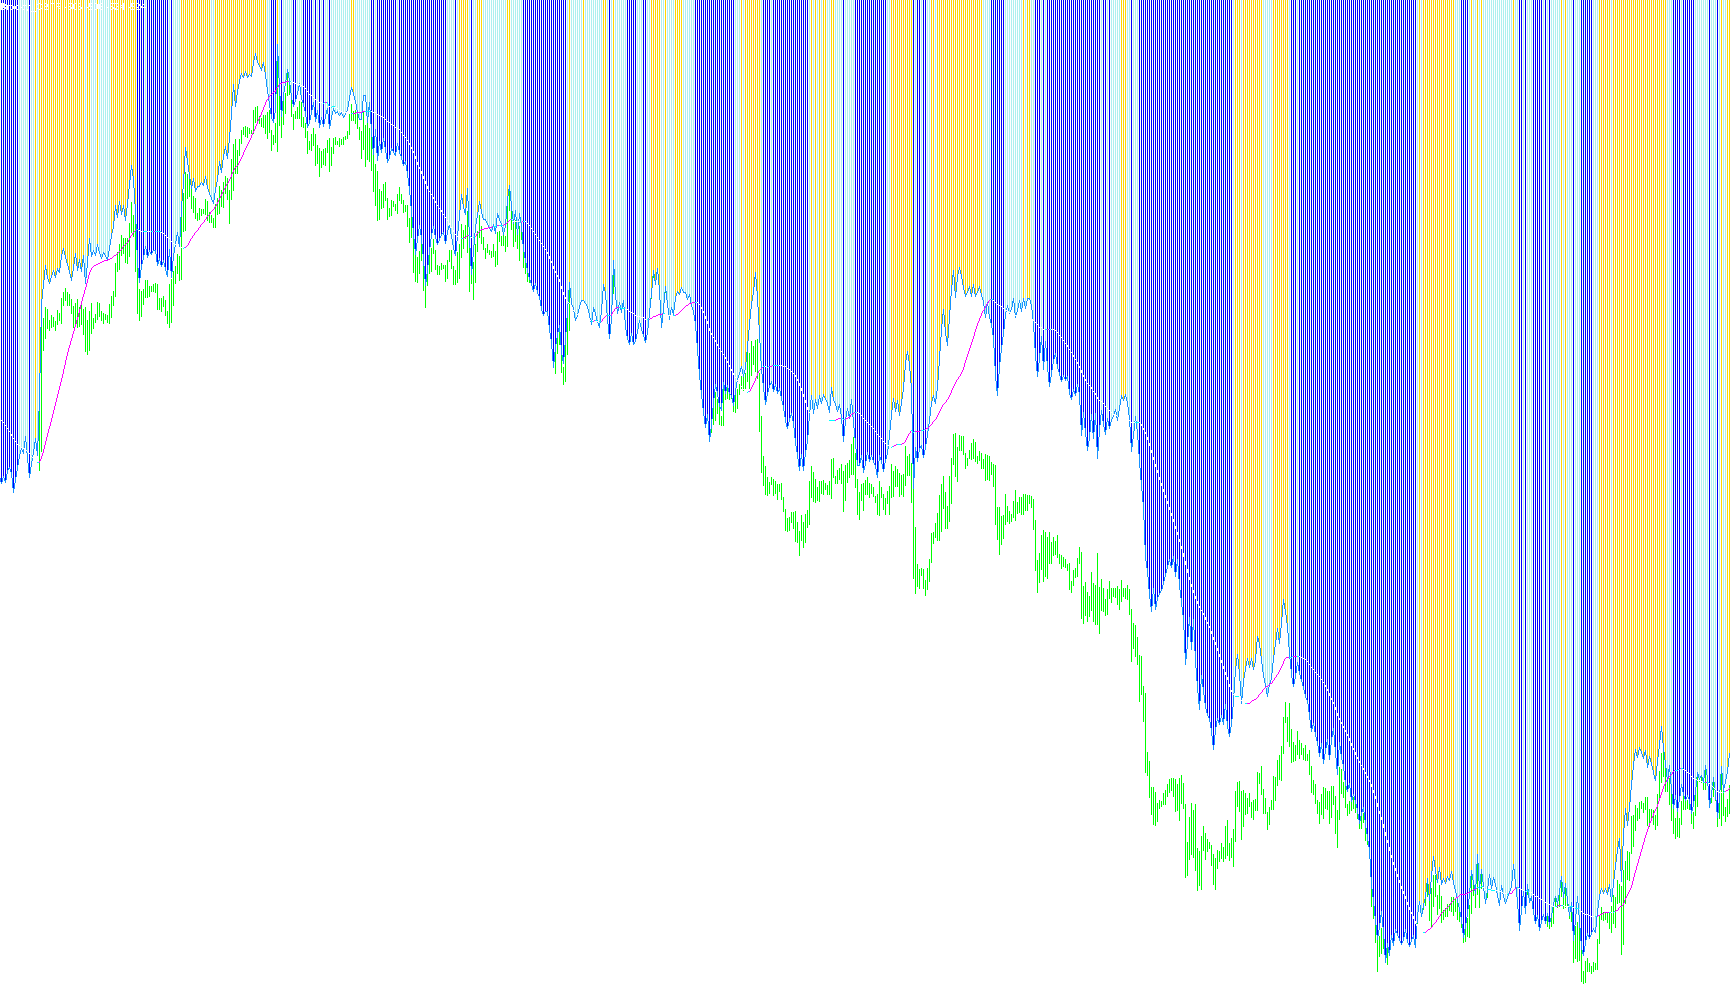
This indicator synthesizes momentum by calculating the percentage ratio between two moving averages derived from the RSI values to identify trend strength and exhaustion.

Indicator

MoR_MTF_Test

iMAOnArrayiRSI
MoR_v1
Indicator

MoR_v1

iMAOnArrayiRSI

This indicator calculates a dynamic momentum ratio by dividing two different moving averages derived from the Relative Strength Index.

MT4-LevelStop-Reverse-v1
Indicator

MT4-LevelStop-Reverse-v1

iATRiMAOnArray

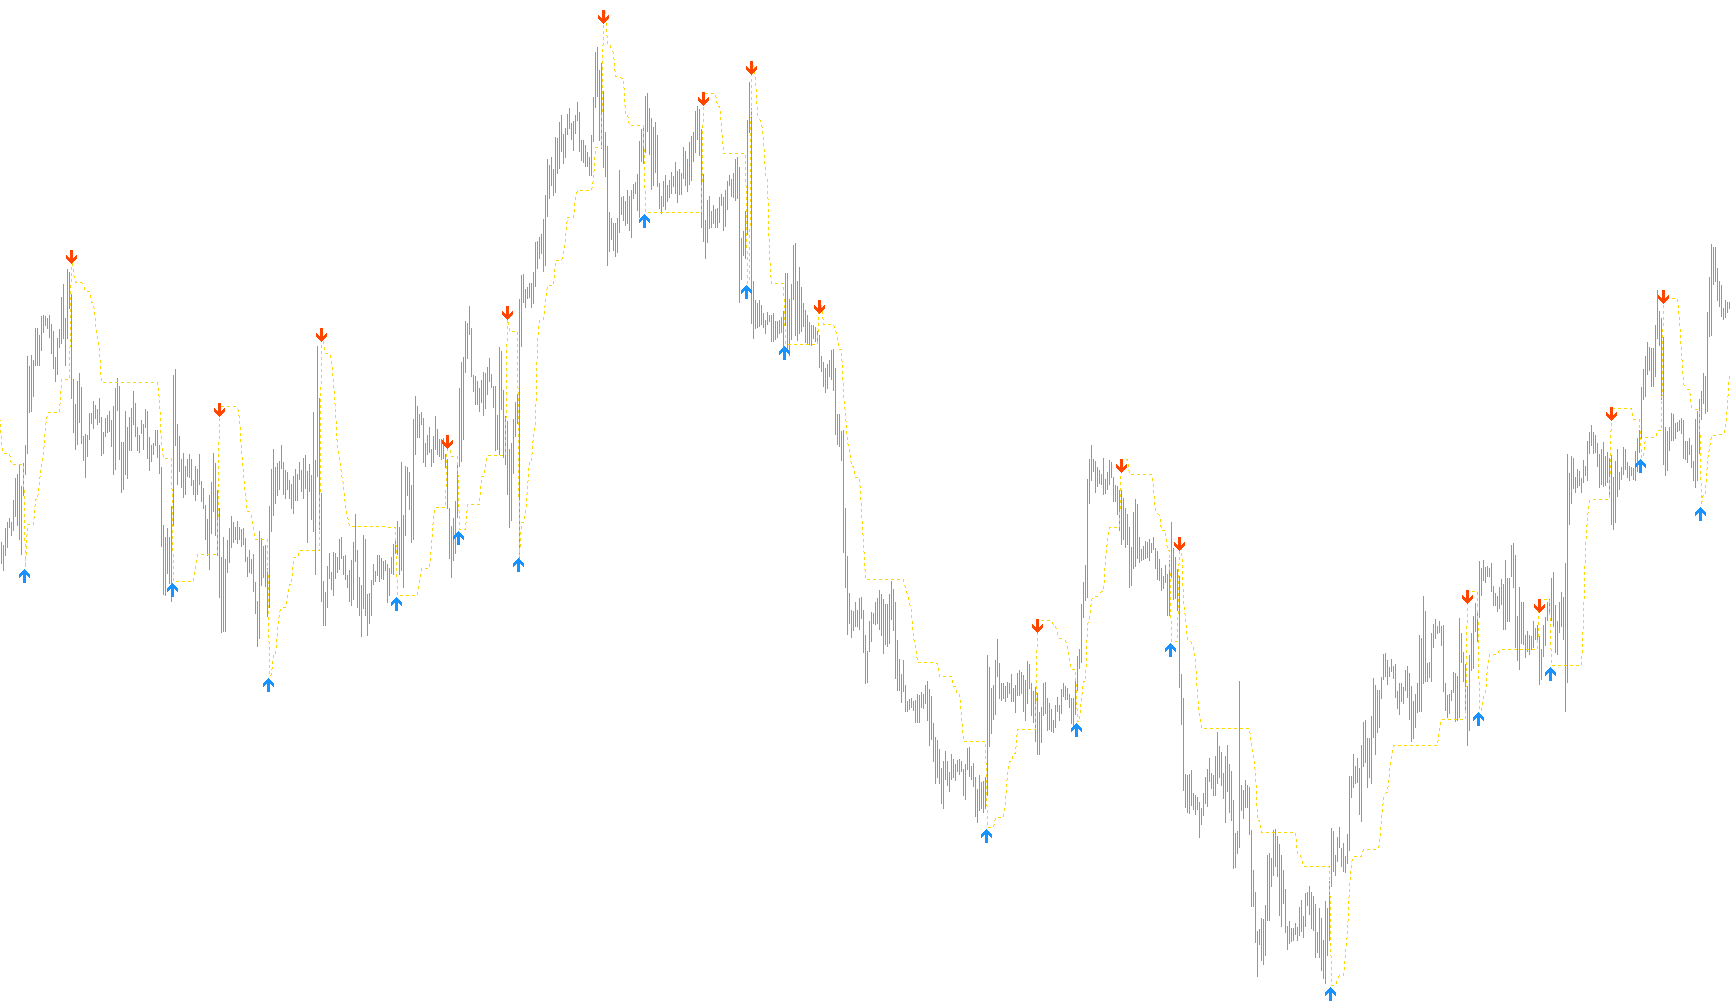
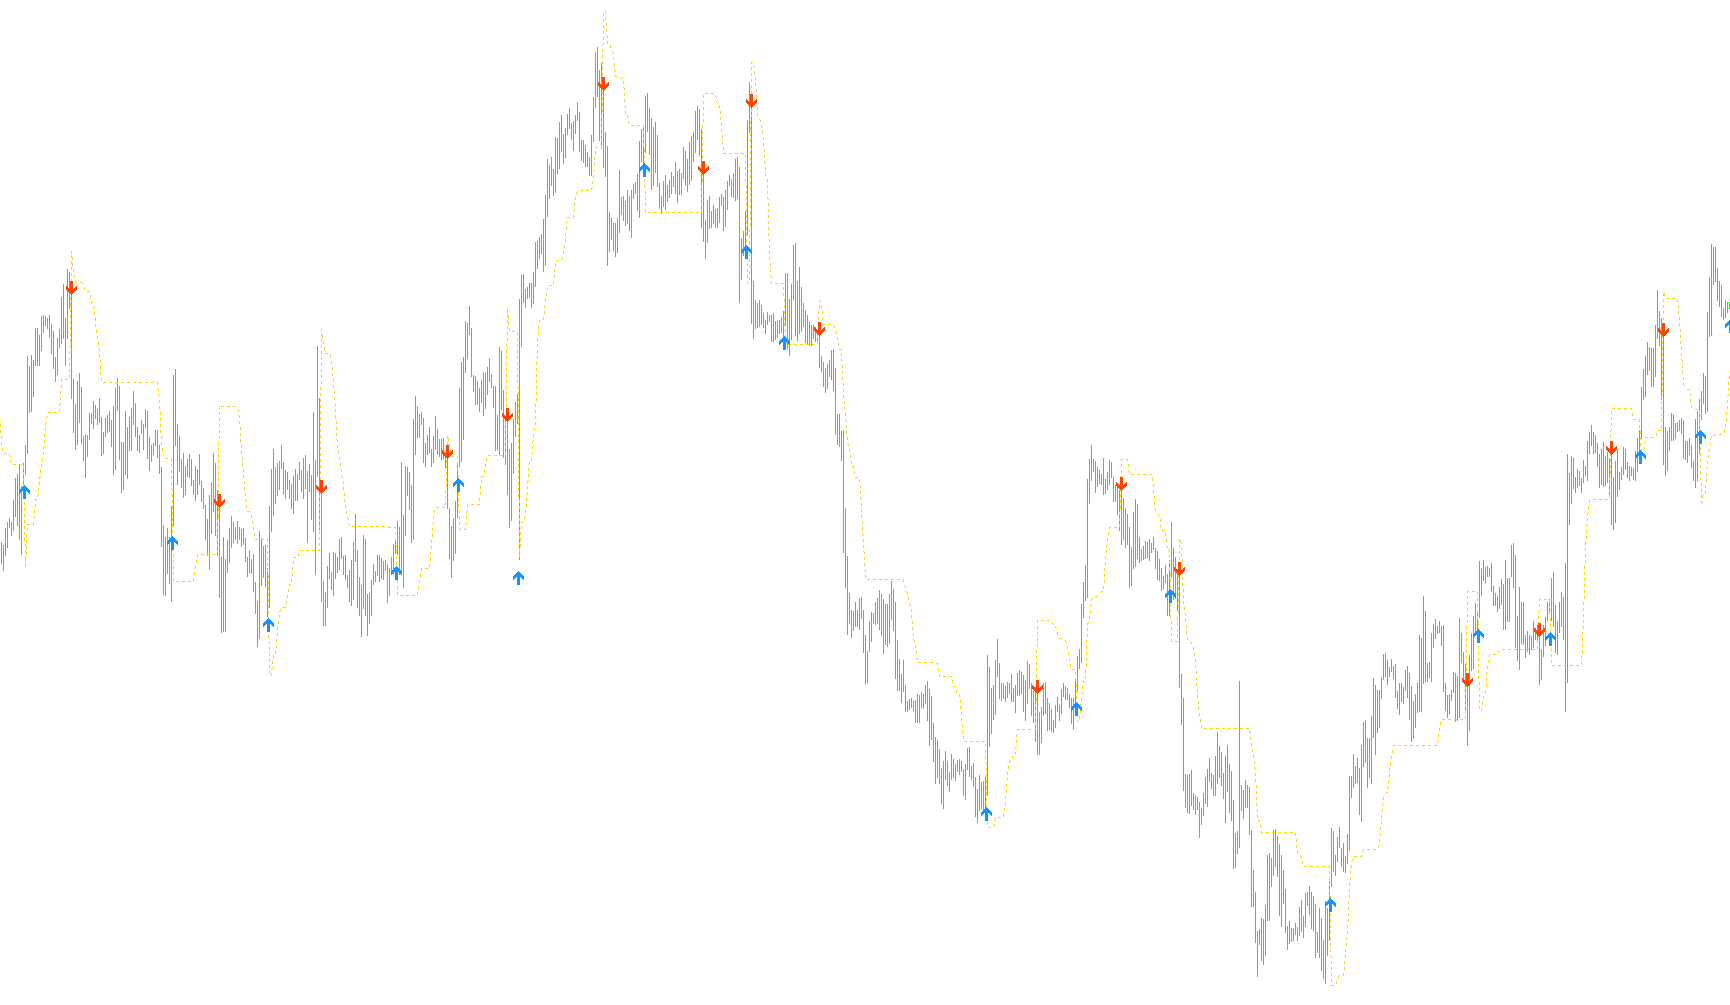
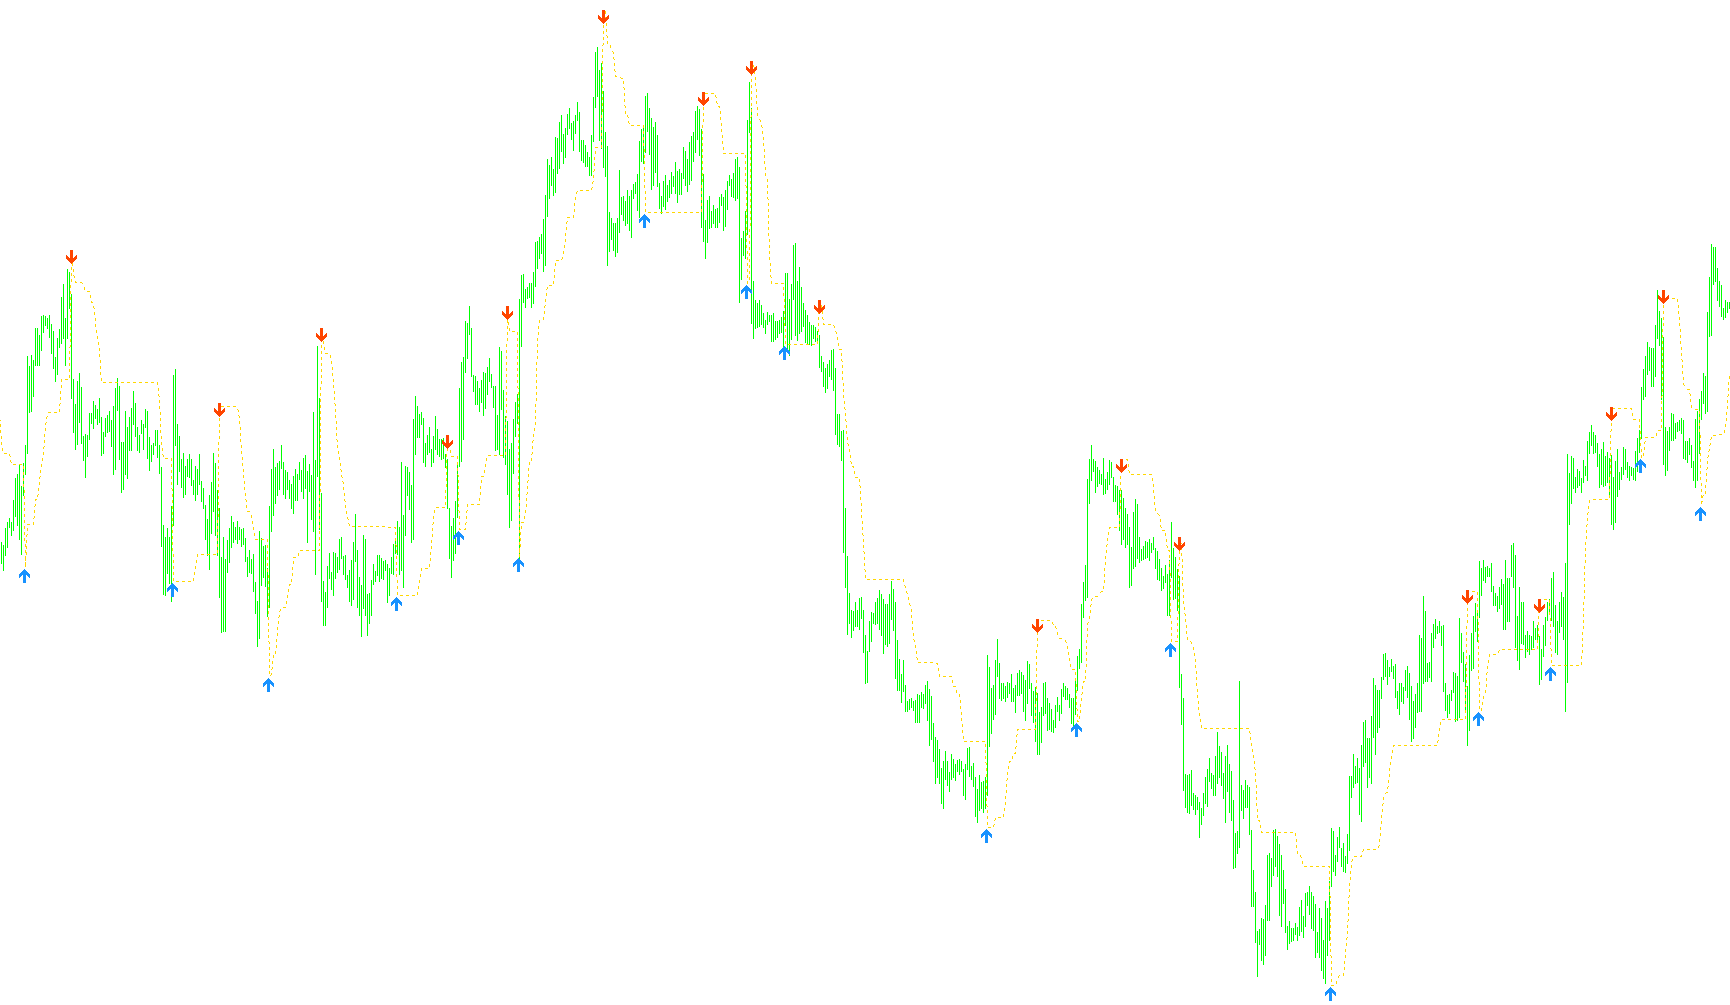
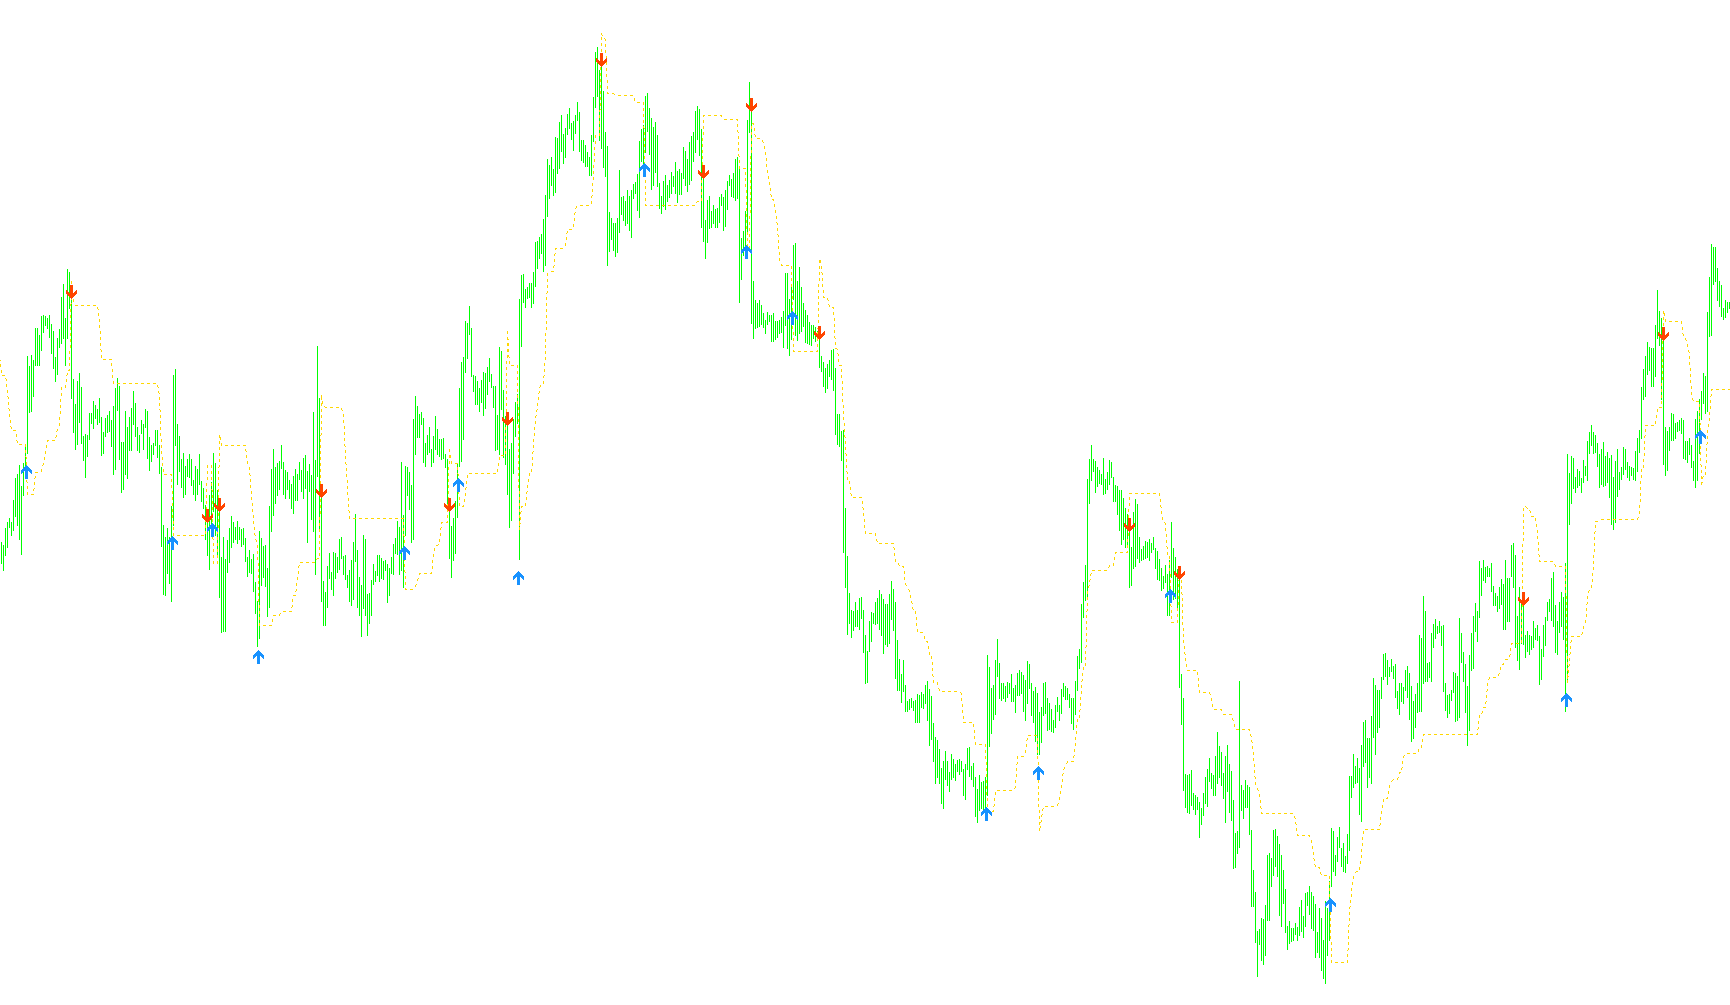
This indicator dynamically projects a trailing stop level based on smoothed ATR volatility or fixed pip offsets, triggering reversal signals when price breaks through the established threshold.

MT4-LevelStop-Reverse-v2
Indicator

MT4-LevelStop-Reverse-v2

iATRiMAOnArray

This system tracks volatility-adjusted price levels using smoothed Average True Range calculations to identify structural trend shifts and potential reversal entry points.

MT4-LevelStop-Reverse-v2_bar
Indicator

MT4-LevelStop-Reverse-v2_bar

iATRiMAOnArray

This indicator identifies trend exhaustion and reversal points by calculating a dynamic price threshold based on smoothed ATR volatility or fixed pip offsets.

MT4-LevelStop-Reverse-v2_bar_001
Indicator

MT4-LevelStop-Reverse-v2_bar_001

iATRiMAOnArray

This indicator identifies trend exhaustion and structural pivots by tracking price breaches of an adaptive volatility-based trailing stop line that adjusts dynamically via ATR smoothing or fixed pip offsets.

MT4-LevelStop-Reverse-vB0-2
Indicator

MT4-LevelStop-Reverse-vB0-2

iATRiMAOnArray

This indicator identifies trend reversals by calculating a dynamic stop line based on ATR-weighted volatility or fixed pip offsets, triggering visual signals when price momentum breaches these trailing levels.

MT4-LevelStop-Reverse-vB0-4
Indicator

MT4-LevelStop-Reverse-vB0-4

iATRiMAOnArray

This indicator dynamically projects a trailing stop level based on smoothed Average True Range or fixed pips, triggering visual reversal signals when price pierces the volatility boundary.

Indicator

MT4-LevelStop-Reverse-vB0-4_Alert_mtf

iATRiMAOnArray
MT4-LevelStop-Reverse
Indicator

MT4-LevelStop-Reverse

iATRiMAOnArray

This indicator calculates a dynamic trailing stop level based on smoothed ATR or fixed pips, generating reversal signals when price crosses the boundary.

Indicator

MT4_Reverse_Arrows

iATRiMAOnArray
MTF_MARSI_v0.10
Indicator

MTF_MARSI_v0.10

iMAOnArrayiRSI

This indicator synchronizes and displays smoothed Relative Strength Index values across six concurrent timeframes to identify multi-layered momentum trends.

MTF_MARSI_v0.10_001
Indicator

MTF_MARSI_v0.10_001

iMAOnArrayiRSI

This indicator synchronizes and displays real-time Relative Strength Index values and their moving average smoothed counterparts across six distinct timeframes simultaneously on a single dashboard.

MTF_MARSI_v0.20
Indicator

MTF_MARSI_v0.20

iMAOnArrayiRSI

This indicator synchronizes Relative Strength Index (RSI) data across six distinct timeframes into a single visual dashboard, applying moving average smoothing to identify momentum trends.

MTF_MARSI_v0.20_001
Indicator

MTF_MARSI_v0.20_001

iMAOnArrayiRSI

This indicator synchronizes and visualizes Relative Strength Index data across six concurrent timeframes (M1 to H4) using smoothed moving averages to identify cross- khung momentum.

MTF_MARSI_v0.20_v1
Indicator

MTF_MARSI_v0.20_v1

iMAOnArrayiRSI

This indicator synchronizes and overlays smoothed Relative Strength Index (RSI) values across six distinct timeframes simultaneously to visualize multi-layered momentum shifts and trend exhaustion.

Indicator

Multi pair RSI+EMA mtf

iMAOnArrayiRSI
Multi.Period.Stochastic
Indicator

Multi.Period.Stochastic

iMAOnArrayiStochastic

This indicator calculates a smoothed stochastic oscillator by fetching values from a higher timeframe and applying an additional moving average layer to filter noise.

Indicator

Multi_Oscillator_v1

iCCIiMFIiRSIiStochastic
MUV
Indicator

MUV

iMAOnArray

This indicator calculates a weighted mean of price extremes adjusted for candle directionality to generate a smoothed moving average of volatility intensity.

NeutralHedge osc_v3[1].1
Indicator

NeutralHedge osc_v3[1].1

iMAOnArrayiStdDevOnArray

This indicator quantifies the price discrepancy between a primary and secondary asset by normalizing their relative ranges and identifying statistically significant deviations using standard deviation thresholds.

ninetfmovement
Indicator

ninetfmovement

iWPRiMAOnArray

This indicator evaluates price action across nine concurrent timeframes to visualize high-low volatility ranges and detect synchronized bullish or bearish momentum shifts.

NonLag_ATR
Indicator

NonLag_ATR

iATRiMAOnArray

This indicator applies a low-latency, non-lagging smoothing algorithm to Average True Range data to identify structural volatility shifts and trend reversals.

NonLag_ATR_v2
Indicator

NonLag_ATR_v2

iATRiMAOnArray

This indicator calculates a non-lagging moving average of Average True Range values using a trigonometric weight distribution to identify trend shifts and volatility momentum.

NonLag_ATR_v3
Indicator

NonLag_ATR_v3

iATRiMAOnArray

This indicator calculates a weighted average of Average True Range values using a non-lagging mathematical coefficient to identify momentum shifts and trend reversals.

Indicator

NormalizedVolumeOscillator_v2

iMAOnArray
NormalizedVolume_v2
Indicator

NormalizedVolume_v2

iMAOnArray

This indicator calculates a ratio of current trading volume against its moving average to identify periods of abnormal liquidity activity.

NRMA
Indicator

NRMA

iMAOnArray

This indicator identifies momentum shifts by calculating price deviation thresholds and applying a smoothed power-ratio to generate a dynamic trend mapping.

NT_Trigger_Lines_Big_Recoded
Indicator

NT_Trigger_Lines_Big_Recoded

iMAOnArray

This indicator identifies trend shifts by detecting crossovers between a linear regression line and its corresponding exponential moving average.

NT_Trigger_Lines_Small_Recoded
Indicator

NT_Trigger_Lines_Small_Recoded

iMAOnArray

This indicator identifies trend momentum by plotting a linear regression line and calculating its exponential moving average to detect signal crossovers.

OBTR
Indicator

OBTR

iATRiMAOnArray

This indicator calculates a cumulative true range value that adjusts dynamically based on price direction, applying dual moving averages to identify trend exhaustion and momentum shifts.

Oscillator of ATR
Indicator

Oscillator of ATR

iMAOnArray

This indicator quantifies market momentum by calculating the differential between two moving averages of range-based price fluctuations.

PA IO detection v2
Indicator

PA IO detection v2

iATRiMAOnArray

This indicator identifies specific candlestick formations by filtering for inside bars, nested multi-bar contractions, and high-momentum outside bars based on ATR-adjusted price ranges.

PAX
Indicator

PAX

iMAOnArray

This indicator calculates a smoothed momentum signal by processing the relative difference between current and prior price averages, supplemented by EMA smoothing and threshold-based trend identification.

PeriodAdaptiveMA
Indicator

PeriodAdaptiveMA

iMAOnArray

Calculates a rolling moving average of price data exclusively for the current trading day, resetting its calculation buffer at each new daily open.

PFE
Indicator

PFE

iMAOnArray

This indicator quantifies price velocity by dividing the net displacement over a specific period by the cumulative absolute volatility of those same candles.

Polarized_Fractal_Efficiency
Indicator

Polarized_Fractal_Efficiency

iMAOnArray

Quantifies market momentum by comparing the hypotenuse of a macro price displacement against the cumulative sum of micro-price fluctuations.

PwR
Indicator

PwR

iBearsPoweriBullsPoweriMAOnArray

This indicator aggregates bullish and bearish power dynamics over a 144-period window to visualize sentiment shifts via histogram levels and smoothed moving averages.

Q(VolumeNorm)
Indicator

Q(VolumeNorm)

iMAOnArray

The indicator quantifies price action intensity relative to traded volume, applying a moving average to detect smoothed trend shifts and isolating directional pressure via dual-histogram buffers.

Q(VolumeNorm_High)
Indicator

Q(VolumeNorm_High)

iMAOnArray

This indicator calculates the price-to-volume ratio to identify directional pressure and visualizes momentum shifts through a dual-histogram separation.

Q(VolumeNorm_Low)
Indicator

Q(VolumeNorm_Low)

iMAOnArray

This indicator quantifies price action intensity by normalizing the variance between the opening and low prices against relative trading volume to identify momentum shifts.

QQE Spec
Indicator

QQE Spec

iMAOnArrayiRSI

The algorithm identifies trend direction by applying a double-smoothed exponential moving average to RSI deviations, utilizing a threshold-based logic to filter out market noise.

QQE with Alerts
Indicator

QQE with Alerts

iMAOnArrayiRSI

This indicator identifies trend exhaustion and momentum shifts by calculating a smoothed RSI derivative combined with a dynamic volatility-adjusted threshold.

QQE with Alerts_001
Indicator

QQE with Alerts_001

iMAOnArrayiRSI

This indicator identifies market momentum and trend reversals by calculating a smoothed RSI overlay with dynamic volatility-adjusted threshold levels.

QQE
Indicator

QQE

iMAOnArrayiRSI

This indicator synthesizes smoothed RSI values with an ATR-based volatility multiplier to construct a trailing dynamic threshold that filters market noise and identifies trend shifts.

QQEA
Indicator

QQEA

iMAOnArrayiRSI

This indicator calculates a smoothed price action threshold by dynamically adjusting RSI values with a volatility-based buffer to identify trend reversals and momentum exhaustion.

QQEA_001
Indicator

QQEA_001

iMAOnArrayiRSI

This indicator synthesizes Relative Strength Index (RSI) with exponential moving averages and ATR-based volatility scaling to generate a smoothed momentum trailing threshold.