Indicator

#MTF_zlagmacd

#MTF_zlagMACD_v2
Indicator

#MTF_zlagMACD_v2

This indicator synthesizes multi-timeframe MACD momentum data by applying a zero-lag smoothing algorithm and a configurable scaling multiplier to project higher-period trends onto the current chart.

#MTF_zlagMACD_v3
Indicator

#MTF_zlagMACD_v3

This indicator synchronizes a zero-lag MACD from higher timeframes onto the current chart while utilizing an automated scaling algorithm to normalize line amplitude.

Indicator

#Multi-MAX-Alerts

iMA
#MultiIndicator
Indicator

#MultiIndicator

iMACDiADXiMAiSAR
#NBS Juice
Indicator

#NBS Juice

iStdDev

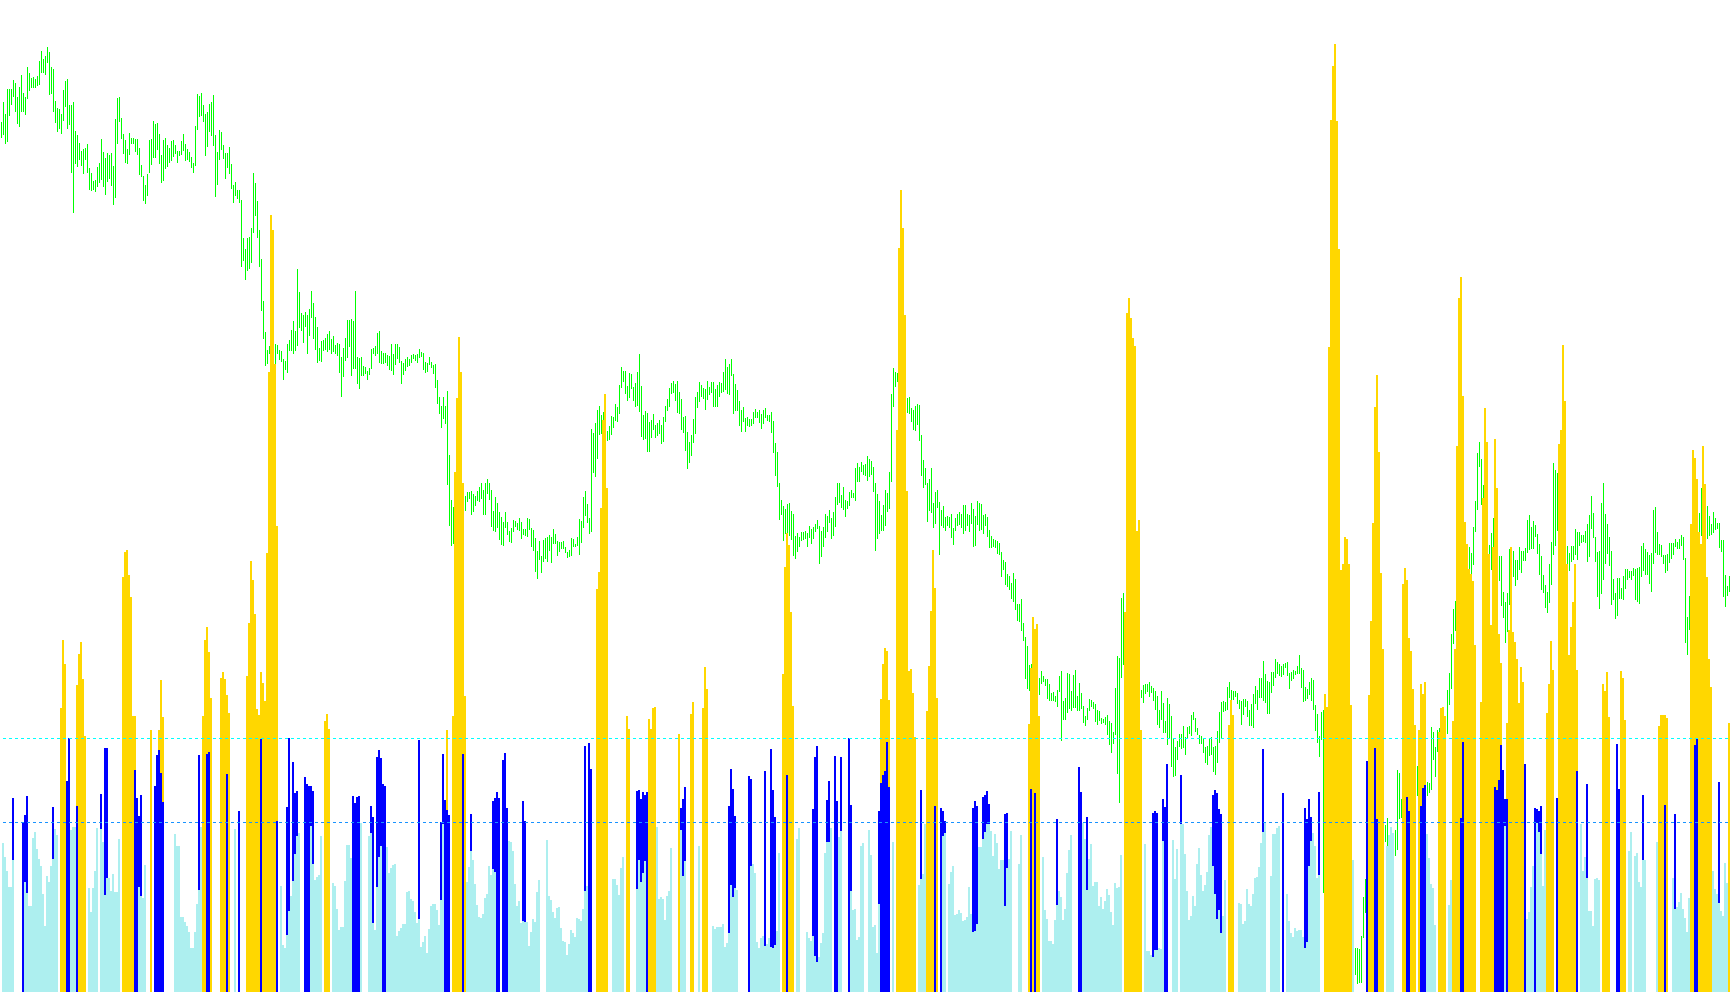
This indicator categorizes market volatility into three distinct intensity levels by comparing current Linear Weighted Moving Average standard deviation against a dynamic historical average threshold.

#OTCFX_MA_PRICEv1.1
Indicator

#OTCFX_MA_PRICEv1.1

iMA
#OTCFX_MA_PRICEv1
Indicator

#OTCFX_MA_PRICEv1

iMA
#Overlay_Chart
Indicator

#Overlay_Chart

This MetaTrader script overlays the price action of a specified secondary symbol onto the current chart, displaying it as candlesticks relative to the current chart's price range, along with a customizable grid.

#Pallada_Bars
Indicator

#Pallada_Bars

iCCIiForceiWPR
#Pallada_Entry
Indicator

#Pallada_Entry

iCCIiForceiWPR
#Parabolic 2TF
Indicator

#Parabolic 2TF

#Parabolic 4TF-1
Indicator

#Parabolic 4TF-1

#Parabolic 4TF
Indicator

#Parabolic 4TF

This indicator synchronizes Parabolic SAR trend signals across four distinct timeframes to identify high-probability directional bias and structural alignment.

#PNN_ARTIFICAL
Indicator

#PNN_ARTIFICAL

This code implements a feed-forward neural network architecture that utilizes Gaussian kernel functions to classify market data by calculating the probability density of test examples against pre-defined class patterns.

Indicator

#PNN_ARTIFICAL_N2

#Pretty_t3_LK_V1.2
Indicator

#Pretty_t3_LK_V1.2

iATRiMA

This indicator utilizes a triple-smoothed T3 moving average combined with an inverse Fisher transform on the rate of change to identify trend direction and intensity via a responsive RGB color shift.

#Pretty_t3_LK_V1.2_001
Indicator

#Pretty_t3_LK_V1.2_001

iATRiMA

This indicator utilizes a multi-stage recursive moving average combined with an Inverse Fisher Transform and ATR normalization to visualize real-time momentum shifts via dynamic color-coded gradients.

#RSI-3TF
Indicator

#RSI-3TF

iRSI

This indicator overlays and synchronizes Relative Strength Index values across three distinct timeframes onto a single visual window to identify multi-horizon momentum trends.

#Signal_Bars_info
Indicator

#Signal_Bars_info

This indicator aggregates real-time market data by calculating multi-period volatility averages, daily price fluctuations, and current spreads to provide a consolidated visual summary on the chart.

#SpudFibo alert v3
Indicator

#SpudFibo alert v3

This indicator identifies precise bullish and bearish entries by detecting price crossovers of extended Fibonacci expansion levels derived from previous period highs and lows.

#SpudFibo
Indicator

#SpudFibo

This script automatically maps daily high/low price boundaries onto the chart to project multi-level Fibonacci retracement and extension zones based on previous session extremes.

#SpudFibo_001
Indicator

#SpudFibo_001

This indicator dynamically plots multi-layered Fibonacci retracement levels based on previous day's high, low, and range data to identify structural support and resistance.

#SpudFibo_002
Indicator

#SpudFibo_002

This indicator dynamically plots multi-level Fibonacci retracement zones based on the high and low price boundaries of the previous trading day.

#SpudFibo_003
Indicator

#SpudFibo_003

This indicator dynamically projects triple-layered retracement levels based on previous daily price extremes, including specialized multi-extension bounds and intra-day range overlays.

#SpudFibo_004
Indicator

#SpudFibo_004

This indicator dynamically projects multi-level Fibonacci retracement and extension zones based on the previous day's price extremes.

#SpudFibo_006
Indicator

#SpudFibo_006

This indicator automatically calculates and plots Fibonacci retracement levels based on high and low price extremes from specific timeframes or custom session hours.

#SpudFibo_007
Indicator

#SpudFibo_007

This indicator automatically plots triple Fibonacci retracement levels based on previous daily price extremes to identify potential liquidity pullbacks and structural pivot points.

#SpudFibo_current
Indicator

#SpudFibo_current

This indicator automatically plots upward, downward, and internal Fibonacci retracement levels based on the previous day's high and low price action.

#SR_AlertSystem
Indicator

#SR_AlertSystem

This script triggers real-time auditory and visual notifications when the current market price pierces predefined horizontal resistance or support boundaries.

#Stochastic_Cross_Alert_SigOverlayM_cw
Indicator

#Stochastic_Cross_Alert_SigOverlayM_cw

iStochastic

This indicator identifies potential reversal points by detecting specific momentum shifts when the stochastic oscillator crosses defined overbought/oversold thresholds or intersects its signal line.

#Stochastic_Cross_Alert_SigOverlayM_cw_001
Indicator

#Stochastic_Cross_Alert_SigOverlayM_cw_001

iStochastic

This indicator identifies directional shifts by detecting K and D line intersections coupled with threshold breaches in overbought and oversold zones.

#stoplevelinfo
Indicator

#stoplevelinfo

Dynamically calculates the maximum permissible trade volume based on available account equity while accounting for required margins and real-time spread constraints.

#Super Signal v3f
Indicator

#Super Signal v3f

iATR

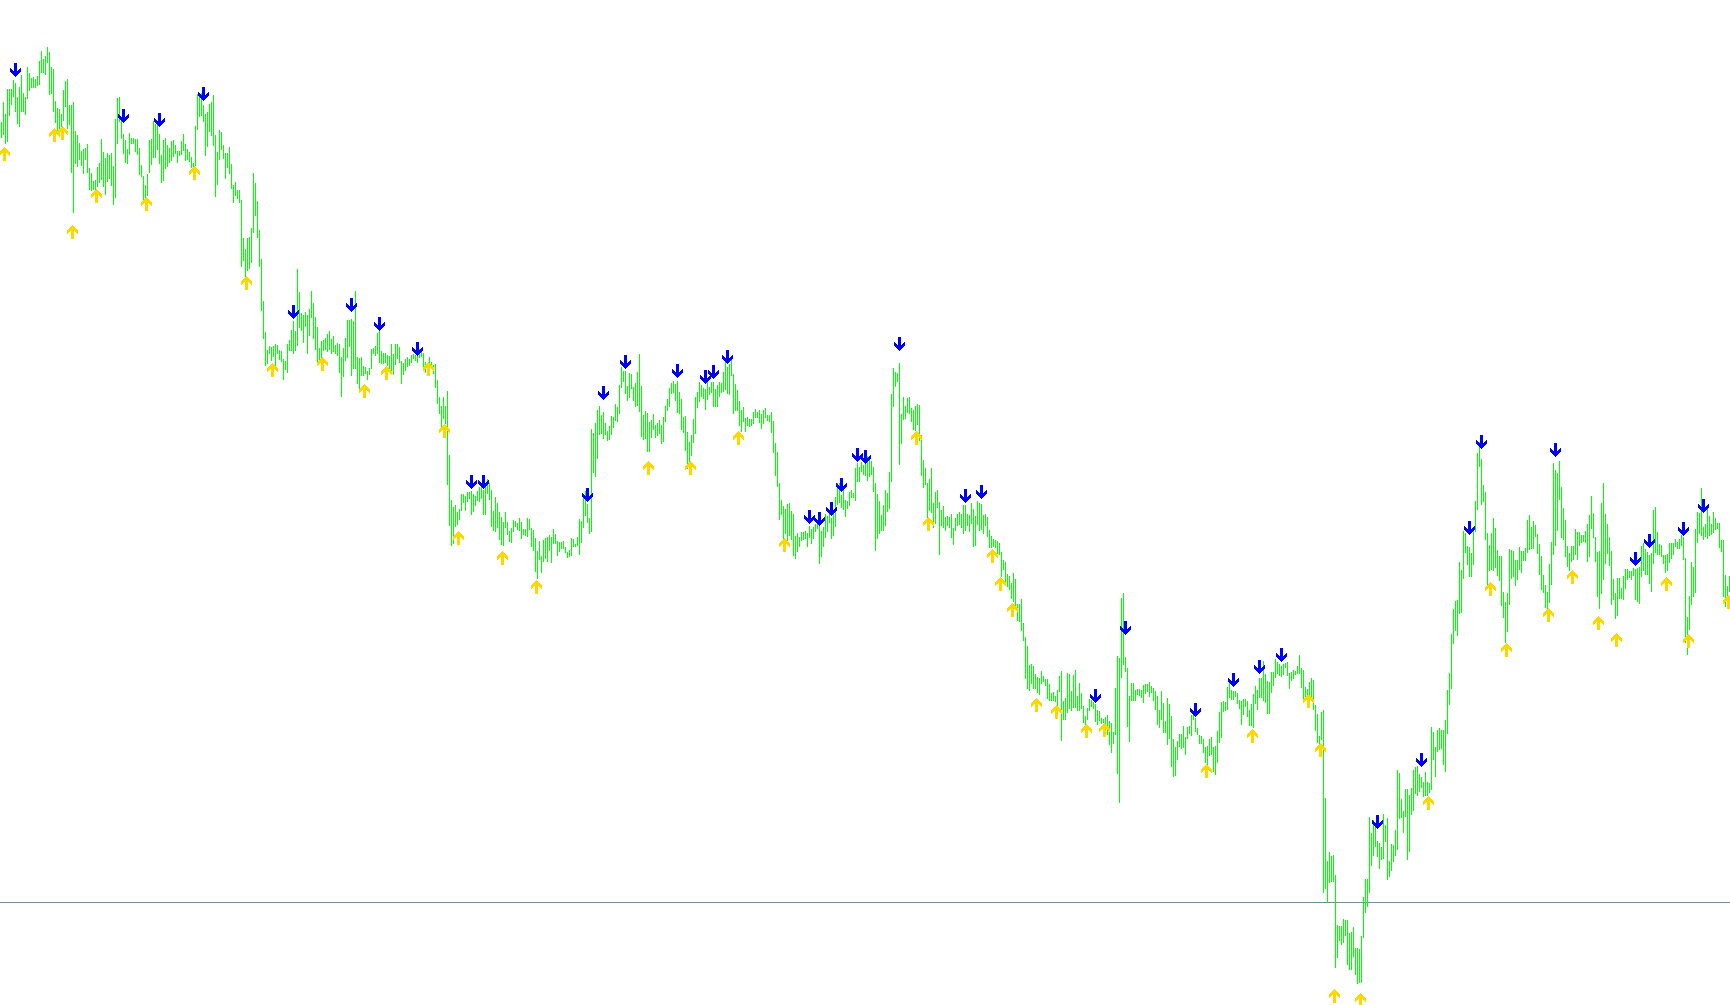
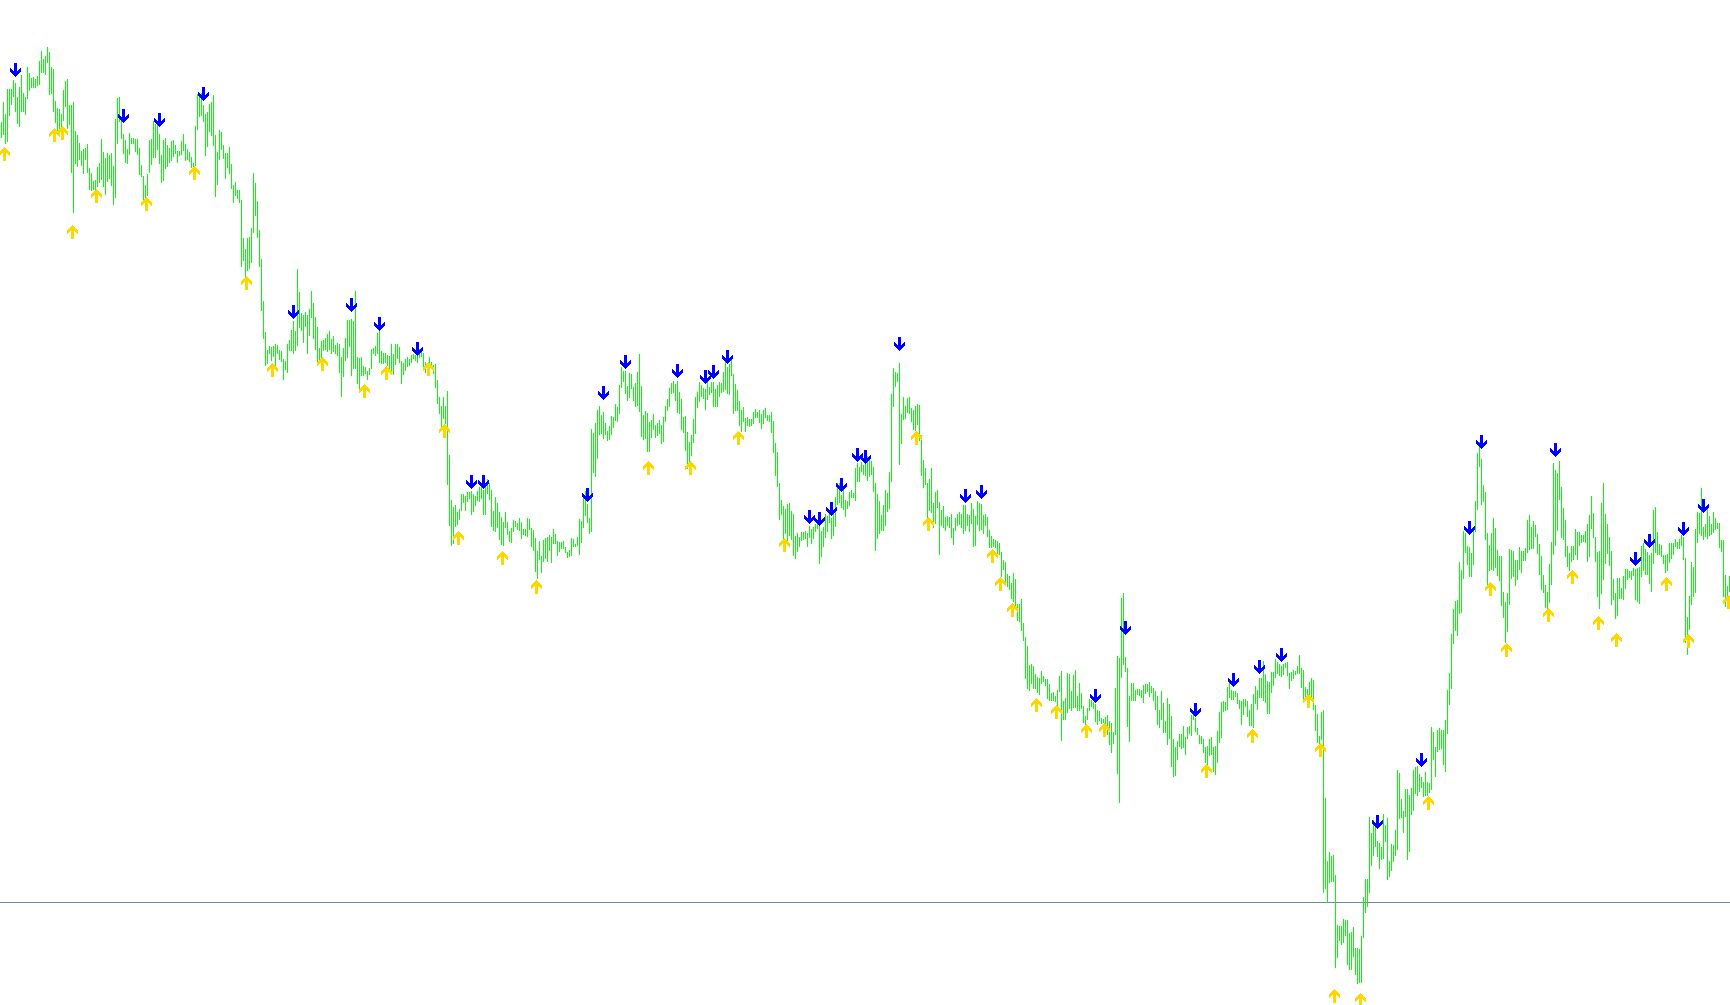
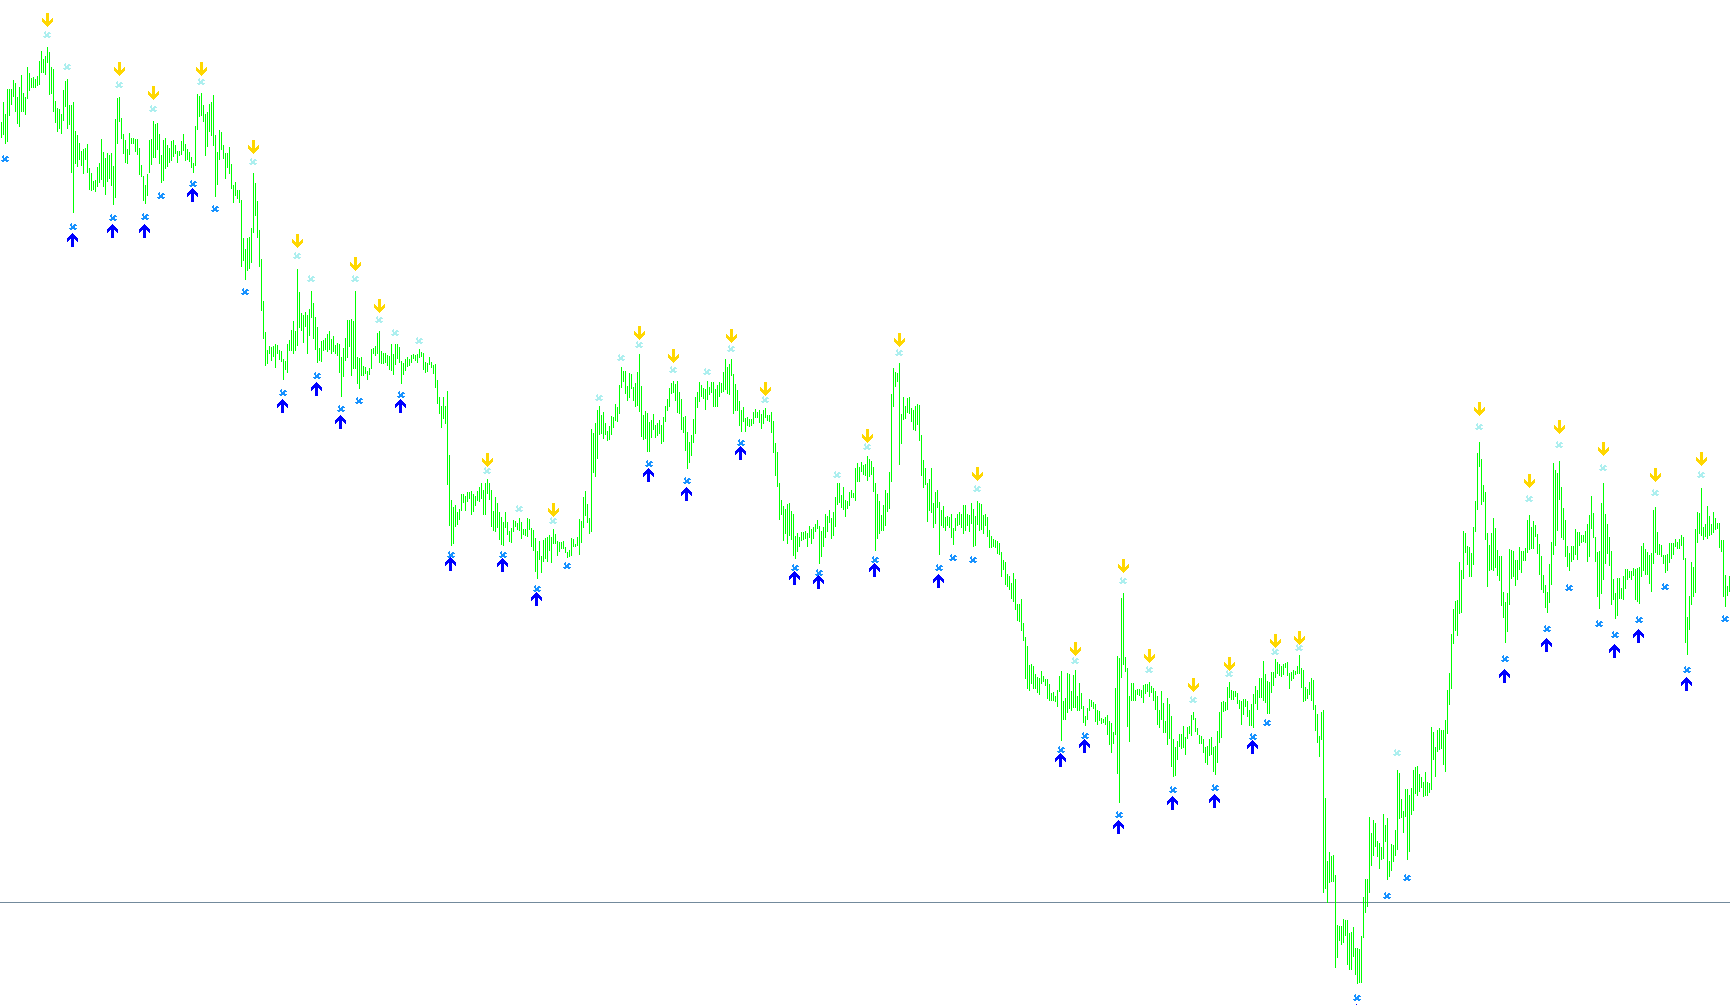
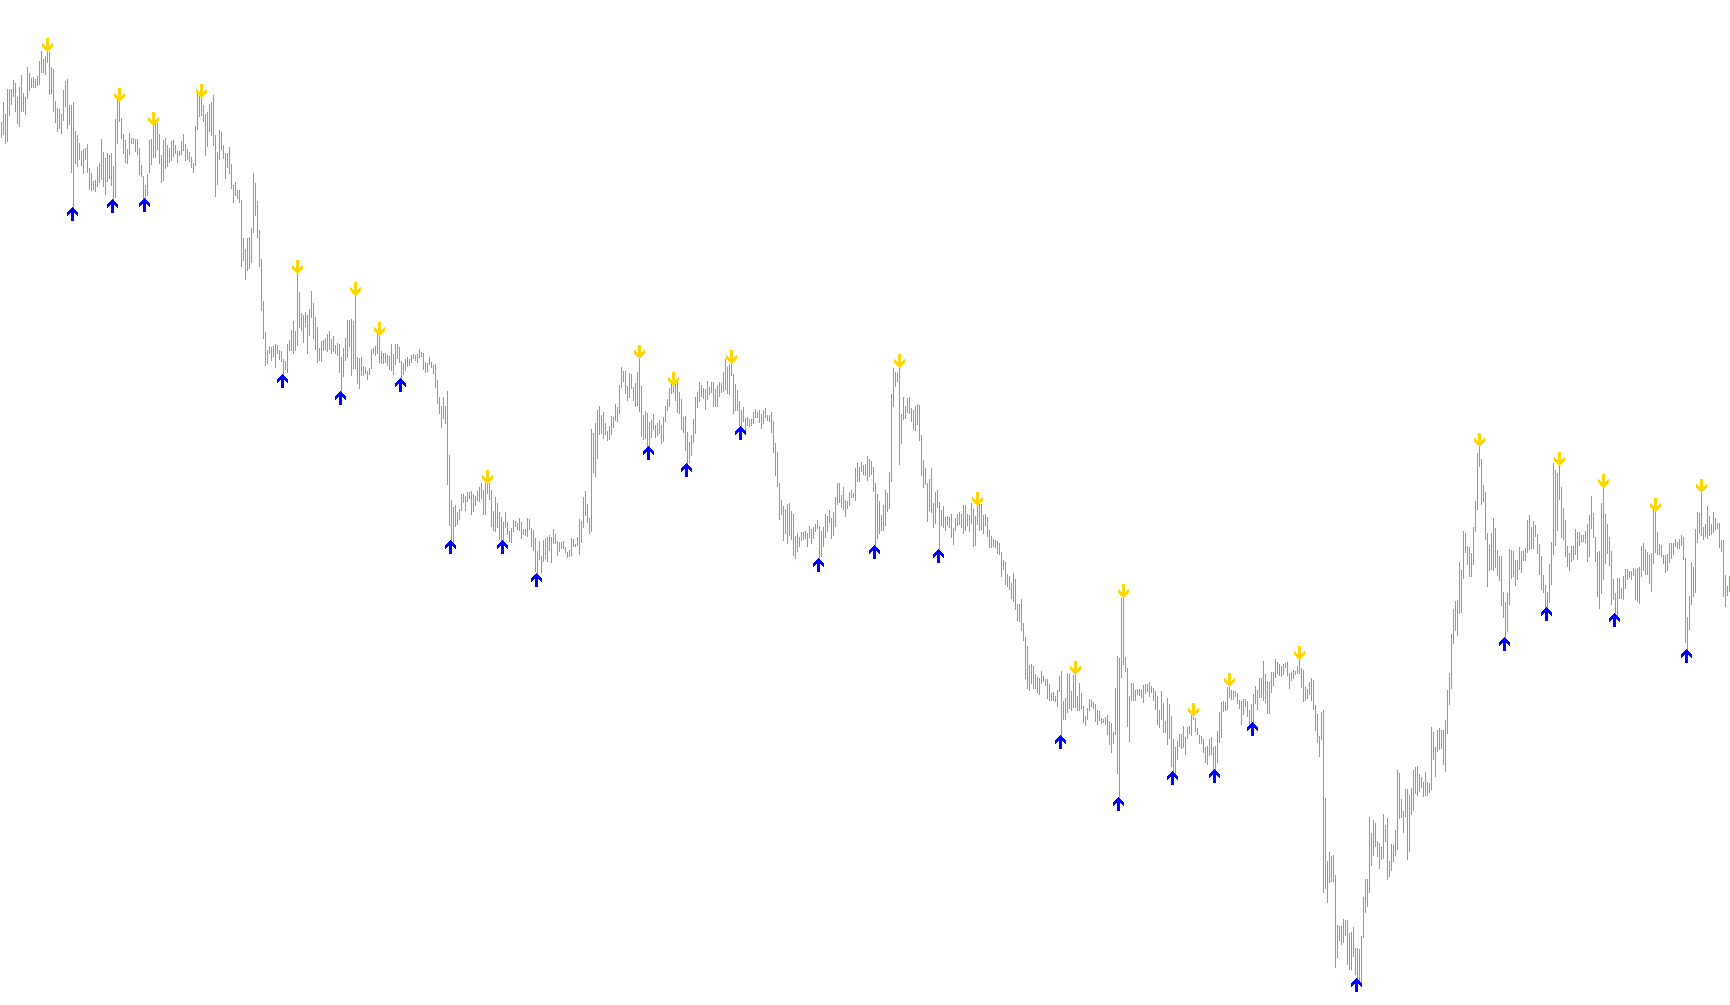
This indicator identifies potential price reversals by detecting nested high and low peaks across two distinct lookback windows, utilizing Average True Range offsets to project signal arrows.

#super-signals_v2
Indicator

#super-signals_v2

This indicator identifies local price extremes by scanning for the highest highs and lowest lows within a dynamic lookback window to plot directional reversals.

#SVM_b4_dd_pred0
Indicator

#SVM_b4_dd_pred0

This indicator retrieves and visualizes pre-trained LibSVM machine learning model outputs to identify high-probability price action coordinates.

#SVM_b4_dd_pred0_
Indicator

#SVM_b4_dd_pred0_

This indicator visualizes momentum shifts by mapping specific RSI threshold values to a multi-layered color histogram, identifying bearish, bullish, and neutral market zones simultaneously.

#SVM_b4_dd_pred1
Indicator

#SVM_b4_dd_pred1

The logic executes a multi-window predictive analysis by extracting external pre-calculated LibSVM classification data to map historical price points onto specific future temporal offsets.

#SVM_b4_dd_pred1_
Indicator

#SVM_b4_dd_pred1_

A multi-layered visual analytics tool that decodes momentum intensity and directional bias by mapping external RSI data into a color-coded histogram grid.

#SVM_b4_dd_pred2
Indicator

#SVM_b4_dd_pred2

This indicator extracts external machine learning predictions from localized .libsvm CSV files to project price movements based on historical data mapping and temporal alignment.

#SVM_b4_dd_pred2_
Indicator

#SVM_b4_dd_pred2_

This indicator translates specific relative strength index thresholds into a multi-colored histogram to visually map bullish, bearish, and neutral market regimes.
#SVM_b4_dd_pred3
Indicator

#SVM_b4_dd_pred3

This indicator retrieves and parses pre-calculated machine learning prediction data from external CSV files to project future price signals based on historical temporal patterns.

#SVM_b4_dd_pred3_
Indicator

#SVM_b4_dd_pred3_

This indicator visualizes multi-layered momentum shifts by mapping specific relative strength values to a color-coded histogram of directional intensities.

#SVM_b4_dd_pred4
Indicator

#SVM_b4_dd_pred4

This indicator retrieves and processes external machine learning prediction files to identify specific price action signals based on historical data synchronization.

#SVM_b4_dd_pred4_
Indicator

#SVM_b4_dd_pred4_

This indicator decodes external SVM-based RSI data into a multi-layered color histogram to visualize trend momentum, strength, and ranging conditions simultaneously.

#SVM_b4_dd_pred5
Indicator

#SVM_b4_dd_pred5

This indicator retrieves and processes pre-trained Support Vector Machine (SVM) prediction data from local CSV files to project historical price movements based on multi-period future window parameters.

#SVM_b4_dd_pred5_
Indicator

#SVM_b4_dd_pred5_

This indicator captures and visualizes directional momentum by mapping specific Relative Strength Index (RSI) threshold levels into a multi-colored histogram grid.

#SVM_b4_dd_pred8
Indicator

#SVM_b4_dd_pred8

This indicator retrieves and visualizes pre-trained Support Vector Machine (SVM) predictions from external CSV files to identify high-probability price targets based on historical training data.

#TickA_SineWaveIndicator
Indicator

#TickA_SineWaveIndicator

This indicator utilizes Fourier analysis to calculate the instantaneous phase and cyclical sine waves of price action, providing a leading visual representation of momentum through shifted trigonometric overlays.

#TickA_SineWavePeriods
Indicator

#TickA_SineWavePeriods

This indicator utilizes Hilbert Transform phase analysis to calculate the instantaneous dominant cycle period of price action.