#_LinRegres_Neuro_GA
Indicator

#_LinRegres_Neuro_GA

iMAiStdDev

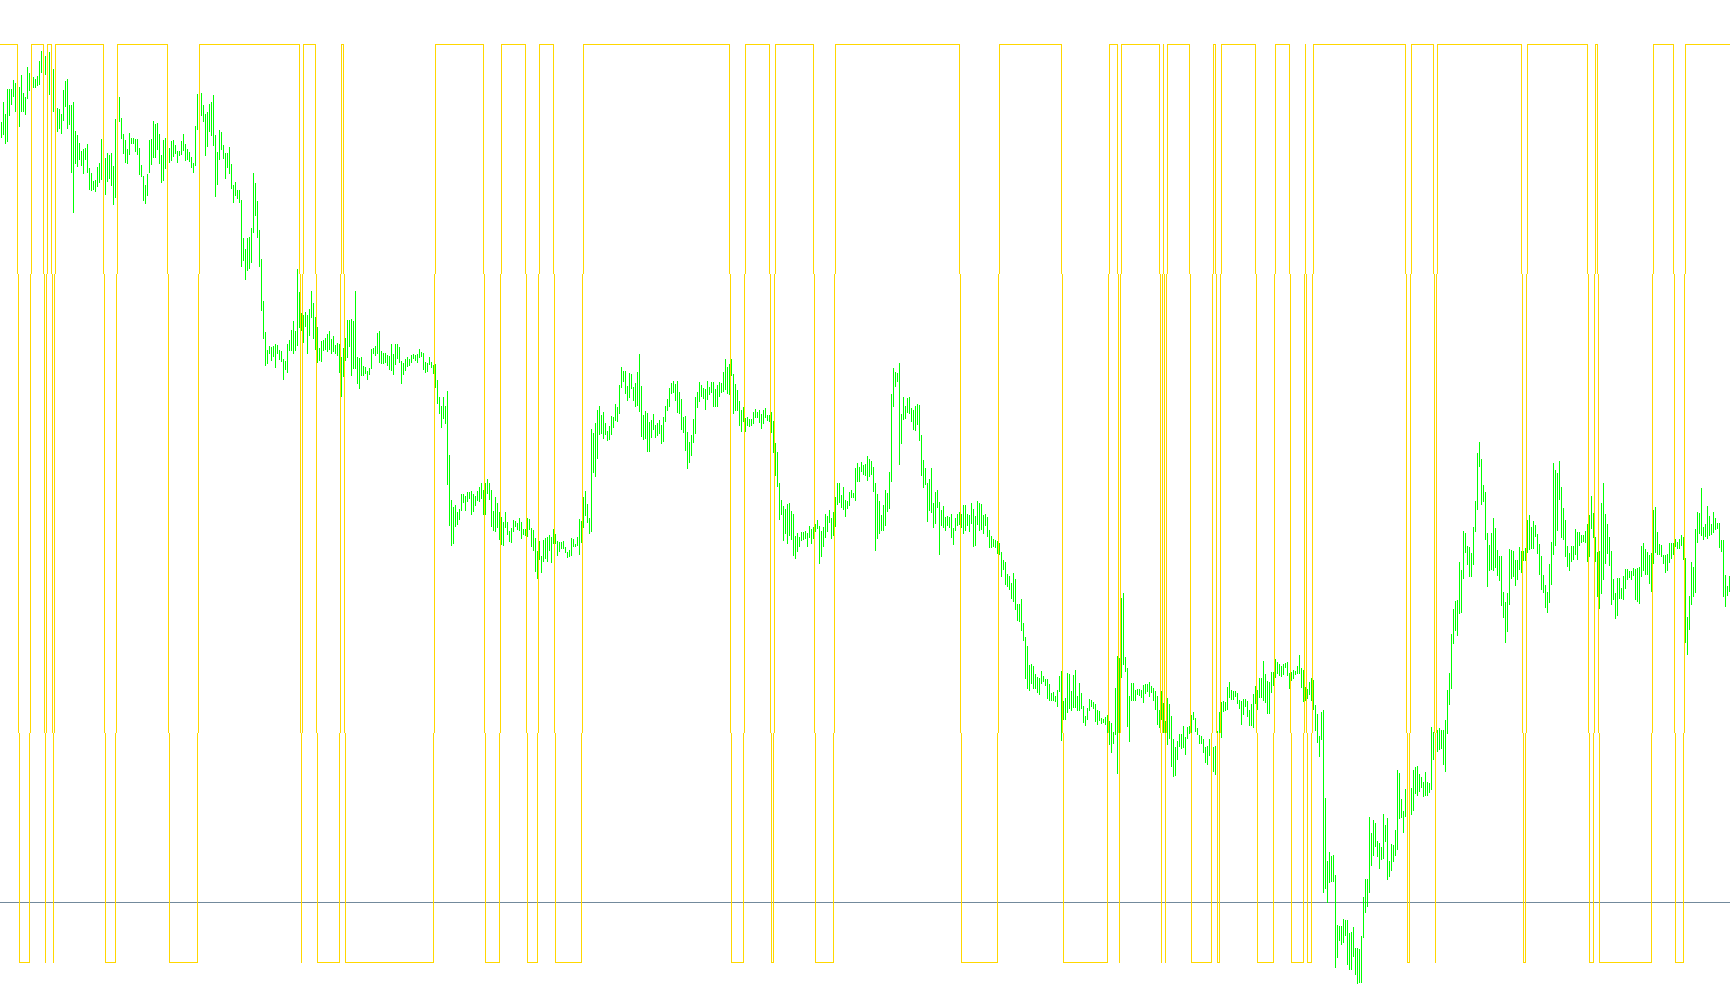
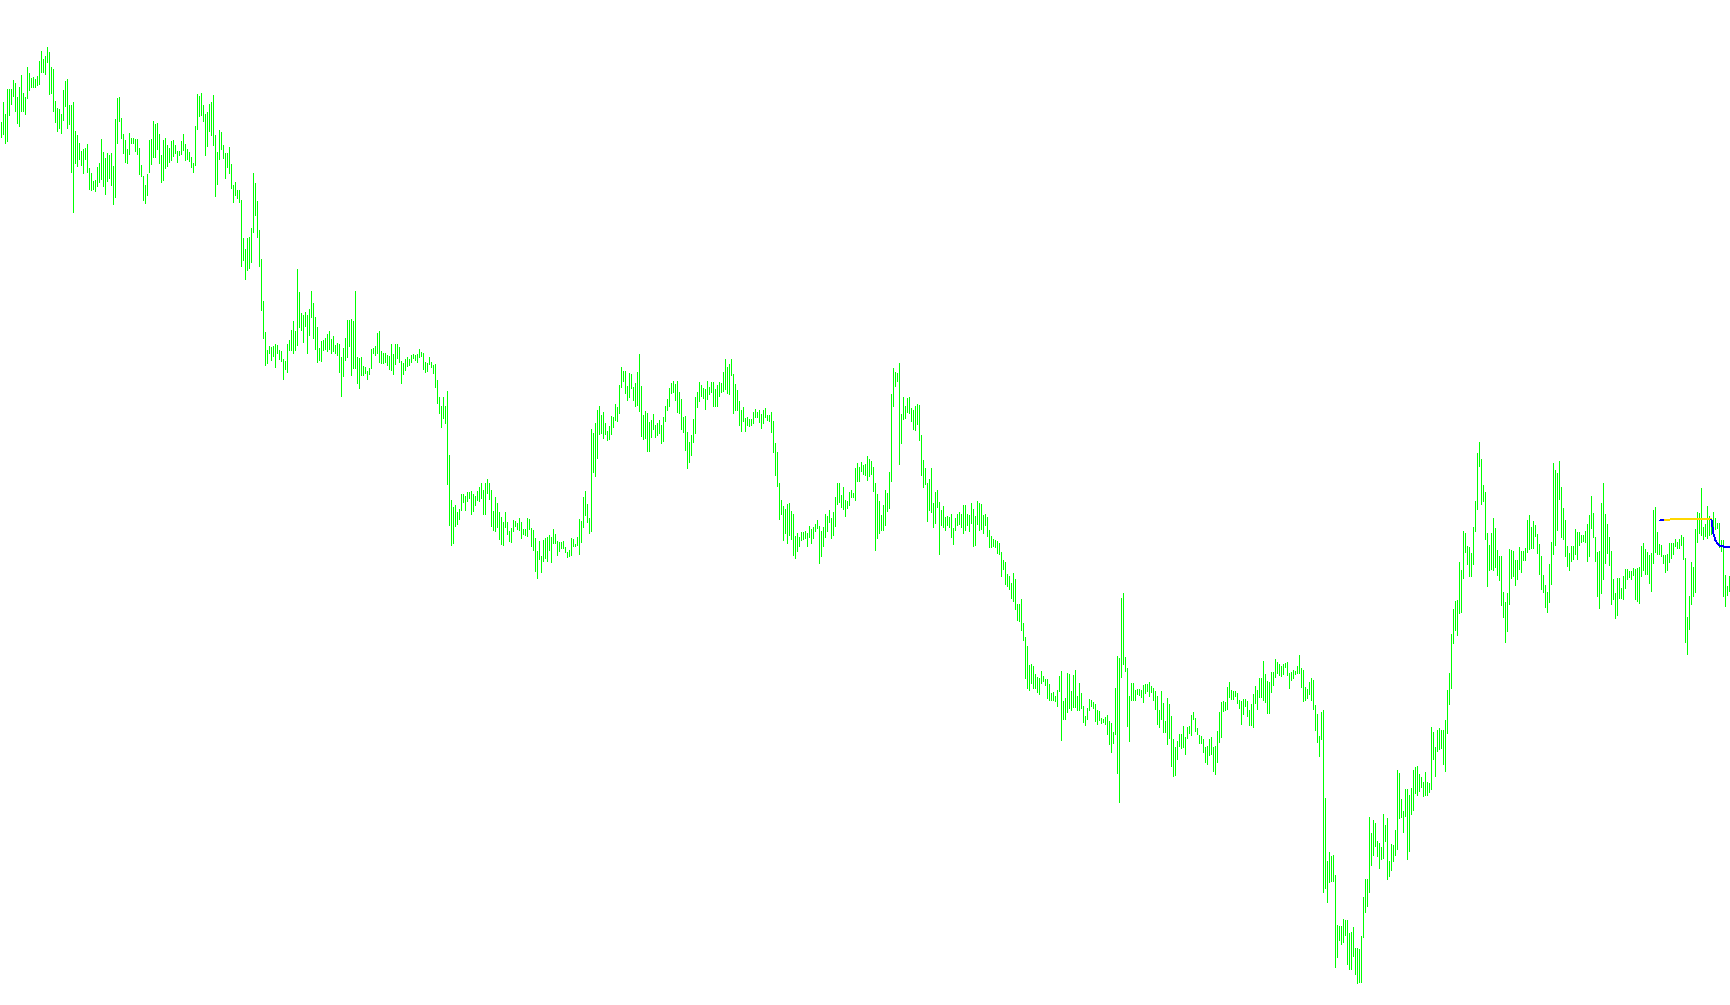
This indicator utilizes a genetic algorithm to optimize the weights of a two-layer artificial neural network that processes multiple linear regression slopes to generate smoothed trend signals.

$$ATM_Daily_HML
Indicator

$$ATM_Daily_HML

This indicator dynamically renders historical and real-time price corridors by calculating high-low extremes, median levels, and session-specific breakout zones based on user-defined time coordinates.

$BBS
Indicator

$BBS

iATRiMAiStdDev
$BIAS
Indicator

$BIAS

iMA

This indicator quantifies market sentiment by comparing the current closing price against a fast exponential moving average to determine directional strength and trend progression.

$camarilladt7v1
Indicator

$camarilladt7v1

This indicator projects historical price volatility into future horizontal levels by synthesizing Camarilla breakout targets, standard pivot points, and multi-stage Fibonacci retracements.

$CDL
Indicator

$CDL

This indicator quantifies price action by assigning a discrete numerical polarity to each bar based on whether the closing price is higher, lower, or equal to the opening price.

$HIGH
Indicator

$HIGH

This indicator maps price action polarity by comparing current closing prices against the preceding candle's high to identify breakout trends.

$LOW
Indicator

$LOW

The indicator maps price action by assigning a positive value when the current close exceeds the prior bar's low and a negative value when it falls below it.
$MID
Indicator

$MID

This indicator identifies market sentiment by quantifying whether the current closing price resides above or below the previous bar's median price level.

Indicator

$MTF_TradeWhatYouSee

$OPEN
Indicator

$OPEN

The indicator identifies directional bias by comparing the current closing price against the previous bar's opening price to generate binary momentum values.

$ROLLING_RANGE
Indicator

$ROLLING_RANGE

This indicator quantifies the absolute price deviation between the current closing price and the opening price of a specific historical bar, converted into point units.

$TrillionDollarDays
Indicator

$TrillionDollarDays

A multi-period structural analyzer that projects historical price boundaries and dynamic alert bands based on specific time-segmented volatility.

$TrillionDollarDaysHL
Indicator

$TrillionDollarDaysHL

This indicator dynamically maps historical high-low price action into discrete time periods to visualize breakout zones and session volatility.

$TrillionDollarDaysHML
Indicator

$TrillionDollarDaysHML

Identifies multi-period price extremes and volatility boundaries by plotting historical high-low boxes and median levels across customizable timeframes.

$TrillionDollarDays_v1
Indicator

$TrillionDollarDays_v1

This indicator visualizes multi-period price action by plotting historical high-low boundaries, open/close levels, and specific breakout bands across customizable timeframes.

$TrillionEntryBoxes
Indicator

$TrillionEntryBoxes

This indicator visualizes specific trading windows by plotting colored rectangular zones that automatically highlight high and low price ranges across multiple predefined daily periods.

$TrillionStrategySessions
Indicator

$TrillionStrategySessions

This indicator identifies key price levels by calculating dynamic midpoints, open prices, and historical boundaries derived from prior session ranges and high-low volatility.

$TrillionStrategySessions_v1
Indicator

$TrillionStrategySessions_v1

This indicator maps significant price levels by calculating session-based pivot points, historical highs/lows, and previous session boundaries using specific volatility multipliers.

$_MT4-Psychological
Indicator

$_MT4-Psychological

Quantifies market sentiment by calculating the percentage of upward price movements over a specific lookback period to identify trend dominance.

%BB
Indicator

%BB

iBands
Indicator

%change + correlation[]

(()) IREMOS Audible Entry Alert
Indicator

(()) IREMOS Audible Entry Alert

iStochastic

This indicator monitors K and D line dynamics to trigger real-time alerts based on specific overbought/oversold thresholds and momentum crossover events.

(2) super-signals_v1
Indicator

(2) super-signals_v1

Identifies localized price extremes by locating the highest and lowest points within a specific rolling price window.

(3) TEST_BARS_GBPJPY_8v1_High
Indicator

(3) TEST_BARS_GBPJPY_8v1_High

This indicator evaluates synchronized directional signals across multiple currency pairs (EURJPY, GBPJPY, USDJPY, GBPUSD) using RSI momentum and ADX trend strength to identify high-probability cluster entries.

(3) TEST_BARS_GBPJPY_8v1_High_en
Indicator

(3) TEST_BARS_GBPJPY_8v1_High_en

This indicator identifies high-probability price action by synchronizing RSI momentum and ADX trend strength across EURJPY, GBPJPY, USDJPY, and GBPUSD pairs simultaneously.

(3) TEST_BARS_GBPJPY_8v1_Low
Indicator

(3) TEST_BARS_GBPJPY_8v1_Low

iWPRiMomentumiRSIiStochastic
(3) TEST_BARS_GBPJPY_8v1_Low_en
Indicator

(3) TEST_BARS_GBPJPY_8v1_Low_en

iWPRiMomentumiRSIiStochastic
(IsConnected)
Indicator

(IsConnected)

Monitors real-time broker connection status and archives chronological uptime and downtime durations into a dedicated text file.

(M) Moving Averages
Indicator

(M) Moving Averages

A versatile technical analysis tool that computes four distinct types of moving averages—Simple, Exponential, Smoothed, and Linear Weighted—to identify price momentum and trend direction.

(m)_Dinap tar. zig zag
Indicator

(m)_Dinap tar. zig zag

Identifies structural price extremes by detecting localized high and low pivots based on a lookback period to map significant reversal points.

(m)_Pivot_line
Indicator

(m)_Pivot_line

This indicator calculates standard pivot levels and three tiers of support and resistance by analyzing the previous day's price extremes and closing values to identify structural equilibrium points.

(Plagiat)
Indicator

(Plagiat)

iMAiMAOnArray

This indicator calculates a smoothed momentum signal by applying a weighted moving average to the difference between two nested Hull-style moving averages to identify trend reversals.

Indicator

(T_S_R) SIGNAL Alert Alarm GMT_Shift

iMA
Indicator

(T_S_R) SIGNAL Alert_Alarm #7

iMA
(T_S_R)-BAR Trend
Indicator

(T_S_R)-BAR Trend

This indicator calculates smoothed Heiken Ashi price action by averaging open, high, low, and close values to filter market noise and highlight underlying trend momentum.

(T_S_R)-Daily Range Calculator
Indicator

(T_S_R)-Daily Range Calculator

iMA

This indicator calculates multi-period daily price ranges to derive an average volatility metric, projecting potential room for movement and suggesting optimal stop-loss levels based on a user-defined risk-to-reward ratio.

Indicator

(T_S_R)-Daily Range Calculator v1[1].3

(T_S_R)-Daily Range Calculator
Indicator

(T_S_R)-Daily Range Calculator

iMA

This indicator calculates rolling average daily ranges across multiple timeframes to project real-time potential price movement and determine risk-adjusted stop-loss coordinates.

(T_S_R)-Daily Range Display#2a
Indicator

(T_S_R)-Daily Range Display#2a

This indicator projects multi-layered price envelopes based on a rolling average of historical daily high-low ranges to visualize potential liquidity boundaries.

Indicator

(T_S_R)-Daily Range Display#2a_O_C_W

Indicator

(T_S_R)-Daily Range Display#4_TEXTSHIFT

iMA
Indicator

(T_S_R)-DATA WINDOW#2

iMA
(T_S_R)-Execute Line 2
Indicator

(T_S_R)-Execute Line 2

iMAiMAOnArray

This indicator calculates the trend trajectory by processing the variance between dual weighted moving averages to generate a smoothed directional slope.

(T_S_R)range2
Indicator

(T_S_R)range2

iMA

This indicator calculates multi-period daily price ranges to project potential volatility and dynamically determine risk-adjusted stop-loss levels based on a user-defined reward-to-risk ratio.

(T_S_R)range2 _new
Indicator

(T_S_R)range2 _new

iMA

This indicator calculates multi-period daily price ranges to project potential overhead room and determine automated stop-loss levels based on a user-defined risk-to-reward ratio.

+ADR (1_5_10_20_60)
Indicator

+ADR (1_5_10_20_60)

This indicator calculates multi-period average daily ranges and dynamically computes potential stop-loss levels based on specific volatility retracements.

+ADR (All_pairs)
Indicator

+ADR (All_pairs)

This indicator calculates multi-period Average Daily Ranges and dynamically computes stop-loss levels based on specific volatility coefficients and user-defined risk-to-reward ratios.

Indicator

+Clock v1_2

Indicator

+Clock v1_2_v1