+dot
Indicator

+dot

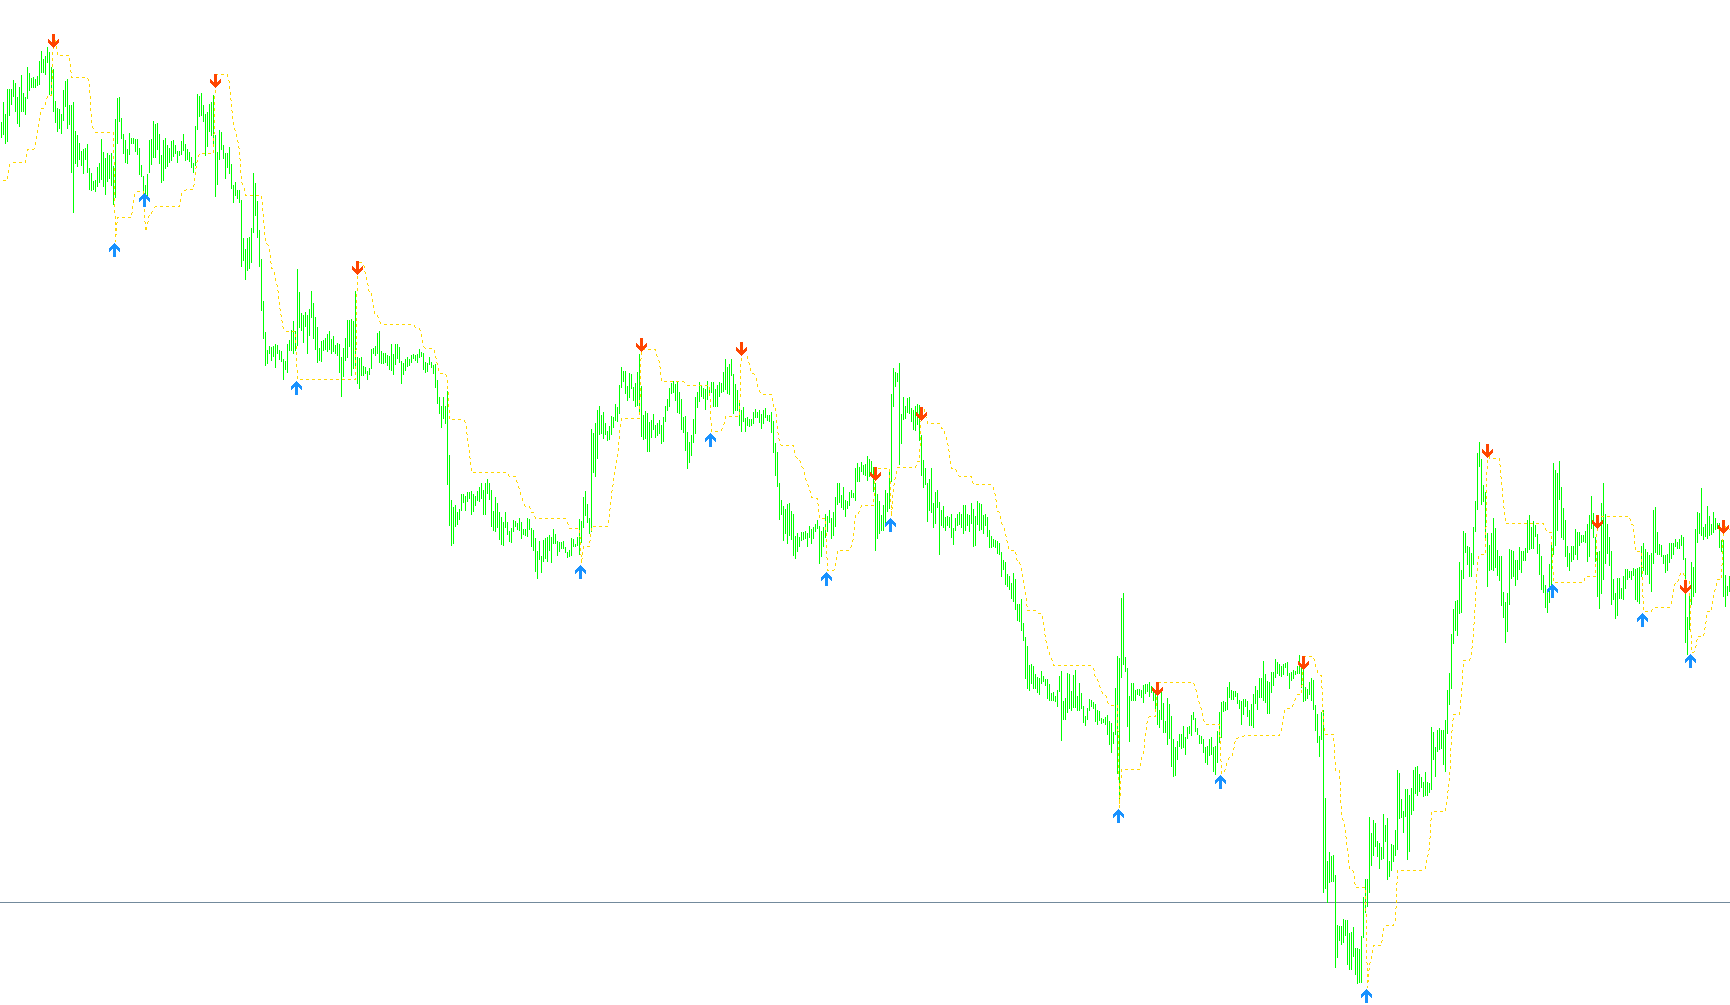
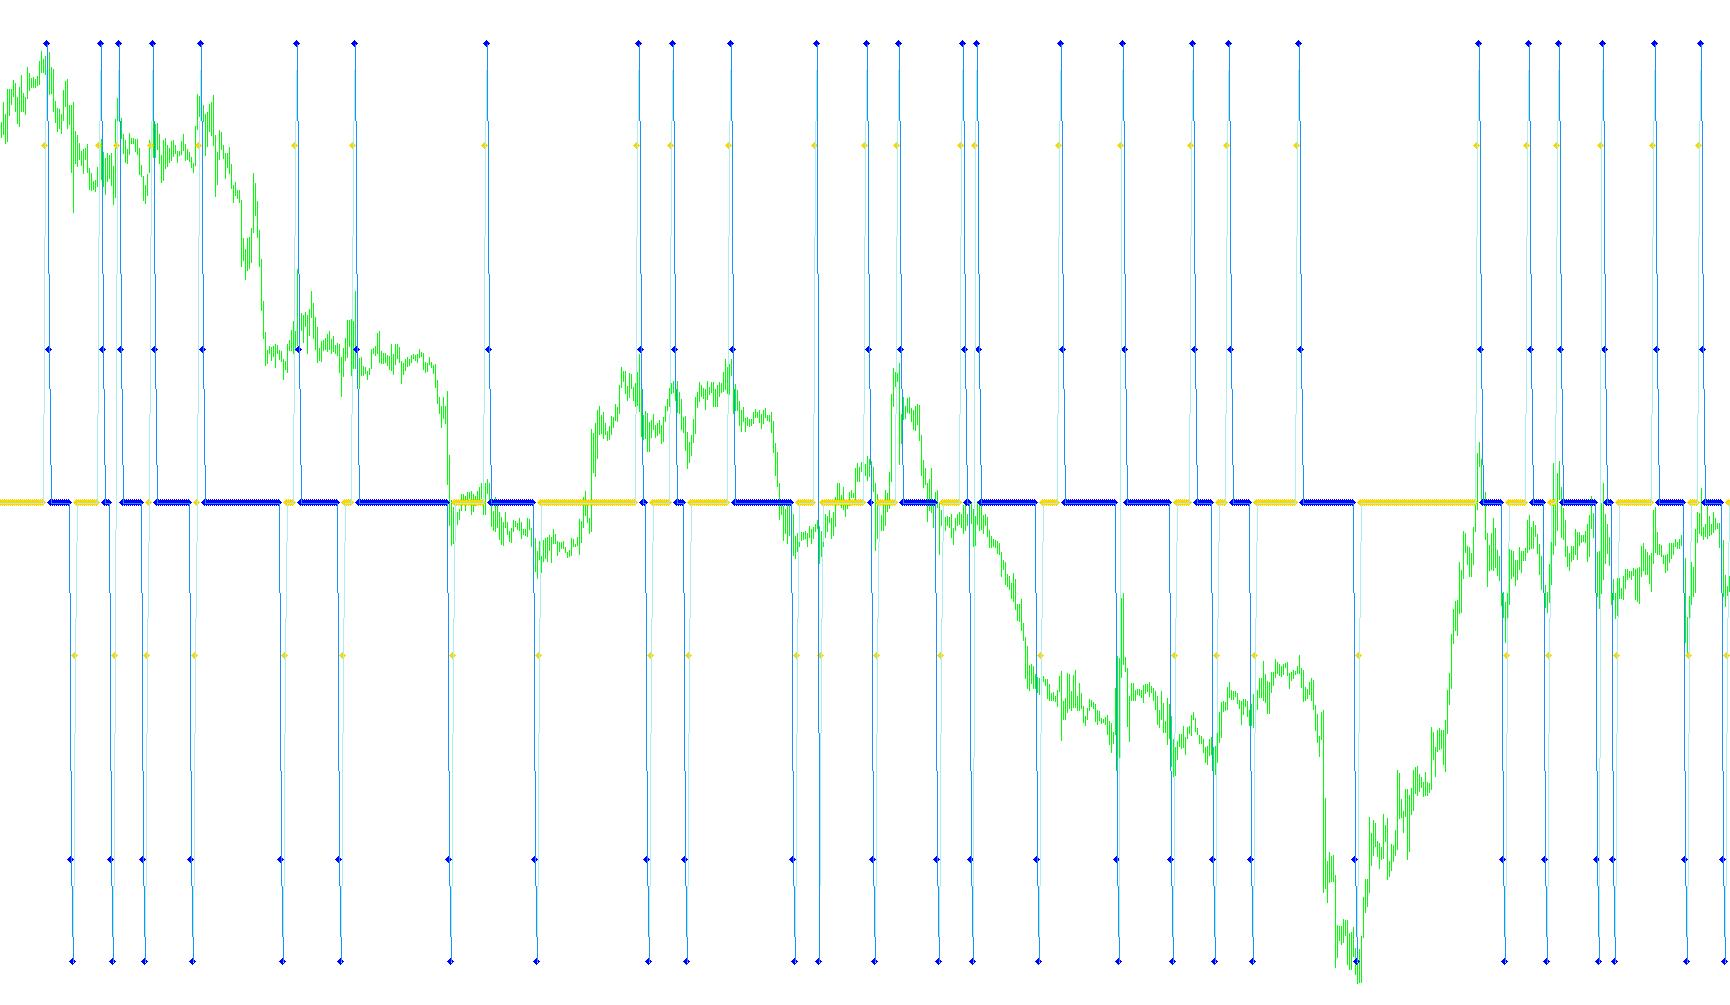
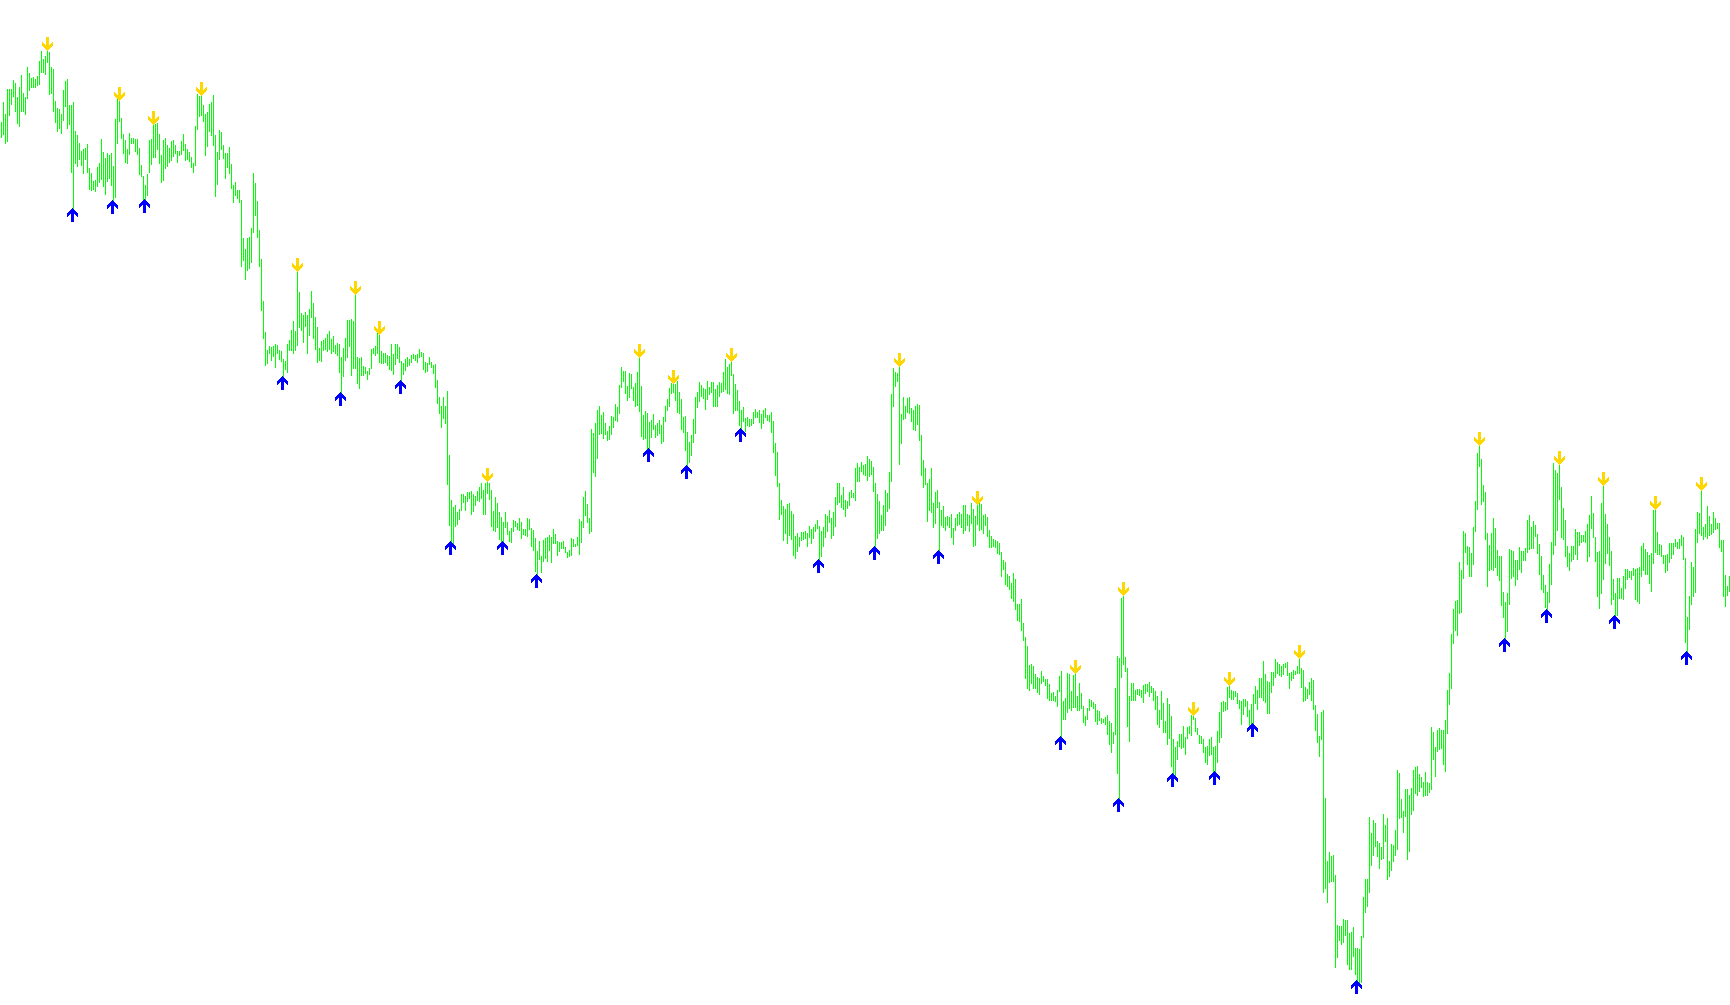
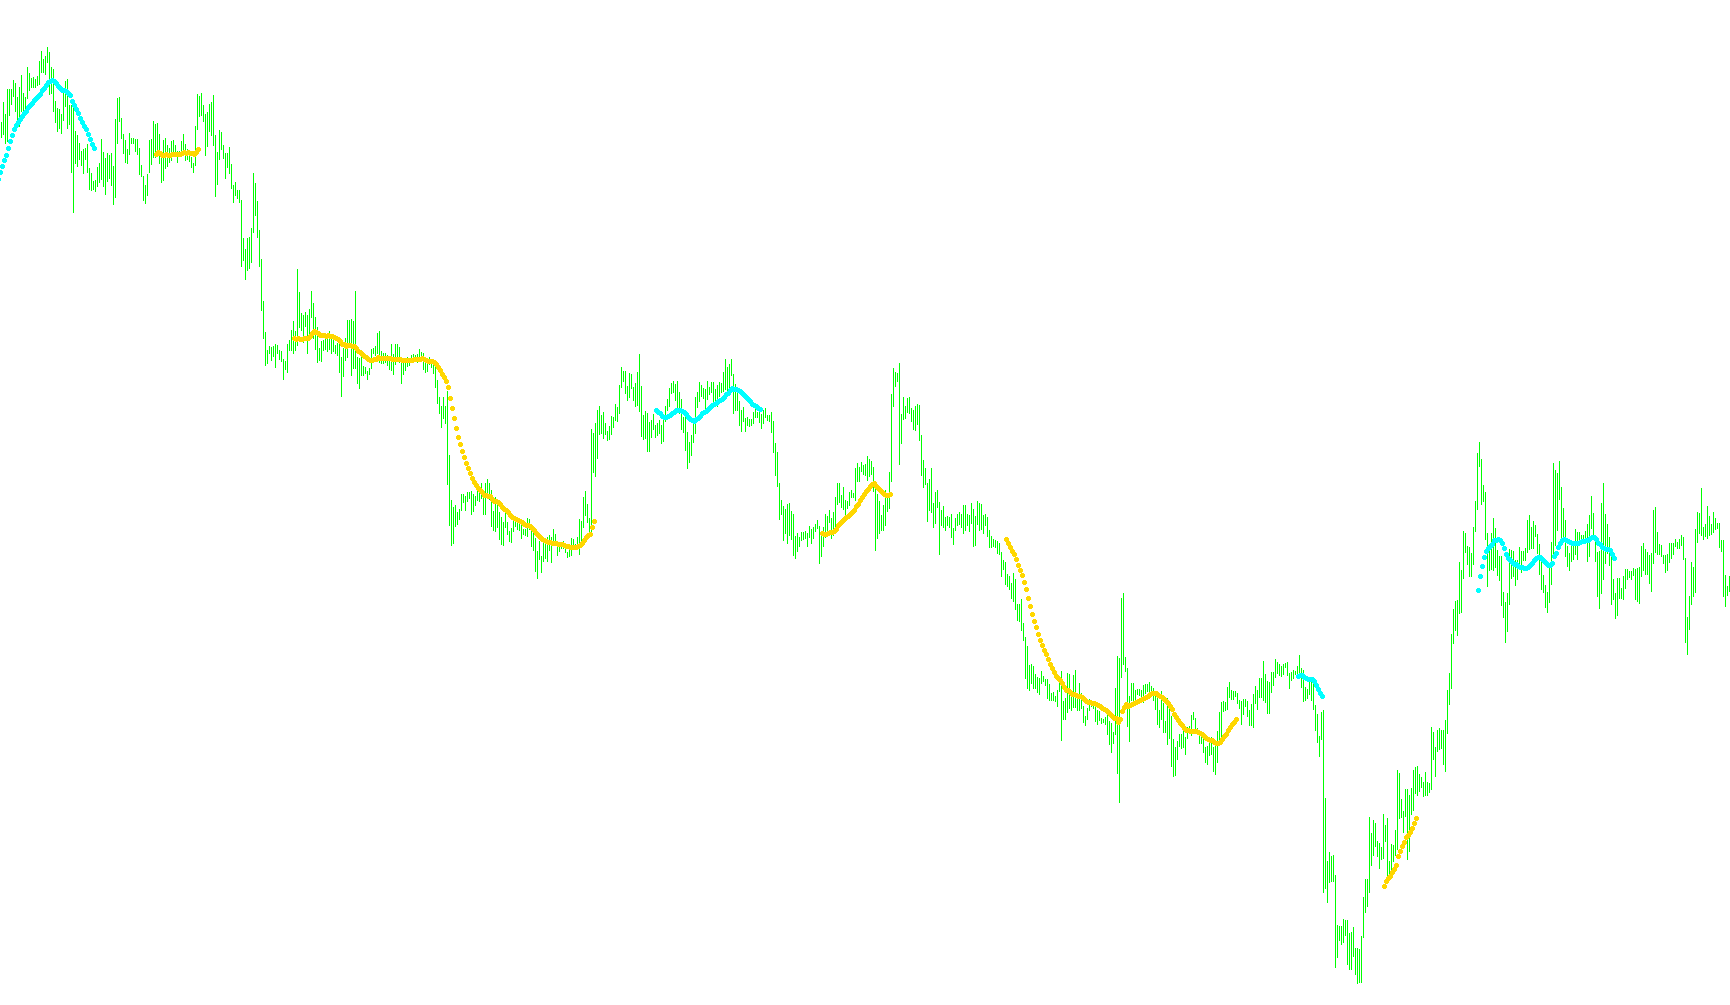
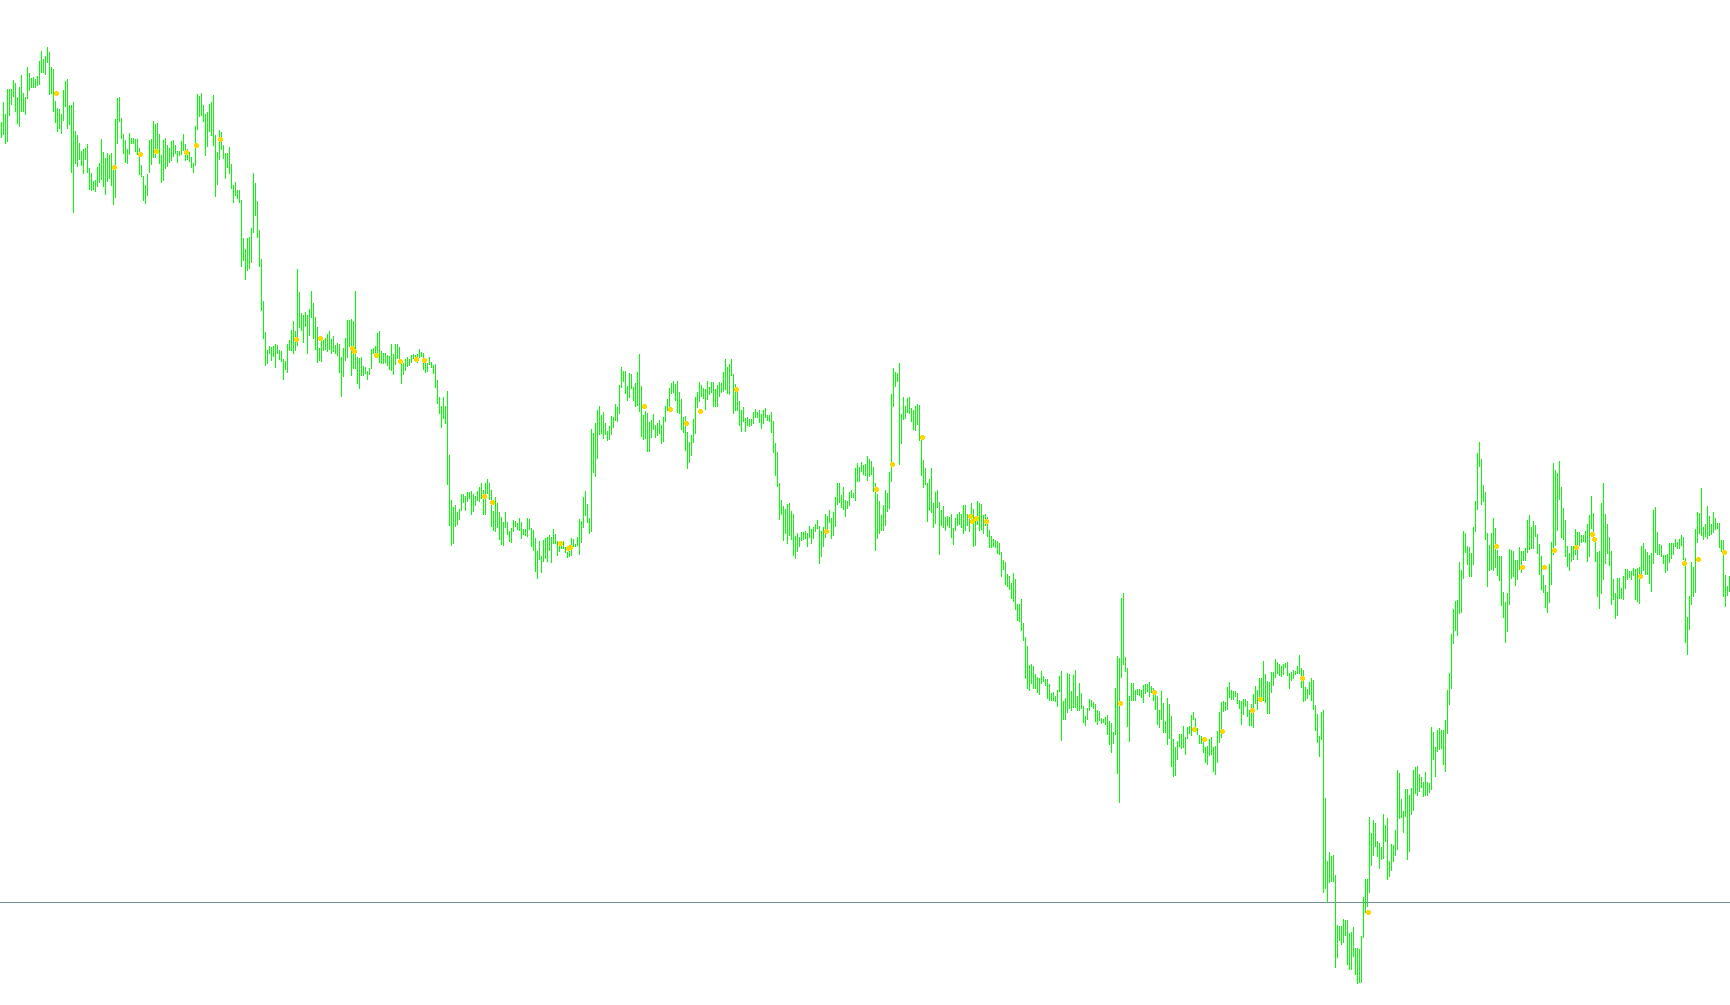
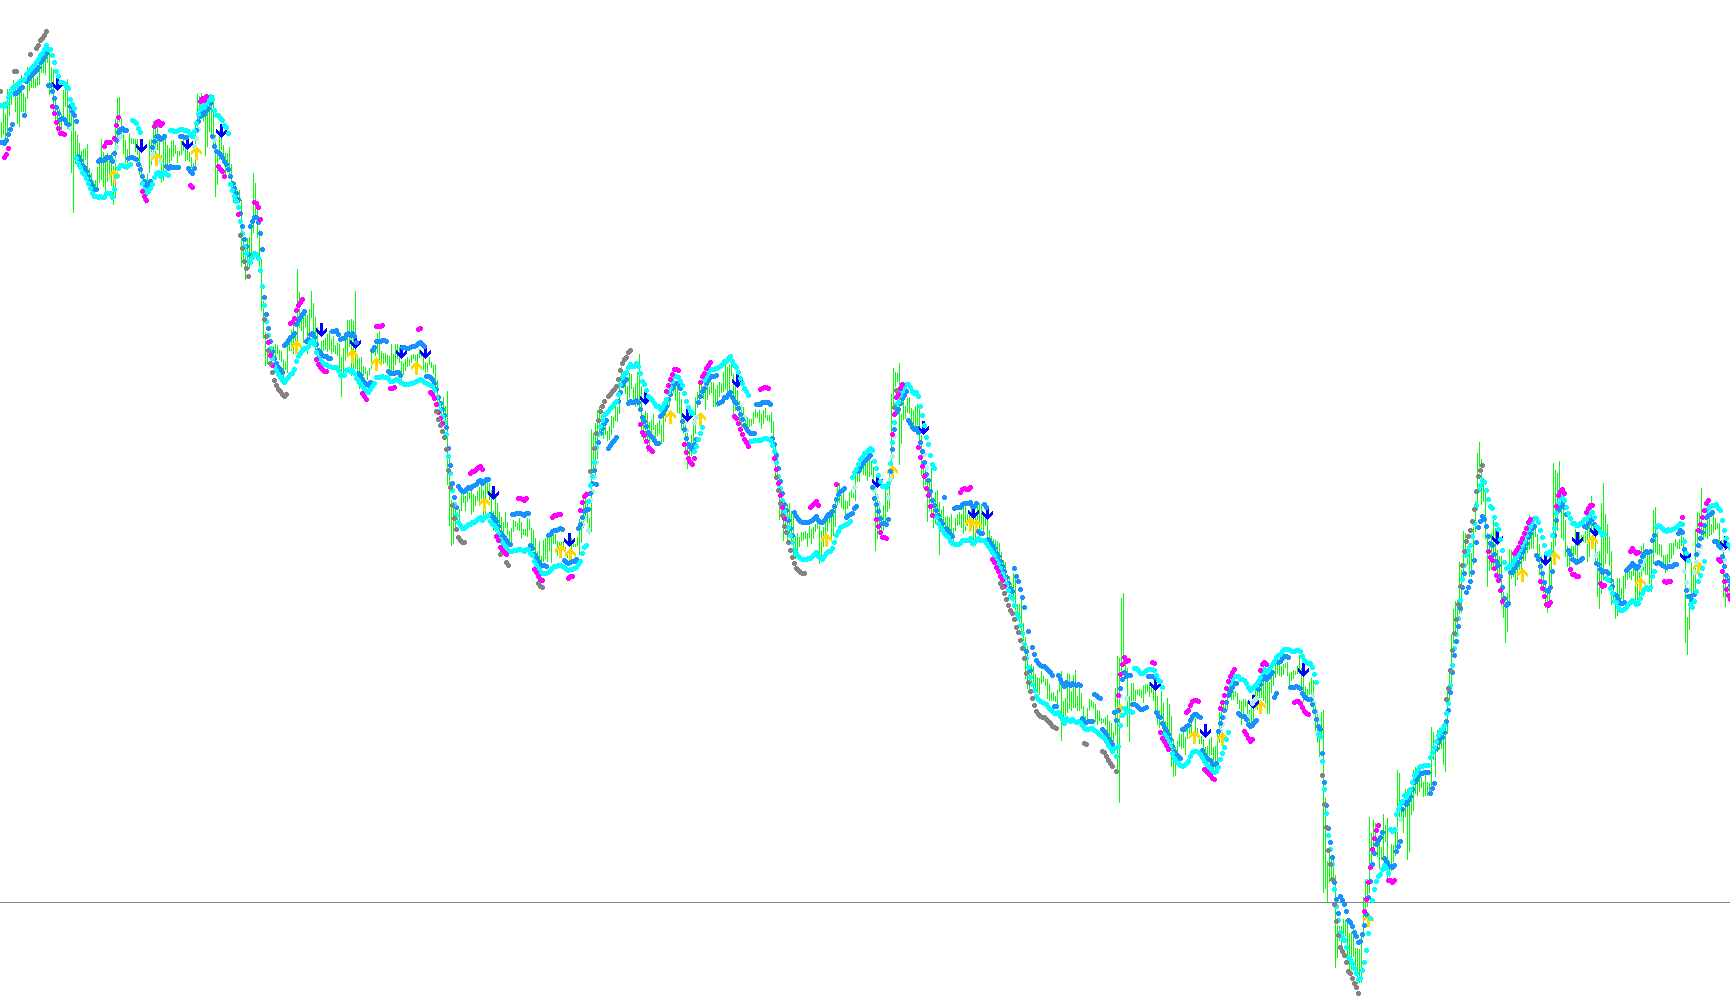
Identifies trend reversals by detecting price breaches of a floating range defined by historical volatility and relative high-low extremes.

+EURUSD
Indicator

+EURUSD

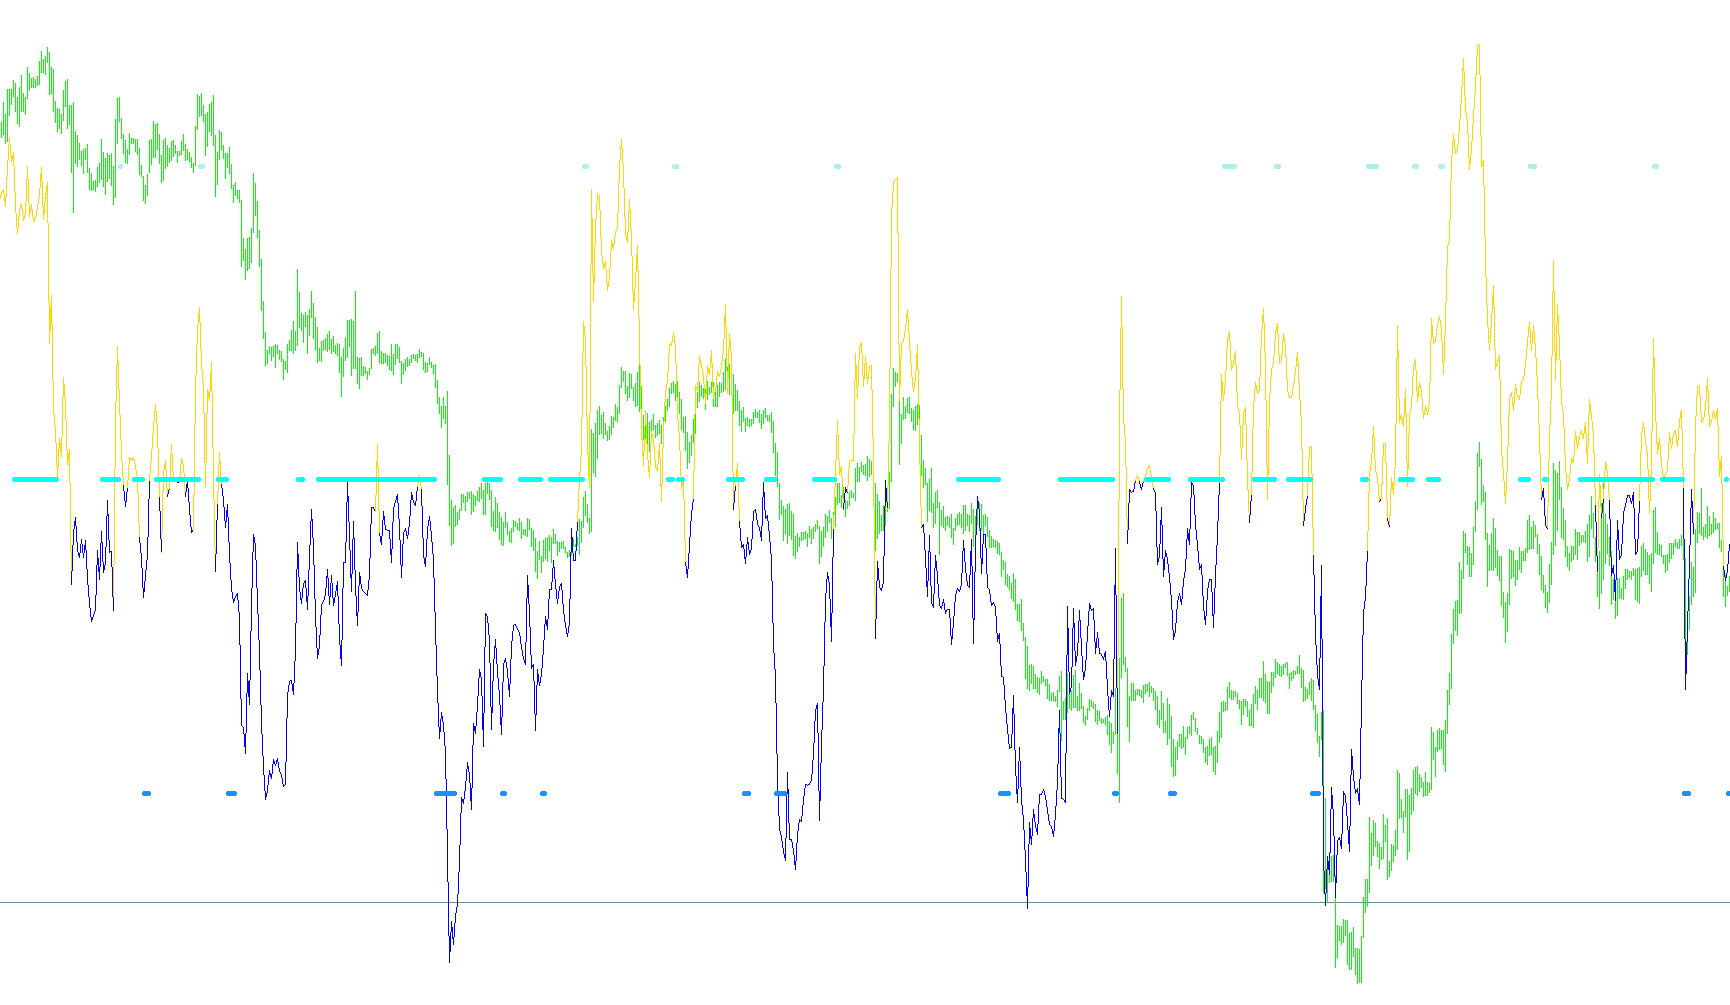
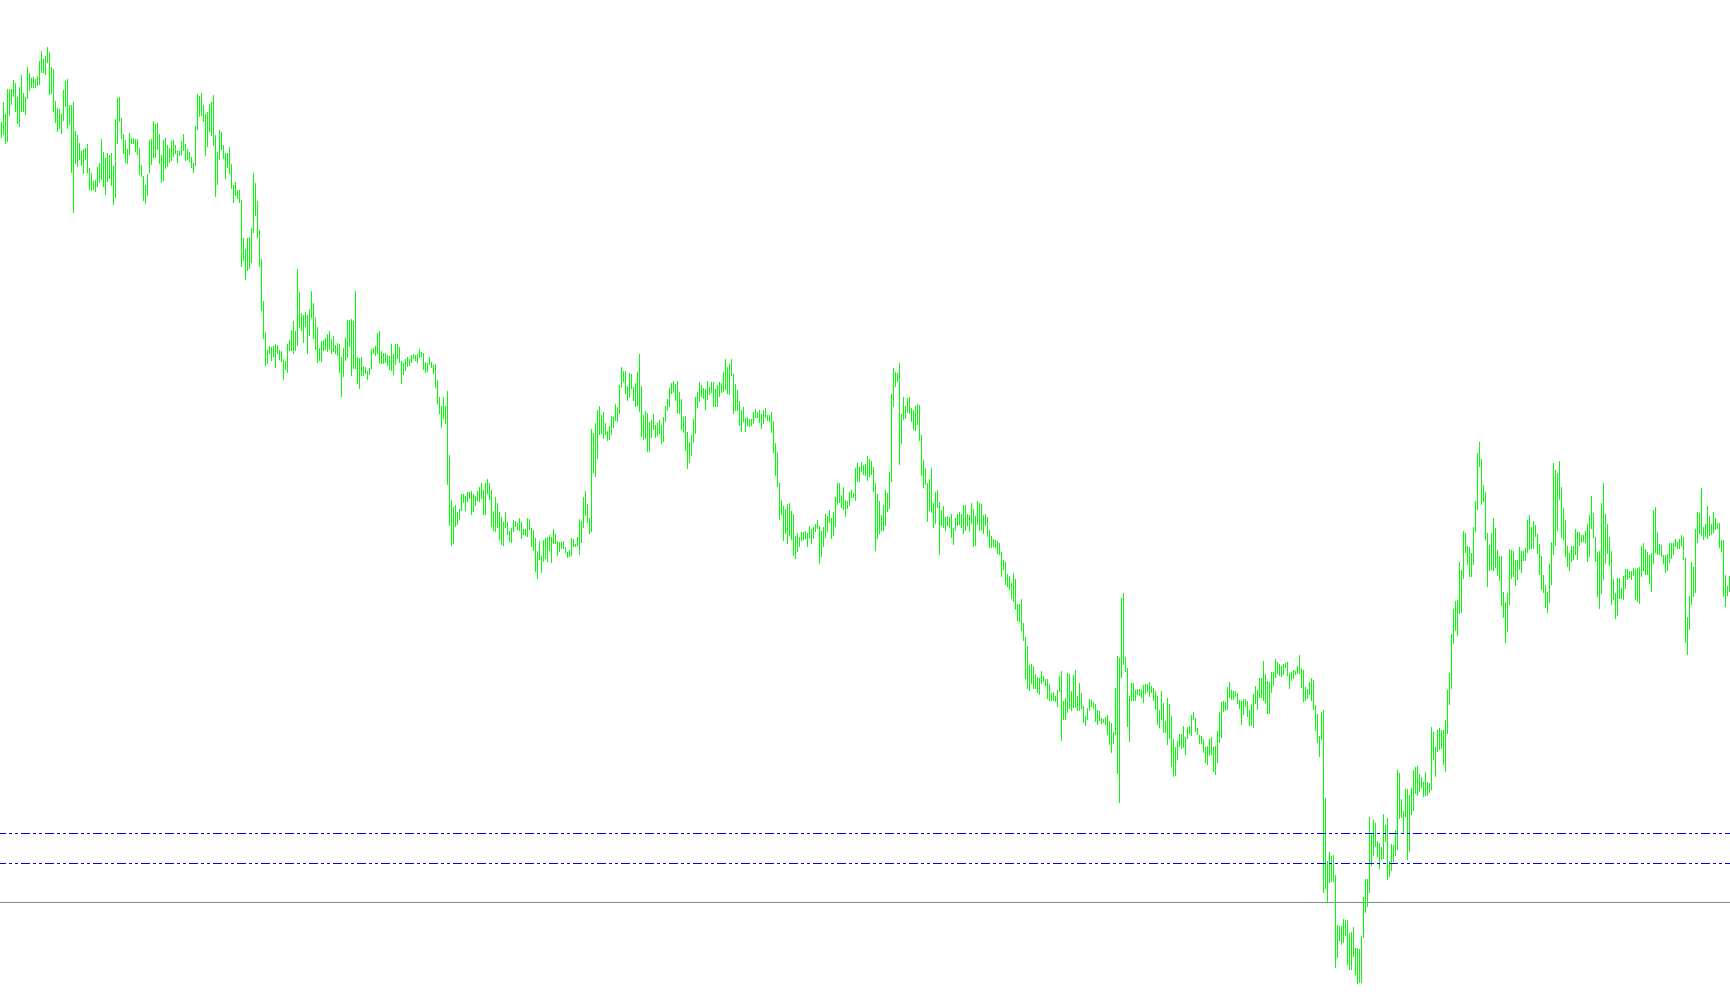
This indicator visualizes a synthetic price path by applying a fixed proportionality ratio to the EURUSD pair's historical data.

+ind_MA_RSI_MACD_v.7
Indicator

+ind_MA_RSI_MACD_v.7

iMACD

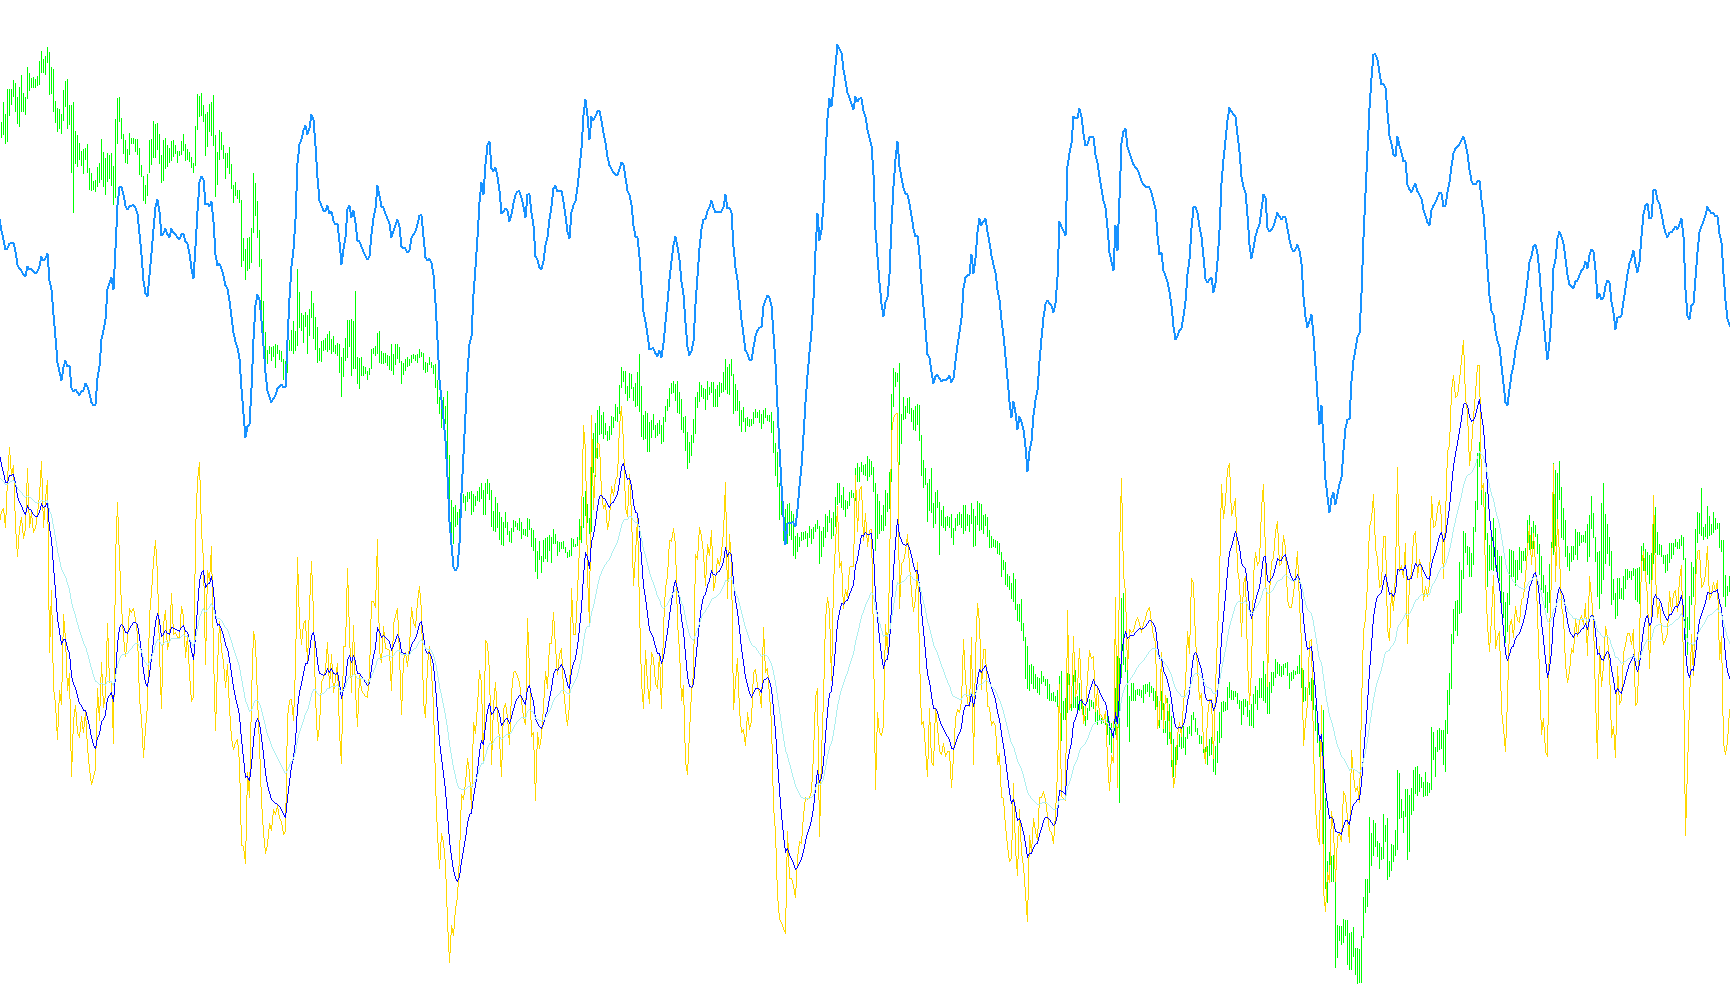
This indicator identifies trend reversal points by detecting momentum shifts where Moving Average-filtered RSI values cross and align with MACD signal dynamics.

Indicator

+JoGET#58+

iMAiMAOnArrayiStdDevOnArray
+JuiceLevels_Alert
Indicator

+JuiceLevels_Alert

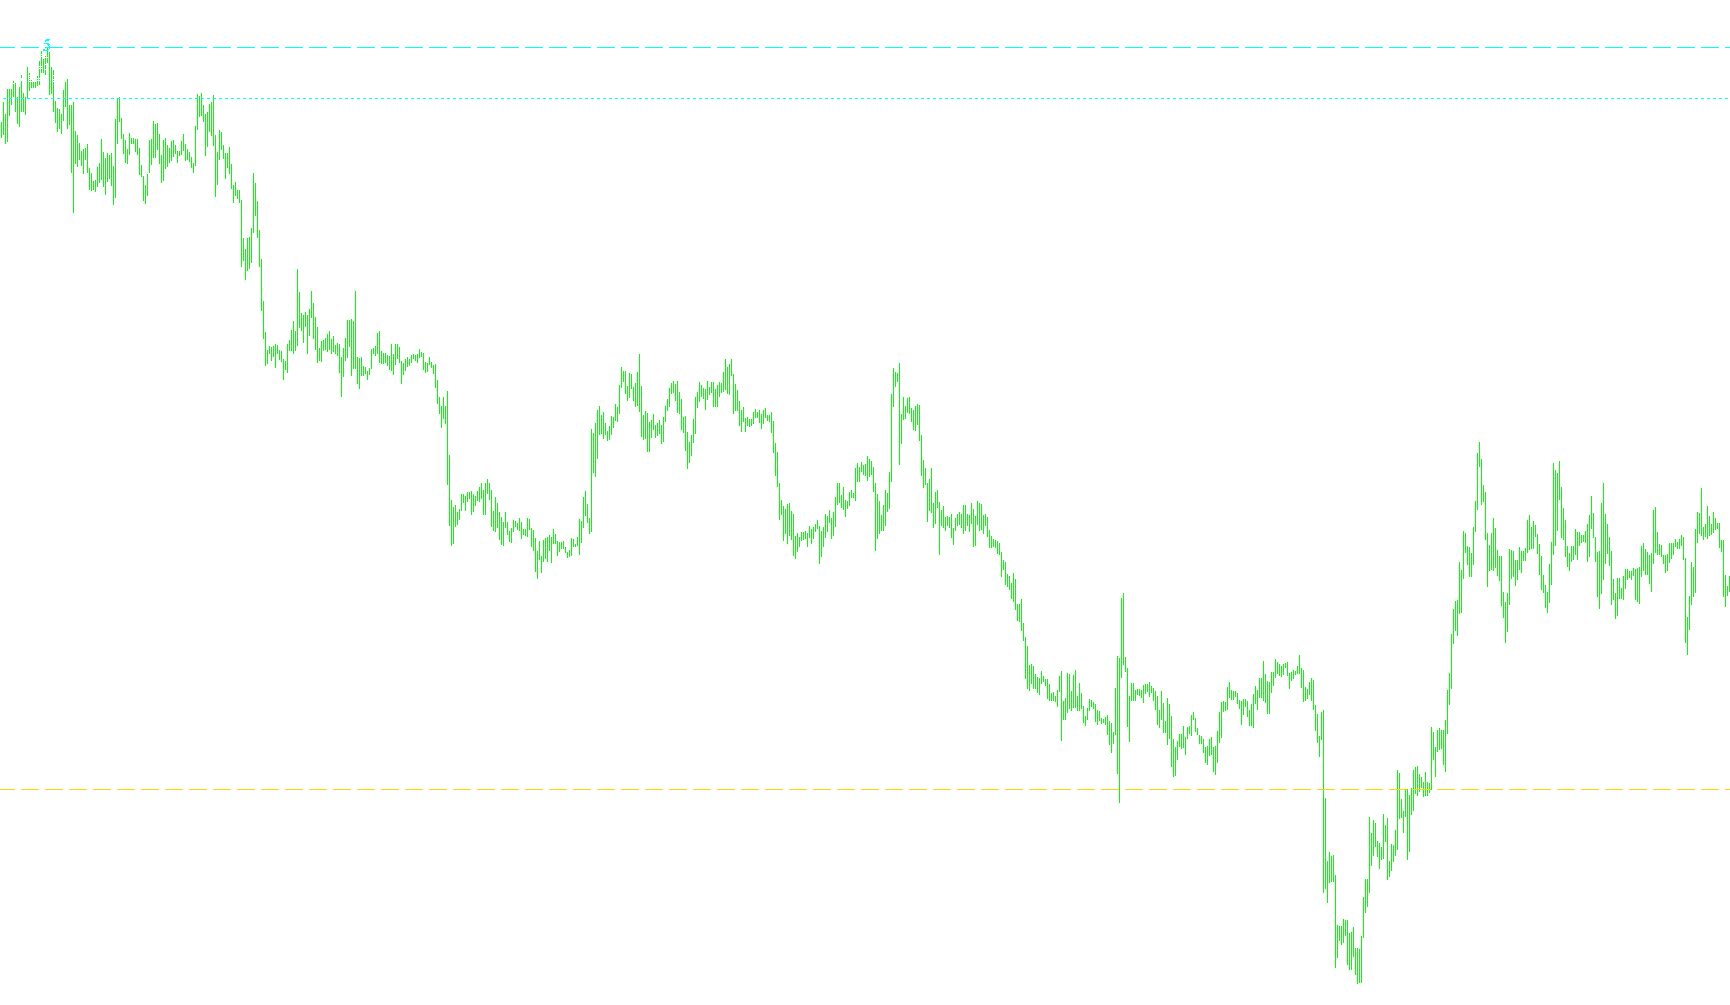
This indicator categorizes market volatility into three distinct intensity zones by analyzing the standard deviation of exponential moving averages relative to predefined pip thresholds.

+LSMA_Angle
Indicator

+LSMA_Angle

This indicator quantifies the directional slope of a Least Squares Moving Average to identify trend strength, exhaustion, and neutral price action.

+Market_Info
Indicator

+Market_Info

This indicator calculates real-time portfolio metrics, including adjusted tick values, spread costs, margin requirements, and session boundary detection based on price volatility.

+OsMA Color
Indicator

+OsMA Color

iOsMA
+RSI-TC
Indicator

+RSI-TC

iBandsiATRiMAiRSI
+RSI-TC_v2
Indicator

+RSI-TC_v2

iBandsiATRiMAiRSI
+RSI_mtf
Indicator

+RSI_mtf

iRSI

This indicator calculates the difference between two Relative Strength Index values across different timeframes to identify momentum shifts and directional trend changes.

- Alert @ MT4-LevelStop-Reverse-vB0-4
Indicator

- Alert @ MT4-LevelStop-Reverse-vB0-4

iATRiMAOnArray

This indicator identifies trend shifts by monitoring price breaches of an adaptive trailing stop line derived from smoothed ATR volatility or fixed pip offsets.

-- Heiken_Ashi_Ma_T3
Indicator

-- Heiken_Ashi_Ma_T3

iMA

This indicator synthesizes T3 moving average smoothing with Heiken Ashi price action logic to identify trend reversals through momentum shift crossovers.

-- Heiken_Ashi_Ma_T3_002
Indicator

-- Heiken_Ashi_Ma_T3_002

iMA

This indicator synthesizes T3 moving average smoothing with Heiken Ashi price action logic to identify trend reversals through momentum-shifted price candles.

--Aroon Horn----
Indicator

--Aroon Horn----

This indicator quantifies the strength and direction of a price trend by calculating the percentage proximity of the highest highs and lowest lows relative to the current candle's position over a specified lookback period.

--PivotCustomTime----
Indicator

--PivotCustomTime----

This indicator projects comprehensive horizontal support and resistance levels by synthesizing standard, Camarilla, and midpoint pivot calculations based on historical high, low, and closing prices.

--PivotCustomTime----_001
Indicator

--PivotCustomTime----_001

This indicator synthesizes traditional floor pivots, Camarilla breakout levels, and intermediate midpoint values into a single visual framework for identifying multi-tier support and resistance.

--PivotCustomTime----_v1
Indicator

--PivotCustomTime----_v1

This indicator dynamically projects standard Pivot Points, Camarilla levels, and intermediate midpoint subdivisions based on historical high, low, and closing price data.

-Dodji
Indicator

-Dodji

This indicator identifies specific price action patterns including Hammers, Shooting Stars, High Waves, and Thrusts by analyzing candle body-to-wick ratios against a dynamic moving average of historical volatility.

-RSI-3TF
Indicator

-RSI-3TF

iRSI

This indicator synchronizes Relative Strength Index data across three distinct timeframes to identify multi-layer momentum trends and potential divergence.

0 MA_of_MA cw
Indicator

0 MA_of_MA cw

iMAiMAOnArray

The indicator calculates a primary moving average and then applies two successive secondary moving averages onto that initial series to smooth out noise and identify long-term trend momentum.

0-0-TANGO
Indicator

0-0-TANGO

iRSI

The algorithm identifies bullish and bearish price action by detecting specific discrepancies between historical price movements and Relative Strength Index (RSI) extremes within a defined lookback window.

00ATR_Levels_custom[1]1test
Indicator

00ATR_Levels_custom[1]1test

iATR

This indicator calculates dynamic support and resistance levels by projecting the Average True Range from daily candles onto lower timeframes to identify potential liquidity zones.

00CCIarrowLv
Indicator

00CCIarrowLv

iCCI

This indicator identifies bullish and bearish entries by detecting zero-level crossovers of the Commodity Channel Index while projecting dynamic support and resistance levels.

00mp.pocLn
Indicator

00mp.pocLn

This indicator visualizes price distribution across specific geographic trading sessions to identify the Point of Control and historical liquidity density.

Indicator

00test_0S7ma_rsi

iMAiRSIOnArrayiStochastic
00_ZZ_Window
Indicator

00_ZZ_Window

This indicator identifies local price extremes by filtering recursive highs and lows through a multi-stage pruning logic to generate directional momentum signals.

Indicator

03_Start

Indicator

0MasTrend_C

iMA
Indicator

0_Harmony_06

Indicator

0_Harmony_06_v1

0_IndInverse
Indicator

0_IndInverse

This indicator identifies trend exhaustion and potential reversals by calculating a normalized price position relative to the local high-low range amplitude.

0_IndInverse_v1
Indicator

0_IndInverse_v1

This indicator calculates a normalized price position relative to the high-low range over a dynamic period to detect zero-line crossovers and trend reversals.

0_MoR2a
Indicator

0_MoR2a

iMAOnArrayiRSI

This indicator calculates a momentum ratio by dividing the short-term moving average of an RSI value by its long-term counterpart to identify trend intensity and divergence.

0_MoR2a_001
Indicator

0_MoR2a_001

iMAOnArrayiRSI

This indicator calculates the percentage deviation between two moving averages derived specifically from RSI data to identify momentum shifts.

0_MoR3_mtf
Indicator

0_MoR3_mtf

iMAOnArrayiRSI

This indicator analyzes momentum dynamics by calculating the relative percentage ratio between two moving averages applied specifically to the RSI oscillator across multiple timeframes.

0_mortor_1.02[1]_test1
Indicator

0_mortor_1.02[1]_test1

iADX

This indicator synthesizes multi-timeframe ADX and directional movement data to visually distinguish between trending, ranging, and consolidating market states.

0_MoR_signalTable_test1
Indicator

0_MoR_signalTable_test1

iWPRiMA
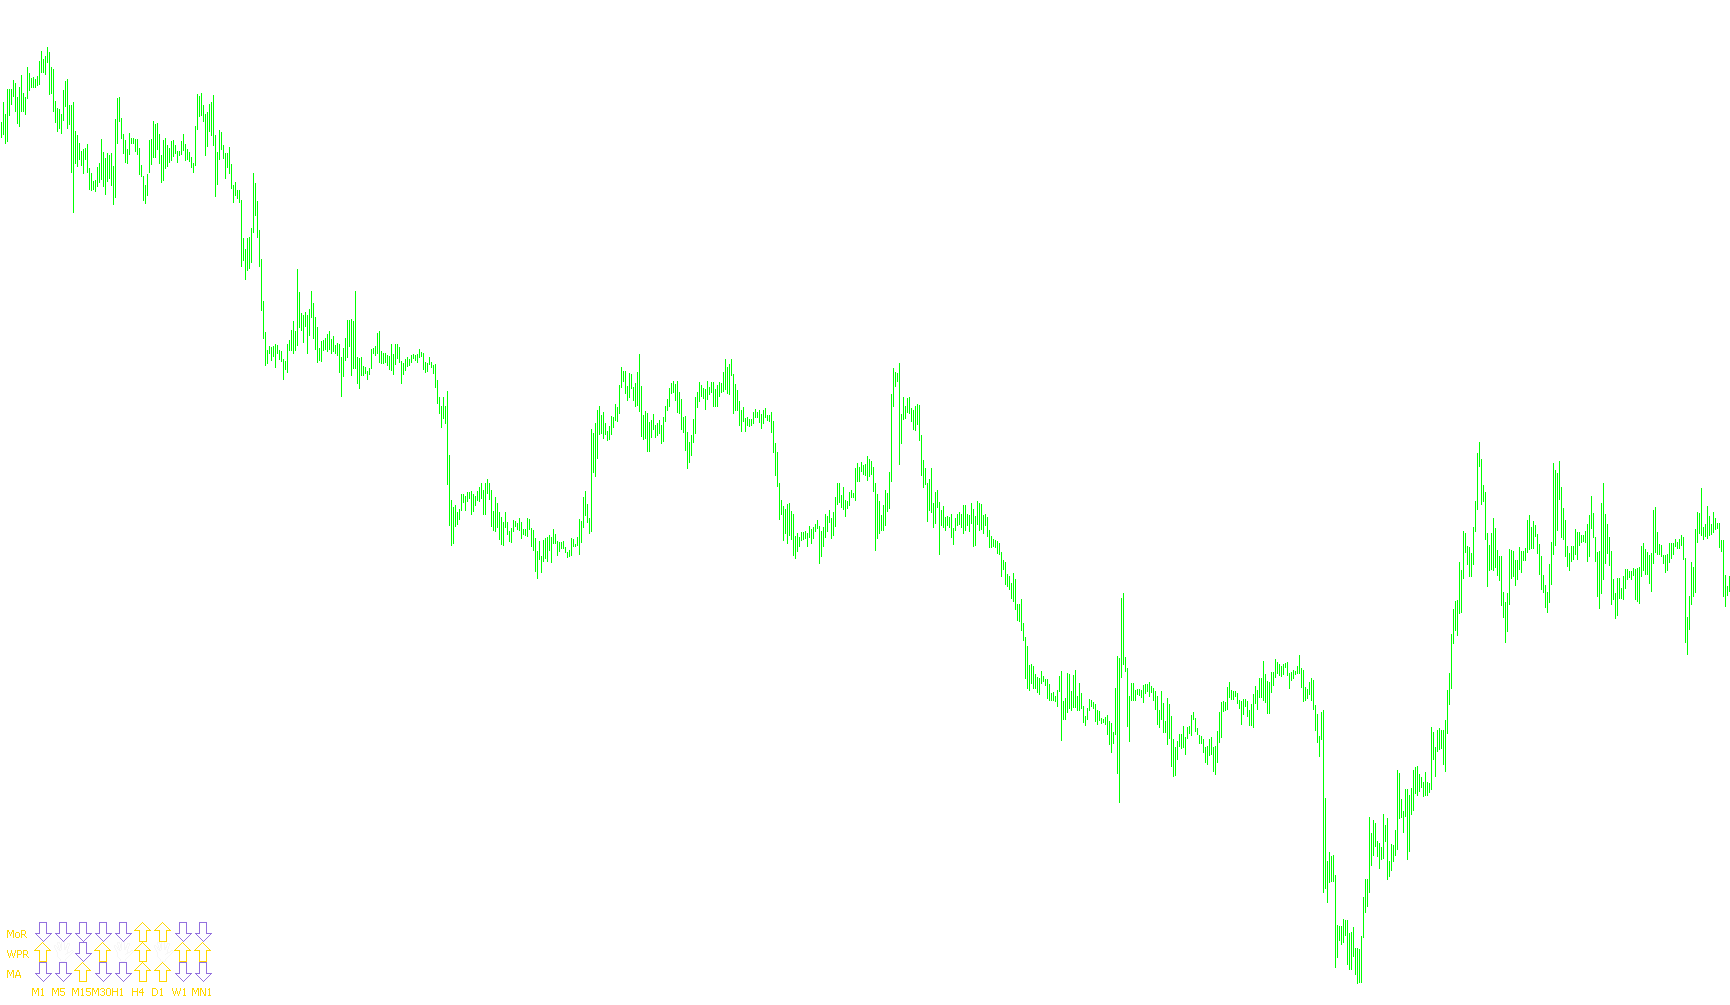
1$
Indicator

1$

This indicator calculates a dynamic momentum ratio by applying a recursive smoothing factor to price action and evaluating the relative magnitude of directional cumulative gains.

1-2-3 Pattern MTF v3.1
Indicator

1-2-3 Pattern MTF v3.1

iFractals
1-2-4!
Indicator

1-2-4!

The algorithm identifies specific price coordinates and executes a recursive backward search to locate nested structural extremes based on proportional geometric offsets.

1-3-6
Indicator

1-3-6

This indicator identifies price structural pivots and projects sequential recursive targets based on geometric proportions between key highs and lows.

1-3-6_v1
Indicator

1-3-6_v1

This indicator identifies price action structural anchors based on three user-defined levels and dynamically projects recursive expansion zones using nested mathematical offsets.

1
Indicator

1

This indicator identifies local structural turning points by locating the highest highs and lowest lows within a rolling window of twenty-four bars.

100ma_qual
Indicator

100ma_qual

iMA

This indicator identifies structural momentum by detecting specific directional crossovers between 25-period and 100-period linear weighted moving averages, filtering for sustained trend maturity over a 30-bar threshold.

100ma_qual_v1
Indicator

100ma_qual_v1

iMA

This indicator identifies structural trend shifts by detecting momentum crossovers between 25-period and 100-period Linear Weighted Moving Averages, filtering for high-confidence signals through a 30-bar duration requirement.
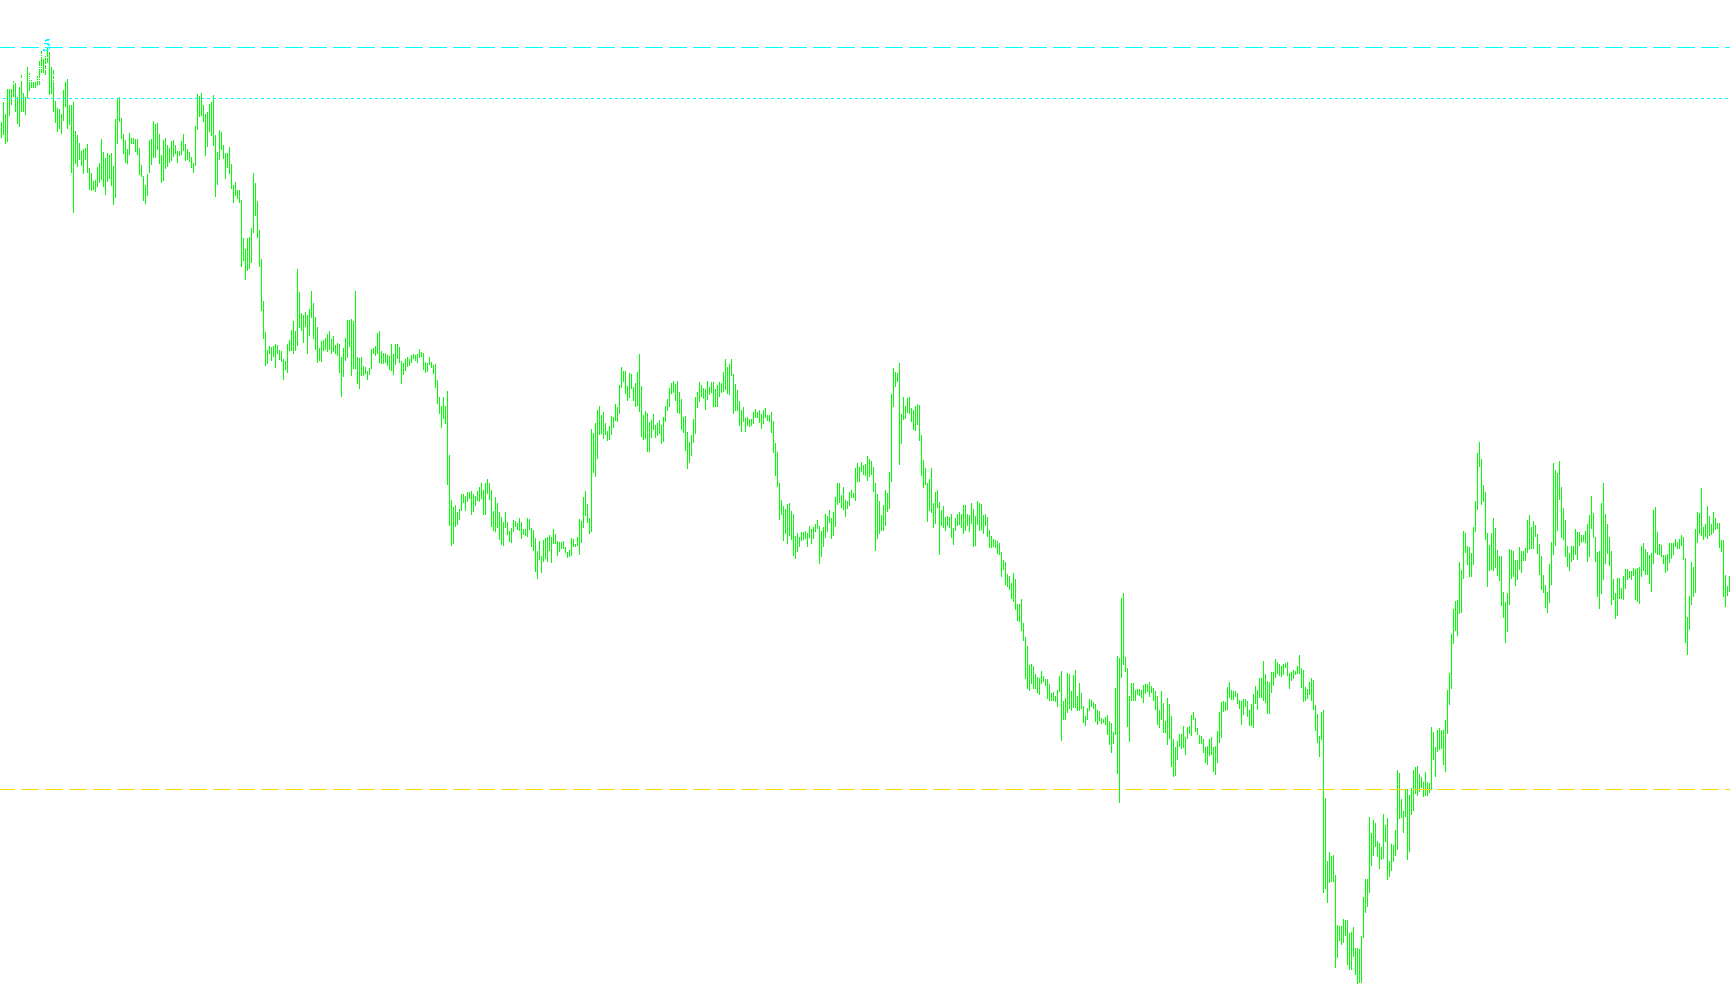
1020
Indicator

1020

This indicator dynamically maps historical high-low boundaries during specific sessions to identify price breakout zones and volatility expansion.

10Min_01
Indicator

10Min_01

iMACDiMAiRSIiStochastic

Identifies market inflection points by detecting momentum crossovers between weighted and simple moving averages across multiple oscillators.

10Min_011
Indicator

10Min_011

iMACDiMAiRSIiStochastic

This indicator identifies trend reversals by detecting Weighted Moving Average crossovers synchronized with Stochastic, RSI, and MACD momentum filters.

10Min_011a
Indicator

10Min_011a

iMACDiMAiRSIiStochastic

This indicator identifies high-probability trade entries by synthesizing weighted moving average crossovers, RSI momentum shifts, and stochastic oscillator divergences.