Awesome
Indicator

Awesome

iMA

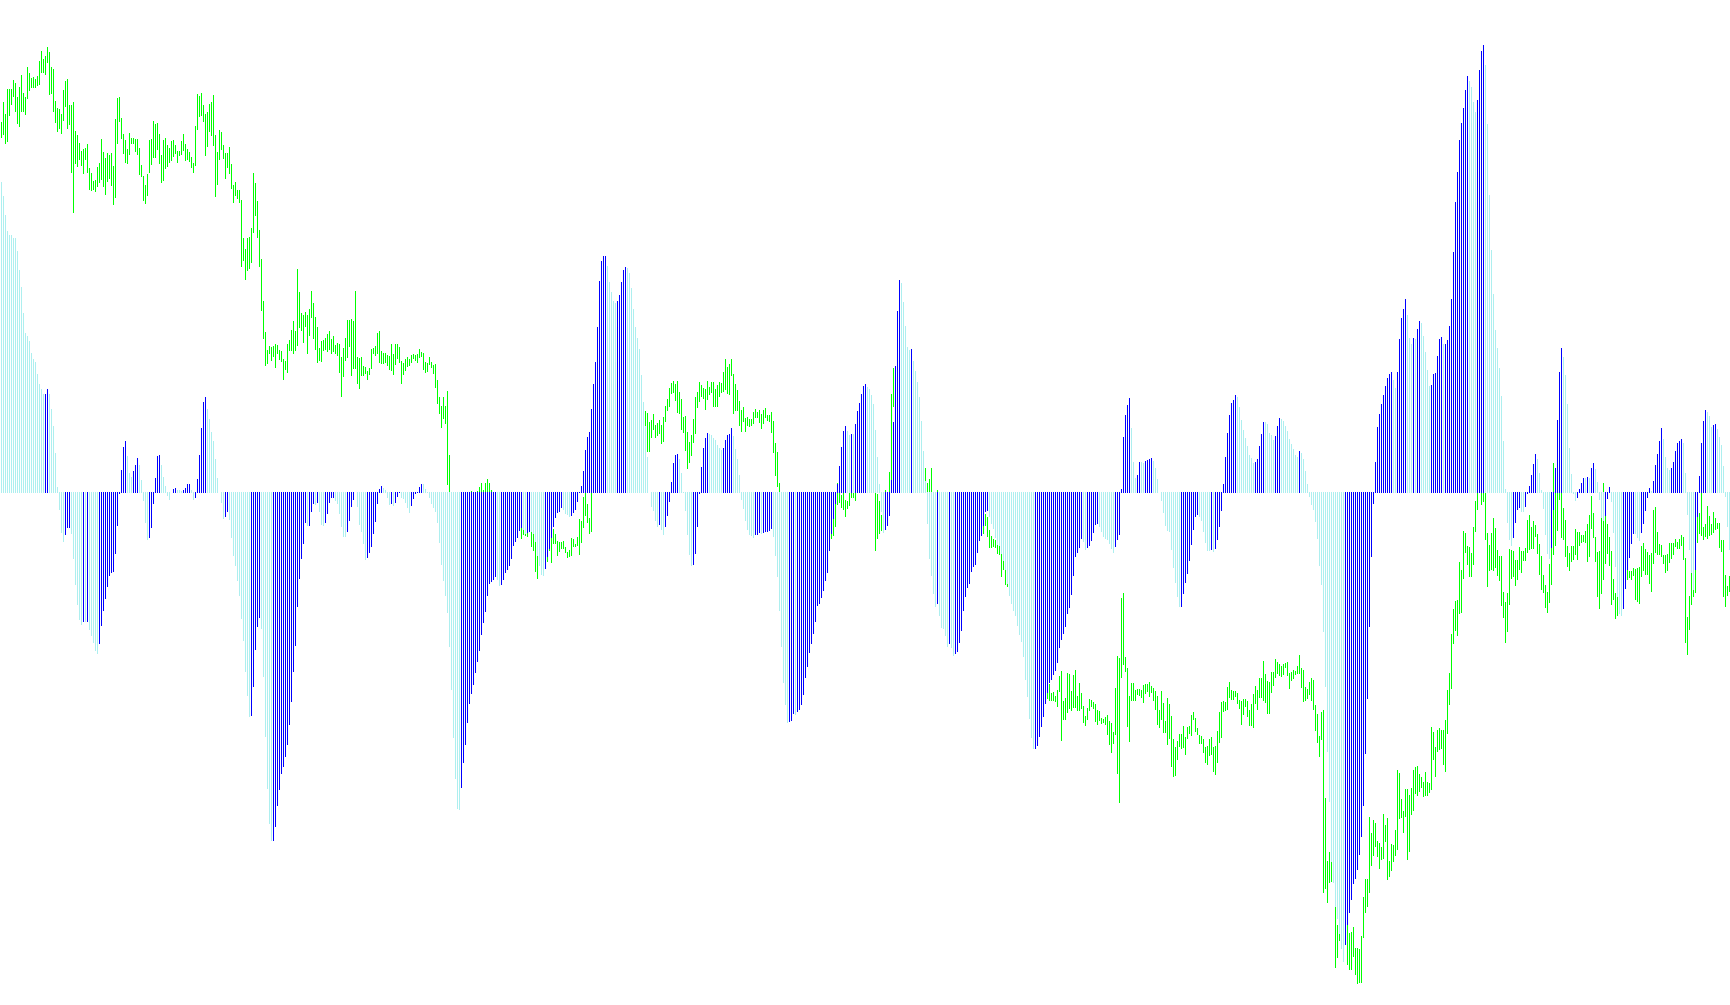
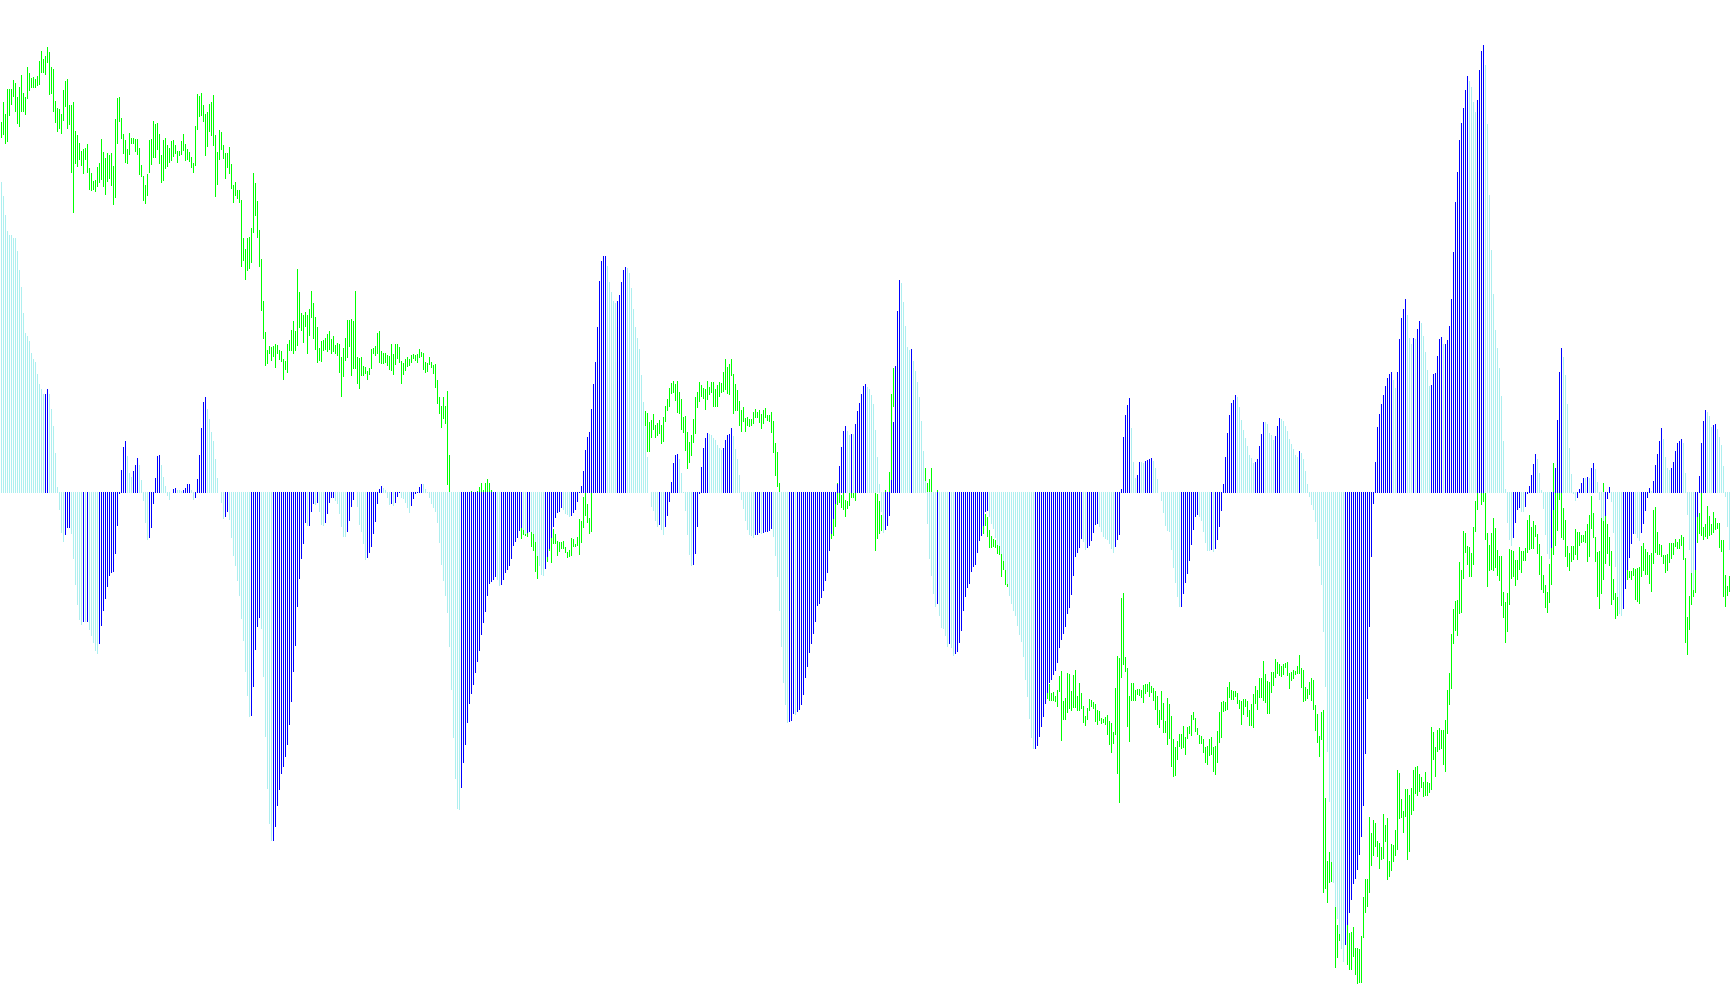
The logic computes the difference between two simple moving averages to identify momentum shifts and visualizes trend strength through dual-colored histogram bars.

AwesomeFxTradera
Indicator

AwesomeFxTradera

iMA

This indicator visualizes the directional velocity of price momentum by calculating the differential between two exponential moving averages and segregating them into contrasting histogram bars.

AwesomeMod
Indicator

AwesomeMod

iMAiMAOnArray

This indicator calculates the percentage difference between dual smoothed moving averages and applies a secondary mean smoothing to visualize momentum shifts via histogram reversals.

AwesomeMod_EA
Indicator

AwesomeMod_EA

iMAiMAOnArray

This algorithm calculates the percentage variance between two smoothed moving averages and applies a secondary SMA filter to identify trend velocity.

AwesomeOC
Indicator

AwesomeOC

iMA

This indicator calculates the difference between two moving averages of varying periods to visualize market momentum and directional shifts through a dual-colored histogram.

Awesome_(AO)_mtf
Indicator

Awesome_(AO)_mtf

iMA

This indicator calculates the difference between two simple moving averages across specific higher timeframes to visualize momentum shifts via a dual-color histogram.

Awesome_001
Indicator

Awesome_001

iMA

This indicator quantifies market momentum by calculating the variance between two simple moving averages and visualizing directional shifts through a dual-color histogram.

Awesome_Signal
Indicator

Awesome_Signal

iMAiMAOnArray

This indicator calculates the momentum differential between simple and weighted moving averages to generate visual histograms and a smoothed signal line for trend exhaustion identification.

Awesome_Signal_Alert
Indicator

Awesome_Signal_Alert

iMAiMAOnArray

This indicator calculates the difference between two simple moving averages to visualize price momentum, identifying trend reversals via zero-line crossovers and signal line intersections.

Awesome_Signal_v1
Indicator

Awesome_Signal_v1

iMAiMAOnArray

This indicator calculates the differential between dual moving averages to identify momentum shifts and visualizes price velocity through histogram peaks and a smoothed signal line.

Awesome_v1
Indicator

Awesome_v1

iMA

The logic calculates the difference between two simple moving averages to visualize price momentum shifts and trend exhaustion through a dual-colored histogram.

awesome_v2
Indicator

awesome_v2

iMA

This indicator quantifies price velocity by calculating the difference between 5-period and 34-period simple moving averages, visualized as a dual-colored momentum histogram.

Awesome_v3
Indicator

Awesome_v3

iMA

This indicator calculates the difference between two simple moving averages to visualize price momentum and identifies directional shifts through color-coded histogram bars.

A_GMMA Long
Indicator

A_GMMA Long

iMA

This indicator visualizes a sequence of eight Exponential Moving Averages with decreasing periods to identify trend momentum and structural density.

A_GMMA Short
Indicator

A_GMMA Short

iMA

This indicator plots eight distinct Exponential Moving Averages of varying periods to visualize price momentum and trend convergence.

Ball
Indicator

Ball

iMA

This indicator calculates the relative position of price action within Bollinger Bands to quantify momentum intensity and proximity to historical volatility boundaries.

Bands Level
Indicator

Bands Level

iMA

This indicator calculates rolling standard deviations from a Simple Moving Average to project upper and lower price boundaries with real-time horizontal level synchronization.

Bands+Fibo_True
Indicator

Bands+Fibo_True

iATRiMA

This indicator dynamically maps price action by projecting multiple Fibonacci-weighted expansion levels based on the Average True Range around a Simple Moving Average.

Bands
Indicator

Bands

iMA

This indicator calculates a central simple moving average and projects upper and lower boundaries based on the geometric variance of price action over a specified period.

BandsBandwidth
Indicator

BandsBandwidth

iMA

This indicator quantifies market volatility by calculating the absolute distance between upper and lower Bollinger Bands and normalizing the result into a numerical breadth value.

BandsBandwidth2
Indicator

BandsBandwidth2

iMA

This indicator quantifies market volatility by calculating the mathematical spread between upper and lower Bollinger Band boundaries as a localized numerical value.

BandsMA
Indicator

BandsMA

iMA

This indicator calculates dynamic price envelopes by applying selectable moving average types—including Linear Regression—to determine standard deviation bands around a central trendline.

BandsMA2dev
Indicator

BandsMA2dev

iMA

This indicator calculates multi-layered volatility bands based on customizable moving average types, including Least Squares and Linear Regression, to identify price extremes.

BandsMA_2dev
Indicator

BandsMA_2dev

iMA

This indicator calculates dual volatility envelopes based on customizable moving averages—including SMA, EMA, SMMA, LWMA, and LSMA—applied to multiple price types with user-defined standard deviation offsets.

Bands_001
Indicator

Bands_001

iMA

This indicator calculates a central moving average and projects upper and lower boundaries based on the standard deviation of price fluctuations over a specific period.

Bands_v1
Indicator

Bands_v1

iMA

Calculates dynamic price boundaries by layering standard deviation variance over a simple moving average to identify extreme market extremes.

Bands_v2
Indicator

Bands_v2

iMA

This indicator maps price fluctuations by calculating a simple moving average baseline complemented by dynamic standard deviation boundaries to identify extreme market extremes.

Bands_v3
Indicator

Bands_v3

iMA

This indicator calculates a rolling simple moving average and constructs upper and lower boundaries based on the standard deviation of price variance over a specified timeframe.

BarSize
Indicator

BarSize

iMA

This indicator identifies and plots candles whose price range exceeds the moving average of historical high-low spreads to highlight significant momentum shifts.

Indicator

BatMA_23poleGF

iMA
BatMA_MAx23poleGF
Indicator

BatMA_MAx23poleGF

iMA

This indicator applies a multi-pole Gaussian smoothing algorithm to standard moving average data to reduce noise and enhance price signal clarity.

BB - HL
Indicator

BB - HL

iMA

This indicator dynamically constructs price boundaries by calculating standard deviations derived from the maximum squared variance between high and low extremes relative to a moving average.

BB - HL_v1
Indicator

BB - HL_v1

iMA

This indicator constructs dynamic volatility bands by calculating the maximum squared difference between price extremes and a median-based moving average.

BBandWidthRatio
Indicator

BBandWidthRatio

iMA

This indicator quantifies the relationship between Bollinger Band expansion and the underlying moving average to identify relative price volatility levels.

BBandWidthRatiohisto
Indicator

BBandWidthRatiohisto

iMA

This indicator quantifies market volatility by calculating the ratio between the Bollinger Band range and the current moving average price.

BBandWidthRatio_alert_v03
Indicator

BBandWidthRatio_alert_v03

iMA

Quantifies the relative expansion of Bollinger Band width against the moving average price to identify periods of extreme market stagnation.

BBandWidthRatio_v1
Indicator

BBandWidthRatio_v1

iMA

Quantifies the relative expansion of Bollinger Band width against its moving average mean to identify dynamic volatility scaling.

BBandWidthRatio_v3
Indicator

BBandWidthRatio_v3

iMA

This indicator quantifies the relative magnitude of Bollinger Band width against its moving average to identify periods of abnormal price expansion.

Indicator

BBFiboM_mtf

iMA
BBflat
Indicator

BBflat

iMAiStdDev

This indicator quantifies market volatility by mapping the standard deviation bands and calculating the real-time price distance from the moving average.

BBflat_sw
Indicator

BBflat_sw

iMAiStdDev

Quantifies the instantaneous distance between current market price and a moving average relative to dynamic standard deviation bounds.

BBflat_sw_v1
Indicator

BBflat_sw_v1

iMAiStdDev

This indicator quantifies market sentiment by visualizing the absolute distance of price action from its moving average relative to standard deviation thresholds.

BBhisto
Indicator

BBhisto

iMAiStdDev

This indicator quantifies the price's relative position within a Bollinger Band structure by calculating a normalized variance value plotted as a histogram.

bbhisto_sq
Indicator

bbhisto_sq

iATRiMAiStdDev

Identifies periods of extreme market stagnation by calculating the ratio between Bollinger Band standard deviation and ATR-based volatility to pinpoint potential breakout signals.

bbhisto_v1
Indicator

bbhisto_v1

iMAiStdDev

This indicator quantifies price volatility by normalizing the distance between the current close and the upper Bollinger Band against the standard deviation to generate a momentum-based histogram.

bbhisto_v2
Indicator

bbhisto_v2

iMAiStdDev

This indicator quantifies price displacement from the moving average relative to standard deviation, plotting a histogram to signal overextended market momentum.

bbmacd
Indicator

bbmacd

iBandsiMACDiMA

This indicator synthesizes Bollinger Band deviations with a dual-layered MACD calculation to visualize trend intensity and momentum shifts in a single oscillator window.

bbmacd_v2
Indicator

bbmacd_v2

iBandsiMA

This indicator synchronizes Bollinger Band volatility dynamics with a customized dual-EMA MACD calculation to visualize price momentum and trend strength shifts.

BBRSI&MA_v2
Indicator

BBRSI&MA_v2

iMAiMAOnArray

This indicator synthesizes relative strength momentum with moving average smoothing and Bollinger Band envelopes to identify price trend exhaustion and volatility breakouts.

BBRSI_v1
Indicator

BBRSI_v1

iMA

This indicator synthesizes a custom Relative Strength Index calculation with Bollinger Band volatility envelopes to identify momentum exhaustion and mean reversion signals.