AO2
Indicator

AO2

iMA

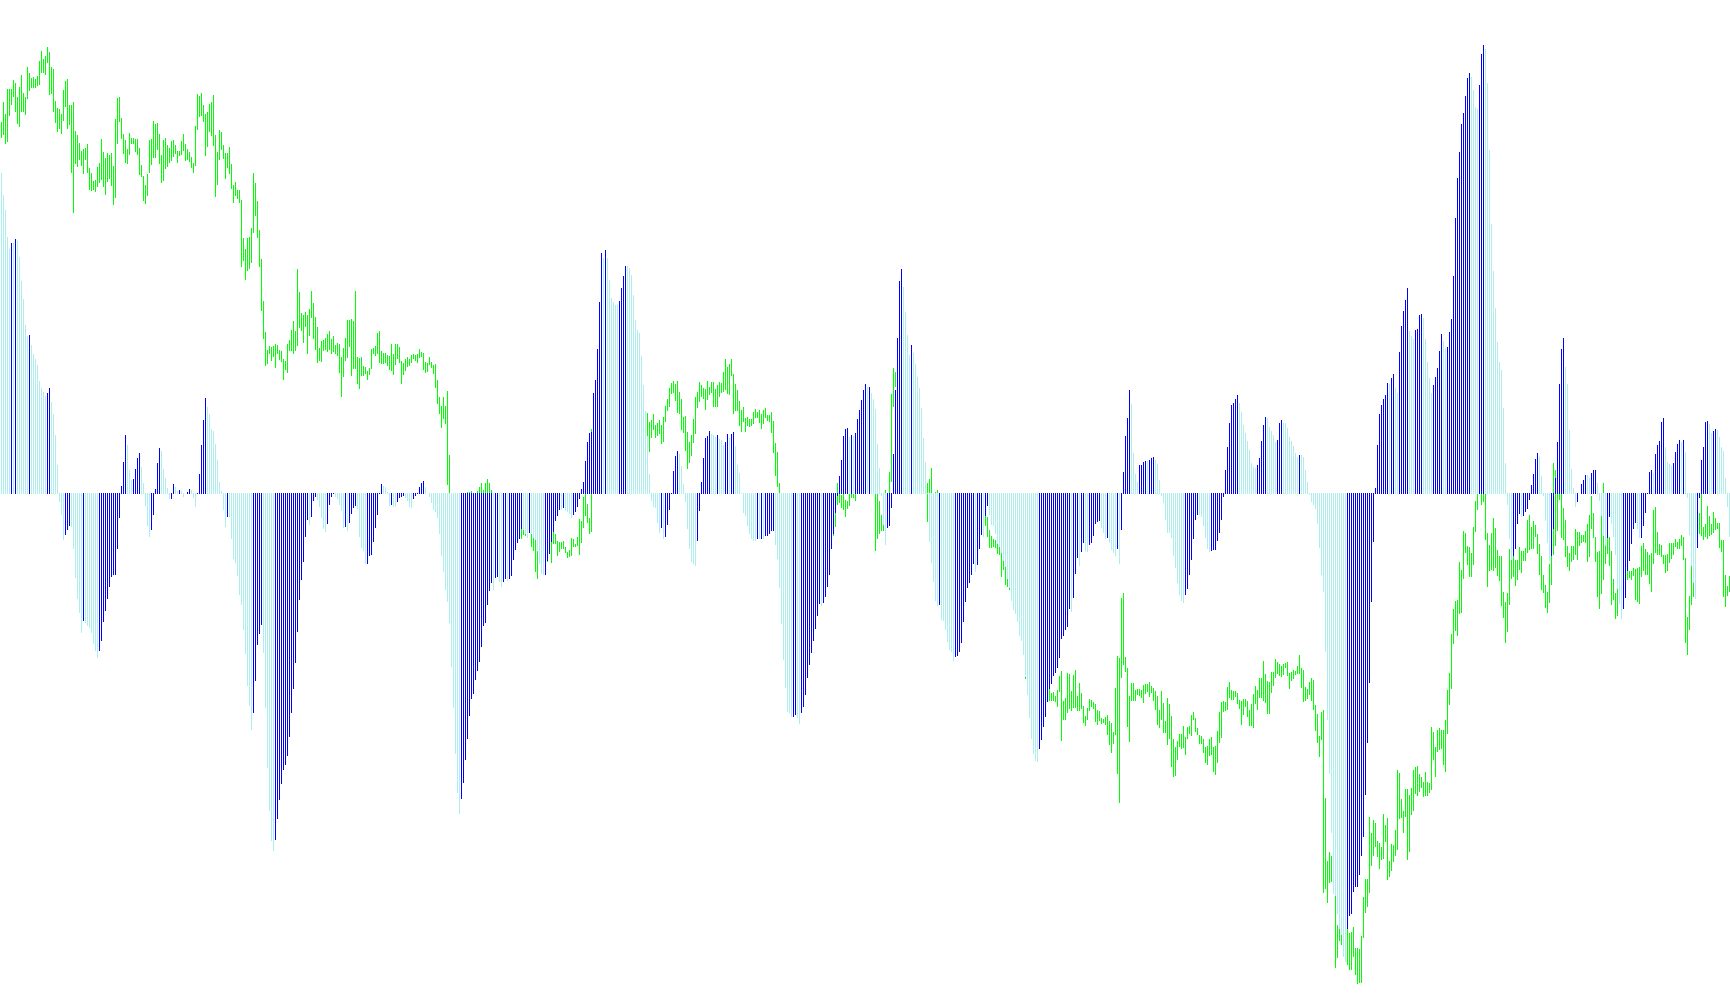
This indicator visualizes trend direction by calculating the difference between short and long moving averages across two distinct temporal scales, adjusted dynamically by timeframe magnification.

AO_4colors
Indicator

AO_4colors

iMA

This indicator identifies market velocity by calculating the difference between two moving averages and visualizing momentum strength through a four-color histogram based on directional shifts and zero-line positioning.

AO_alert
Indicator

AO_alert

iMA

This indicator identifies trend reversals by calculating the differential between 5 and 34 period moving averages and visualizing momentum shifts through dual-color histograms.

AO_Email Alerted
Indicator

AO_Email Alerted

iMAiMAOnArray

This indicator monitors the Awesome Oscillator for momentum shifts, triggering real-time alerts and emails upon zero-line crossovers and signal line intersections.

AO_MFI_MA_Ron_01
Indicator

AO_MFI_MA_Ron_01

iAOiMFIiMA

This indicator identifies directional shifts by detecting simultaneous bullish momentum and high-volume flow synchronization alongside dual exponential moving average tracking.

ArrayTest
Indicator

ArrayTest

iMA

This indicator visualizes the divergence between two distinct exponential moving averages to identify shifts in price velocity and trend acceleration.

ArrayTest_v1
Indicator

ArrayTest_v1

iMA

This indicator identifies trend shifts by calculating the divergence between a fast and slow exponential moving average to quantify price acceleration.

ArrZZx2 v3.9
Indicator

ArrZZx2 v3.9

iMA

This indicator utilizes a multi-layered signal processing approach by applying weighted moving averages, smoothing kernels, and recursive peak detection to filter noise and identify structural trend reversals.

ArrZZx2
Indicator

ArrZZx2

iMA

This indicator identifies structural market reversals by synthesizing weighted moving averages into a smoothed price ribbon to detect local extrema and trend-shifting pivot points.

ATM_DualBollingerBands
Indicator

ATM_DualBollingerBands

iMA

This indicator projects two distinct sets of volatility boundaries using independent standard deviation multipliers over a primary simple moving average base.

ATM_maHPF
Indicator

ATM_maHPF

iMAiMAOnArray

This indicator synthesizes multiple advanced moving average types—including Hull, Jurik, and T3—with a cross-over logic that triggers visual signals based on price deviations from a step-calculated mean.

ATM_maLPF
Indicator

ATM_maLPF

iMAiMAOnArray

This indicator identifies momentum shifts by comparing a customizable moving average—ranging from SMA to Jurik and Hull—against its own localized average over a defined step period.

Indicator

ATM_TSRdata

iMA
ATM_XpMA
Indicator

ATM_XpMA

iMAiMAOnArray

This indicator synthesizes multiple advanced moving average types with a dynamic look-back filter to generate directional trade signals via arrow markers and alerts.

ATM_xpMAv10bVS_25LWMAmedian
Indicator

ATM_xpMAv10bVS_25LWMAmedian

iMAiMAOnArray

This indicator identifies trend shifts by comparing a customizable moving average against a smoothed local mean to generate directional signals and price breach alerts.

ATR Channels
Indicator

ATR Channels

iATRiMA

This indicator projects three distinct dynamic price bands based on linear weighted moving averages and multiple ATR multipliers to visualize market volatility extremes.

ATR Channels_v1
Indicator

ATR Channels_v1

iATRiMA

This indicator overlays a central moving average with three distinct volatility bands calculated by projecting multiple ATR multipliers to identify price extremes.

ATR Channels_v2
Indicator

ATR Channels_v2

iATRiMA

This indicator plots a dynamic central moving average flanked by three distinct tiers of ATR-based volatility bands to visualize price expansion and contraction.

ATR_Bands
Indicator

ATR_Bands

iATRiMA

This indicator constructs self-adjusting bands by superimposing a multiplier of the Average True Range onto an Exponential Moving Average to visualize price extremes based on current market variance.

ATR_Channels
Indicator

ATR_Channels

iATRiMA

This indicator plots a central linear weighted moving average flanked by three distinct sets of expansion bands calculated via variable Average True Range multipliers.

ATR_Channels_VarTFs_mtf
Indicator

ATR_Channels_VarTFs_mtf

iATRiMA

This indicator projects triple volatility bands and a moving average by calculating Average True Range from higher timeframes relative to a secondary base timeframe.

Indicator

Attrib1

iMA
Indicator

Attrib2

iMA
Indicator

Attrib2a

iMA
Indicator

Attrib2b

iMA
Indicator

Attrib2_001

iMA
Indicator

Attrib3

iMA
Indicator

Attrib3a

iMA
Indicator

Attrib3b

iMA
Indicator

Attrib4

iMA
Indicator

Attrib4a

iMA
Indicator

Attrib4b

iMA
Indicator

AttribInd_2d

iMA
Indicator

AttribInd_2e

iMA
Indicator

AttribInd_3d

iMA
Indicator

AttribInd_3e

iMA
Indicator

AttribInd_3e_1

iMA
Indicator

AttribInd_4d

iMA
Indicator

AttribInd_4e

iMA
Attrib_to_File2_AUDUSD
Indicator

Attrib_to_File2_AUDUSD

iMA

This script iterates through a predefined array of currency pairs to extract and export synchronized Moving Average values across multiple timeframes into a structured CSV file.

Attrib_to_File2_EURCHF
Indicator

Attrib_to_File2_EURCHF

iMA

This script iterates through specified assets to extract and log historical price data alongside SMA values across multiple timeframes into a CSV file.

Attrib_to_File2_EURJPY
Indicator

Attrib_to_File2_EURJPY

iMA

Iterates through specified currency symbols to extract historical price data and multi-period Simple Moving Average values, recording them into localized CSV files.

Attrib_to_File2_GBPUSD
Indicator

Attrib_to_File2_GBPUSD

iMA

This script iterates through predefined currency pairs to extract and export historical price action and various Simple Moving Average values across M1, M5, H1, and H4 timeframes into a structured CSV file.

Attrib_to_File3_EURUSD
Indicator

Attrib_to_File3_EURUSD

iMA

Extracts and synchronizes Simple Moving Average values across multiple timeframes into a structured CSV file based on historical price points.

Attrib_to_File4_EURUSD
Indicator

Attrib_to_File4_EURUSD

iMA

This script extracts and saves historical price data alongside the arithmetic differences between multiple Simple Moving Averages across 5-minute, 1-hour, and 4-hour timeframes into a CSV file.

AudioAlerts20090201
Indicator

AudioAlerts20090201

iMACDiMAiStochastic

This indicator executes multi-factor confluence logic by synchronizing MACD trend shifts, Stochastic oscillator thresholds, and dual Exponential Moving Average crossovers to trigger precise entry alerts.

AutoEnvelope
Indicator

AutoEnvelope

iMAiStdDev

This indicator calculates dynamic trading bands around a moving average, using standard deviation smoothed by another moving average to adapt to market volatility, based on Alexander Elder's envelope concept.

Average_Change
Indicator

Average_Change

iMA

Calculates a high-exponent ratio between current opening prices and the linear weighted moving average of median prices to isolate localized momentum shifts.

Average_Change_High_Low
Indicator

Average_Change_High_Low

iMA

This indicator calculates the ratio of current price extremes to their simple moving average extremes raised to the fifth power to highlight non-linear volatility deviations.

Awesome User Variable
Indicator

Awesome User Variable

iMA

This indicator quantifies market momentum by calculating the divergence between short and long moving averages and visually distinguishing directional shifts via a color-coded histogram.