Indicator

bbsqueeze w Alert

iATRiMAiStdDev
bbsqueeze
Indicator

bbsqueeze

iATRiMAiStdDev

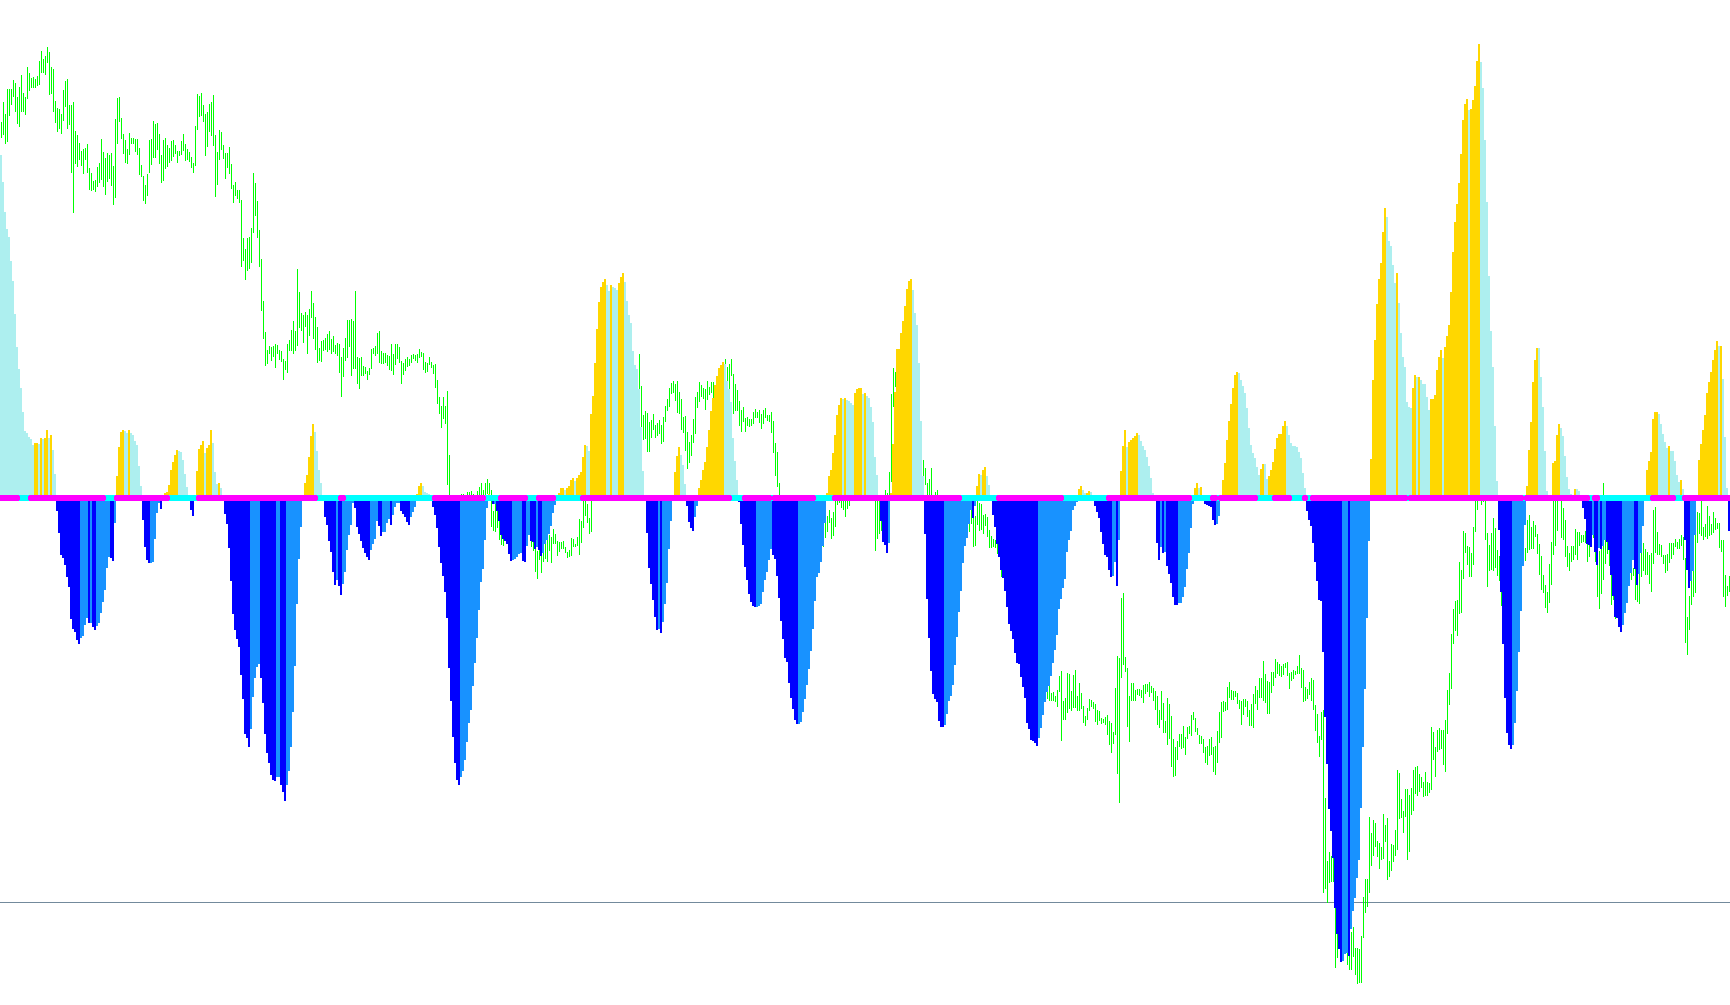
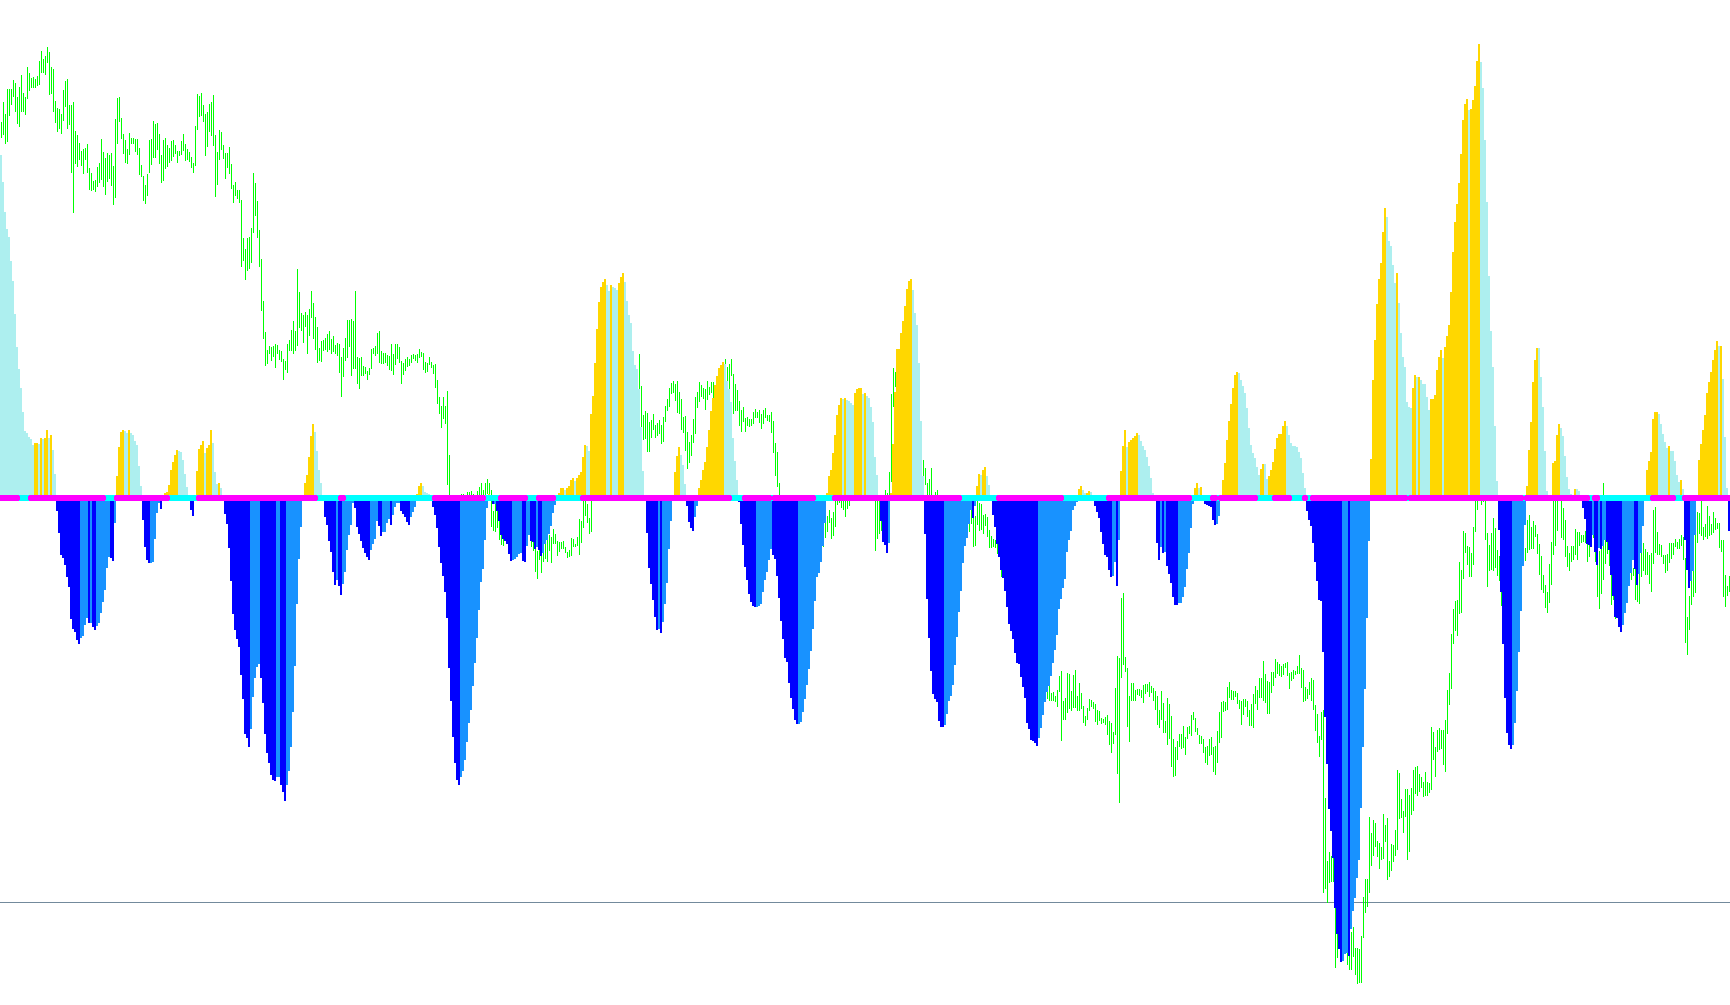
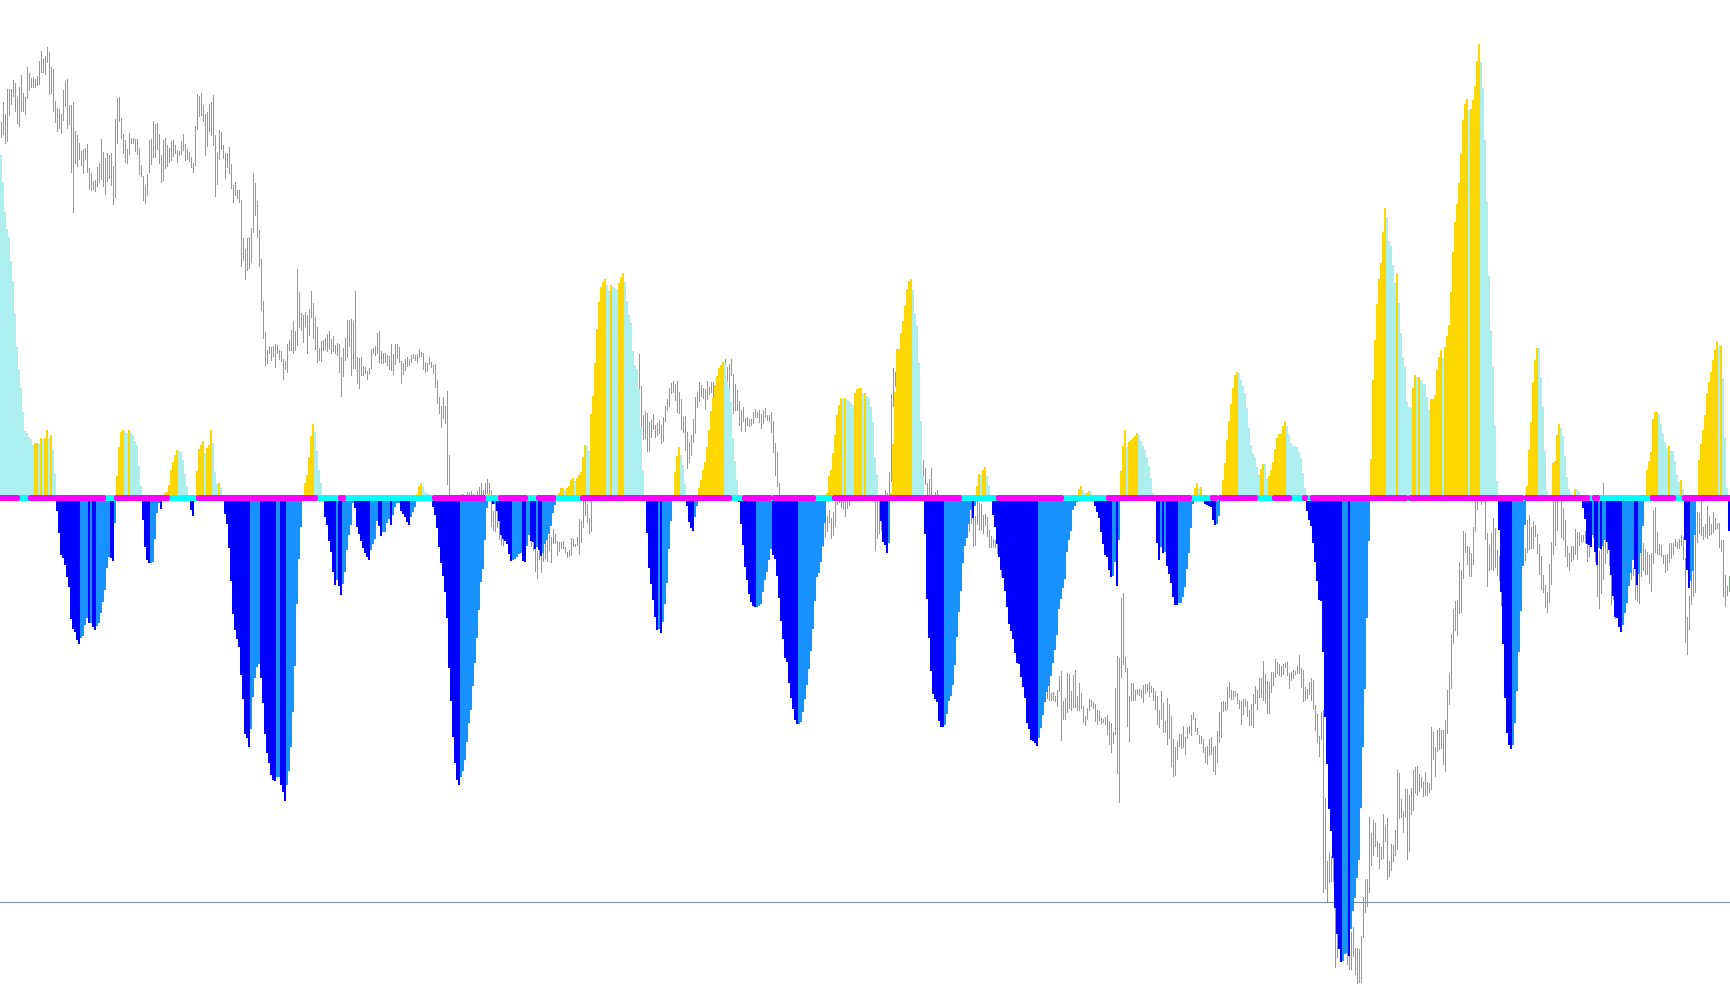
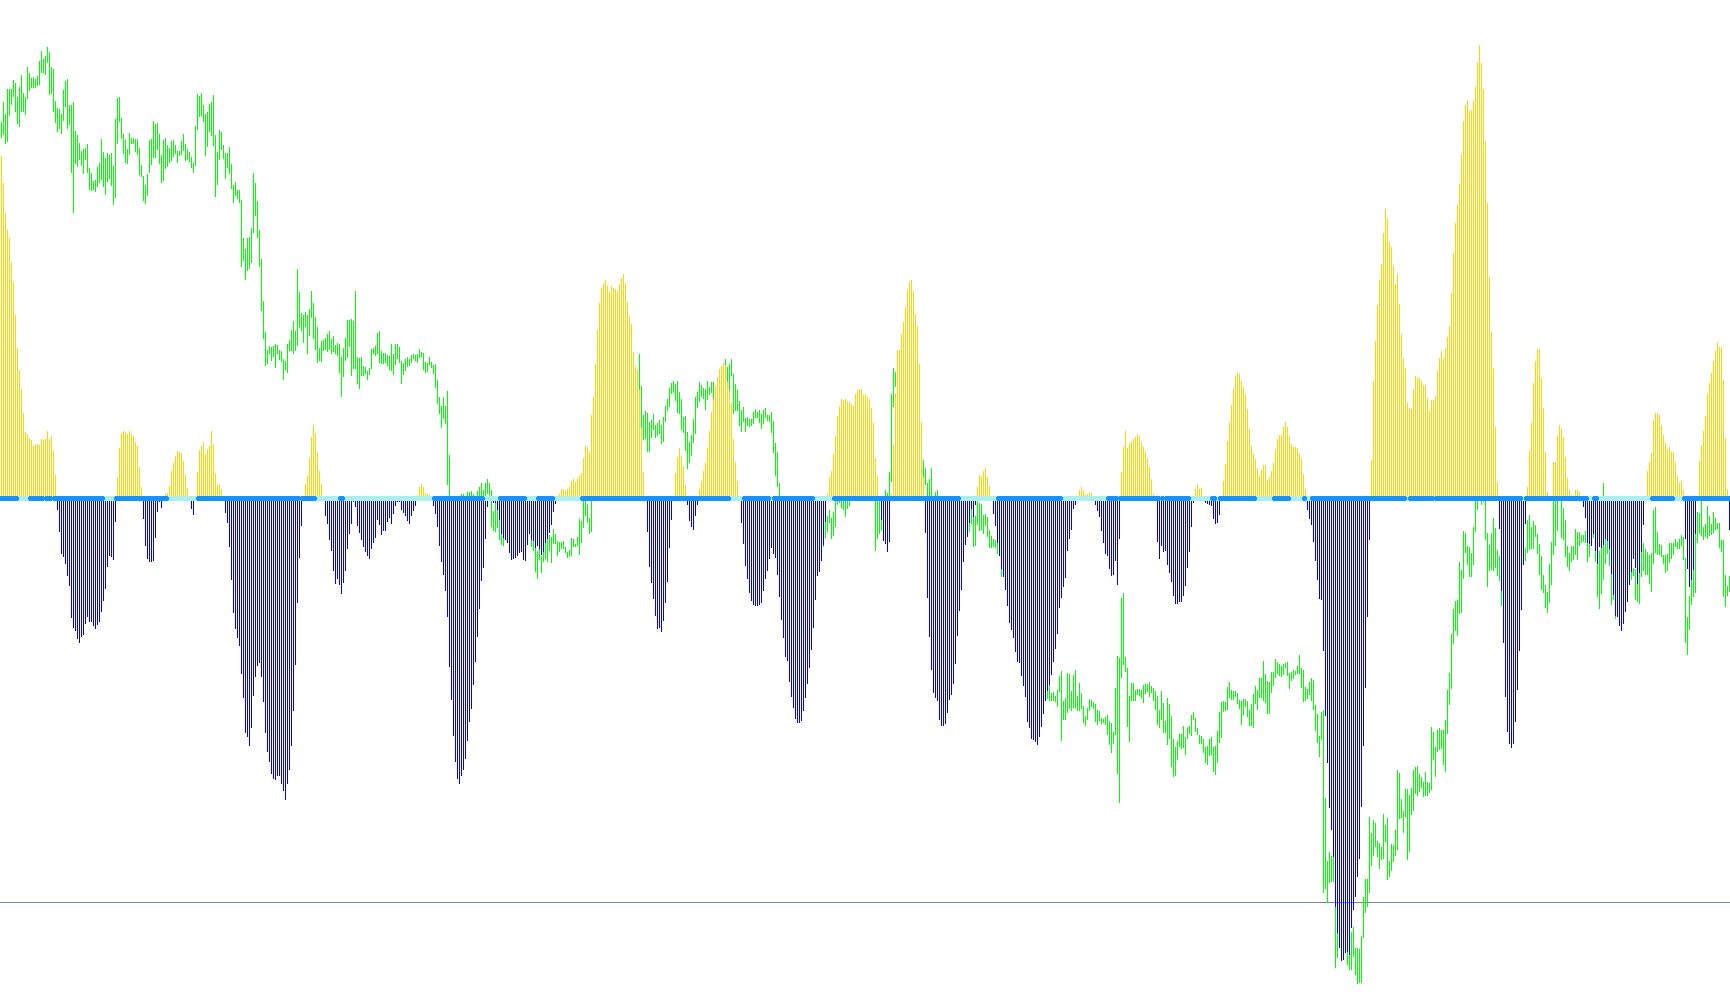
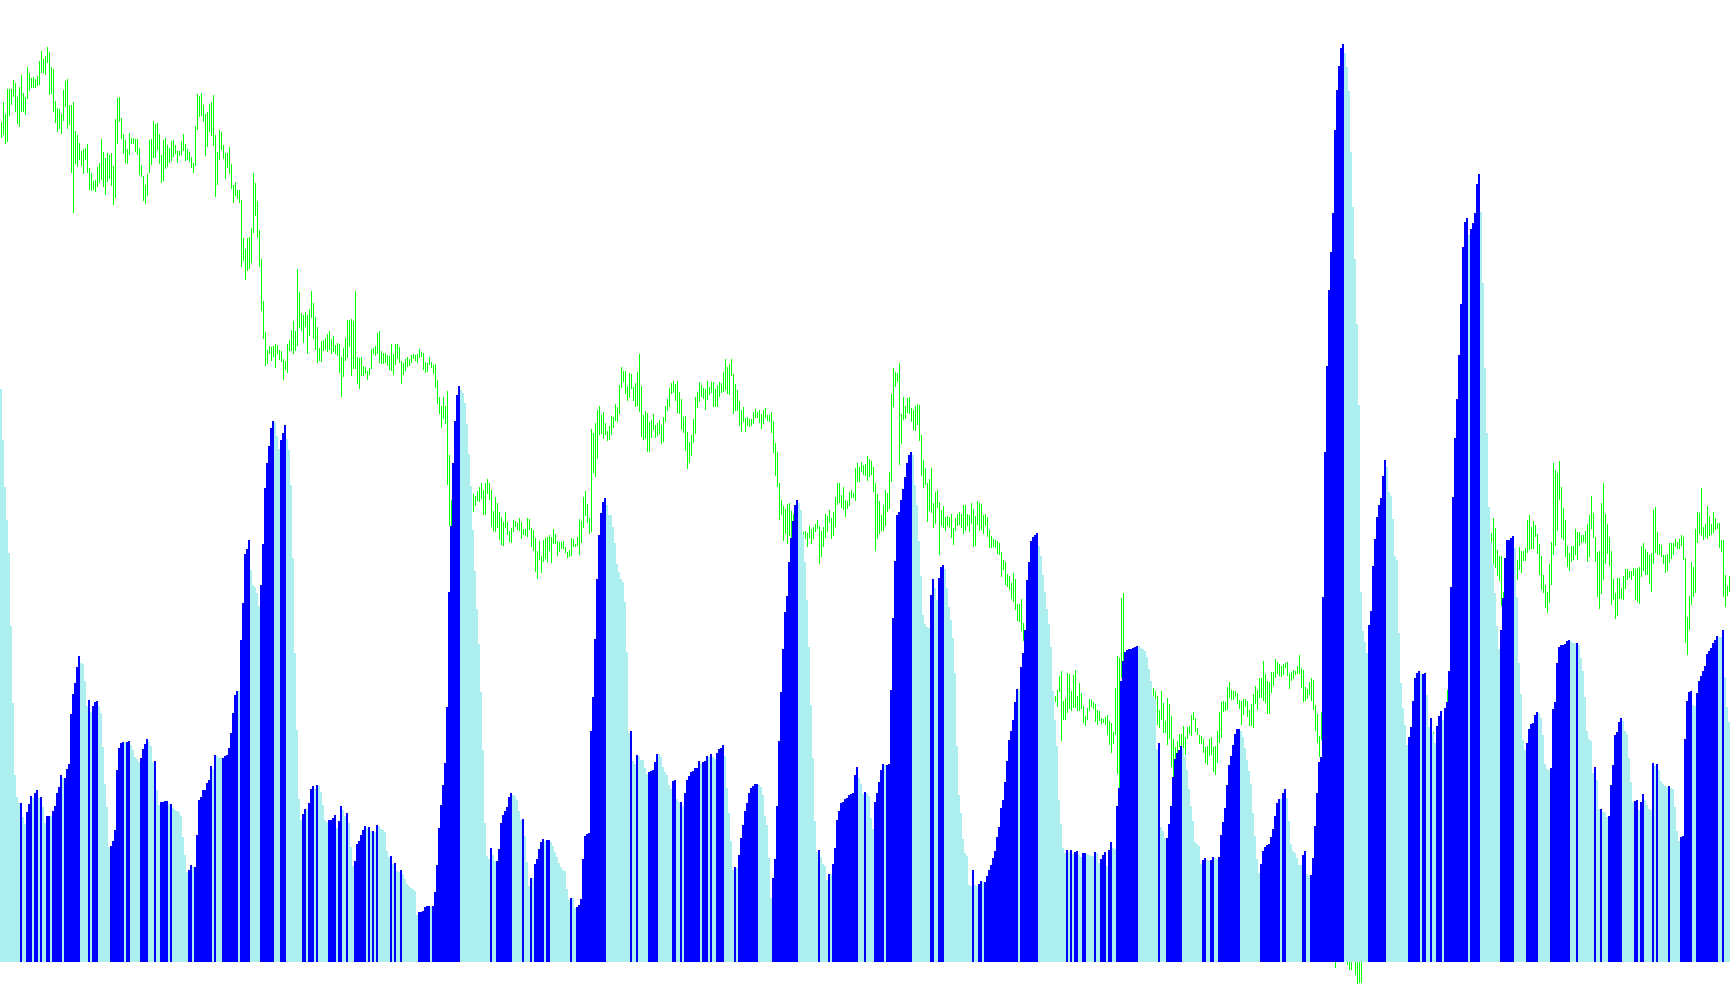
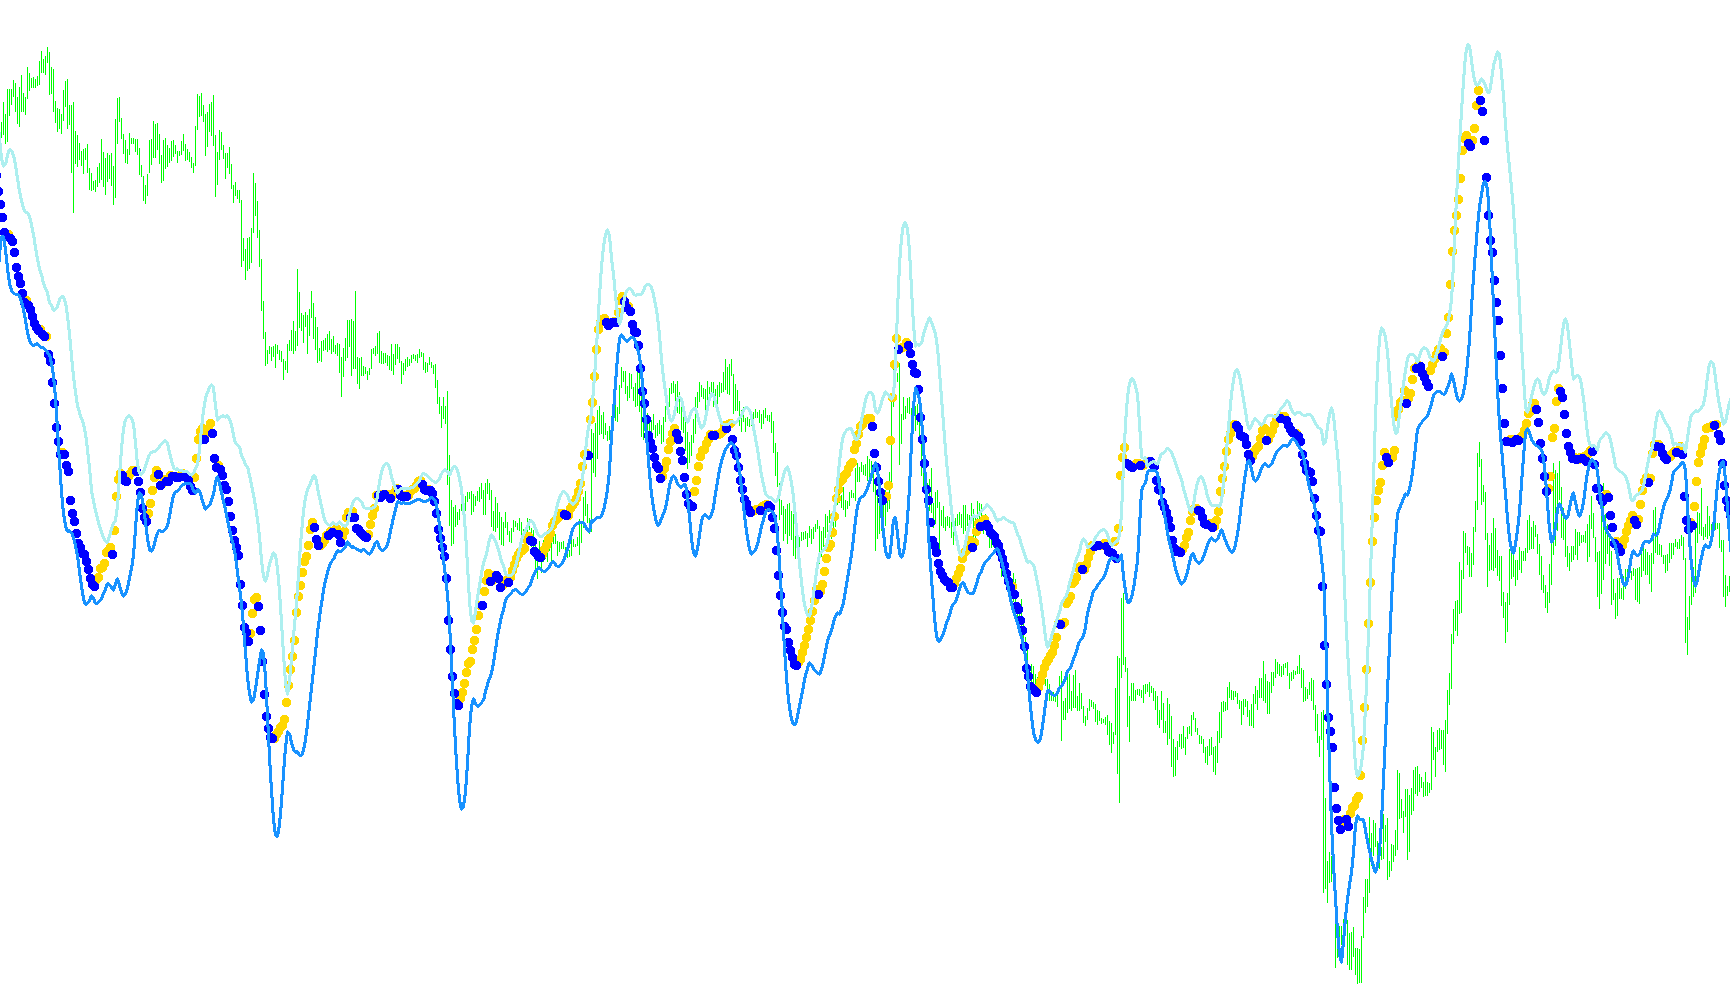
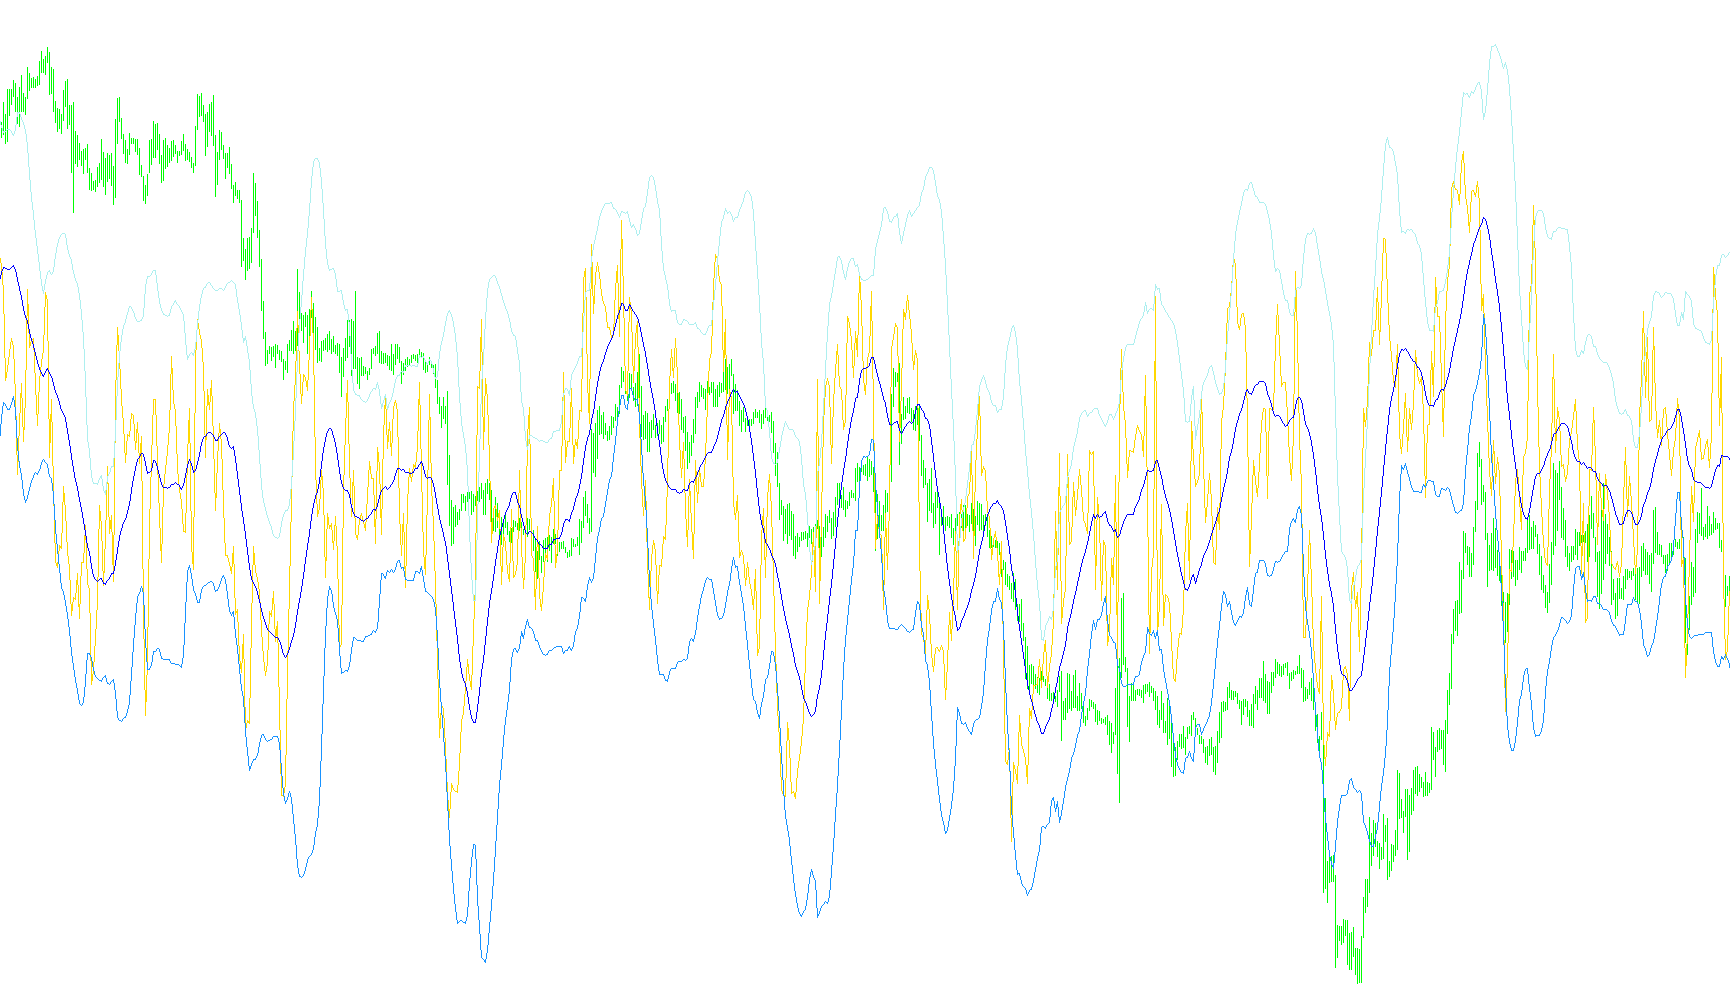
This indicator identifies high-volatility expansion phases by measuring the ratio between Bollinger Band deviation and ATR-adjusted volatility, while using linear regression slopes to determine trend direction.

bbsqueeze1
Indicator

bbsqueeze1

iATRiMAiStdDev

Identifies high-probability breakout opportunities by monitoring the ratio between linear regression slopes and volatility-adjusted standard deviations.

bbsqueeze1_v1
Indicator

bbsqueeze1_v1

iATRiMAiStdDev

This indicator identifies market compression by calculating the ratio between Bollinger Band volatility and Keltner Channel range against a linear regression trend line.

bbsqueezemodified
Indicator

bbsqueezemodified

iATRiMAiStdDev

This indicator identifies high-probability breakout points by detecting price compression through a ratio of Bollinger Band deviation to ATR volatility combined with linear regression momentum.

bbsqueeze_001
Indicator

bbsqueeze_001

iATRiMAiStdDev

This indicator identifies high-probability trend reversals by detecting periods of low volatility relative to linear regression price action.

bbsqueeze_003
Indicator

bbsqueeze_003

iATRiMAiStdDev

This indicator identifies trend momentum using a custom linear regression slope while signaling potential volatility breakouts by comparing standard deviation against ATR-based price expansion.

bbsqueeze_dark
Indicator

bbsqueeze_dark

iATRiMAiStdDev

This indicator identifies volatility compression and expansion by cross-referencing linear regression trends with a modified Bollinger Band squeeze metric.

bbsqueeze_dark[1]
Indicator

bbsqueeze_dark[1]

iATRiMAiStdDev

This indicator identifies bullish and bearish trend momentum via linear regression analysis while flagging volatility squeezes using a ratio of standard deviation to adjusted ATR.

bbsqueeze_dark_001
Indicator

bbsqueeze_dark_001

iATRiMAiStdDev

This indicator identifies trend reversals and volatility contractions by comparing linear regression slopes against a normalized standard deviation ratio.

bbsqueeze_v1
Indicator

bbsqueeze_v1

iATRiMAiStdDev

This indicator identifies potential trend breakouts by calculating the ratio between Bollinger Band standard deviation and ATR-based volatility to detect price compression.

BBStopLightv2
Indicator

BBStopLightv2

iMA

This indicator analyzes the relative expansion of Bollinger Band width against a linear weighted moving average to categorize market volatility states into actionable trading zones.

bbwin
Indicator

bbwin

iBandsiMA

This indicator synthesizes Bollinger Band deviations with dual-period moving average differentials to visualize market momentum and directional trend shifts.

BBwithFractdev
Indicator

BBwithFractdev

iMA

This indicator calculates a Bollinger Band variant by utilizing a Fibonacci-based deviation multiplier of 2.618 to project volatility extremes.

BBwithFractdev_v1
Indicator

BBwithFractdev_v1

iMA

This indicator calculates a dynamic volatility channel by overlaying Fibonacci-based deviation multipliers onto a simple moving average to identify extreme price excursions.

BBwithFractdev_v2
Indicator

BBwithFractdev_v2

iMA

This indicator calculates a Bollinger Band variant using the Golden Ratio (2.618) as the standard deviation multiplier to identify extreme price extensions.

BB_-_HL
Indicator

BB_-_HL

iMA

This indicator calculates a dynamic trading envelope by determining the maximum squared deviation of the price range from a simple moving average to quantify extreme volatility.

BB_FlatSq_mtf_sw
Indicator

BB_FlatSq_mtf_sw

iATRiMAiStdDev

This indicator identifies high-volatility expansion zones by calculating price deviations from moving averages while filtering for market compression using a Bollinger Squeeze logic.

BB_MACD
Indicator

BB_MACD

iMAiMAOnArrayiStdDevOnArray

This indicator calculates the divergence between fast and slow exponential moving averages and overlays Bollinger Bands to identify trend exhaustion and momentum shifts.

BB_MACD3
Indicator

BB_MACD3

iMAiMAOnArrayiStdDevOnArray

This indicator overlays a Bollinger Band envelope onto a MACD calculation to identify volatility-adjusted trend shifts and momentum extremes.

BB_MACD3_v1
Indicator

BB_MACD3_v1

iMAiMAOnArrayiStdDevOnArray

This indicator overlays Bollinger Bands onto a MACD calculation to identify trend reversals and price momentum exhaustion through standard deviation variance.

BB_MACD_CCT
Indicator

BB_MACD_CCT

iMAiMAOnArrayiStdDevOnArray

This indicator synthesizes MACD momentum with Bollinger Band volatility bounds to visualize directional shifts and price-action extremes.

BB_MACD_funcs
Indicator

BB_MACD_funcs

iMAiMAOnArray

This library provides custom functions to compute multi-method Bollinger Bands with precise deviation scaling alongside a dynamic MACD calculation for identifying price extremes and trend velocity.

BB_MACD_v1.01
Indicator

BB_MACD_v1.01

iMAiMAOnArrayiStdDevOnArray

This indicator calculates a MACD signal and applies Bollinger Band envelopes to the momentum values to identify trend exhaustion and volatility extremes.

BB_MACD_v1.03
Indicator

BB_MACD_v1.03

iMAiMAOnArrayiStdDevOnArray

This indicator identifies trend shifts by applying Bollinger Band volatility filters to the differential momentum of Exponential Moving Averages.

BB_MACD_v1
Indicator

BB_MACD_v1

iMAiMAOnArrayiStdDevOnArray

This indicator overlays Bollinger Bands onto a MACD calculation to identify momentum shifts and volatility-adjusted trend reversals.

BB_MACD_v3
Indicator

BB_MACD_v3

iMAiMAOnArrayiStdDevOnArray

This indicator overlays a Bollinger Band volatility envelope onto the MACD momentum oscillator to identify extreme price velocity and trend exhaustion points.

bb_osma
Indicator

bb_osma

iMAiMAOnArrayiStdDevOnArray

This indicator synthesizes an Oscillator-based Moving Average with a dynamic volatility envelope to identify trend momentum and structural reversals.

BB_RSI_v2_AlertEmail
Indicator

BB_RSI_v2_AlertEmail

iMA

This indicator calculates a Relative Strength Index and overlays Bollinger Bands onto it to identify extreme momentum exhaustion zones.

BB_SqueezeLRSml_4c
Indicator

BB_SqueezeLRSml_4c

iATRiMAiStdDev

This indicator identifies volatility compression by calculating the ratio between Bollinger Band deviation and Keltner Channel width while mapping price momentum via linear regression slopes.

BB_SqueezeLRSm_4c
Indicator

BB_SqueezeLRSm_4c

iATRiMAiStdDev

This indicator identifies market volatility compression by comparing Keltner Channel width against Bollinger Band standard deviation while plotting linear regression slopes to detect directional momentum shifts.

Indicator

BB_Squeeze_Advanced_v2

iCCIiMACDiRSIiStochastic
Indicator

BB_Squeeze_Advanced_v2M

iCCIiMACDiRSIiStochastic
Indicator

BB_Squeeze_Advanced_v2M2

iCCIiMACDiRSIiStochastic
Indicator

BB_Squeeze_Advanced_v2M3

iCCIiMACDiRSIiStochastic
Indicator

BB_Squeeze_Advanced_v2M3B

iCCIiMACDiRSIiStochastic
Indicator

BB_Squeeze_Advanced_v2M3BC

iCCIiMACDiRSIiStochastic
Indicator

BB_Squeeze_Advanced_v2_v1

iCCIiMACDiRSIiStochastic
BDFXtrender
Indicator

BDFXtrender

iMA

This indicator utilizes a weighted price summation algorithm combined with an Exponential Moving Average crossover to identify trend momentum and directional shifts.

BearBulls
Indicator

BearBulls

iMA

This indicator quantifies market sentiment by calculating the arithmetic distance between price extremes and a multi-period exponential moving average to visualize buying and selling pressure.

Bears
Indicator

Bears

iMA

This indicator quantifies bearish pressure by measuring the vertical distance between the current low price and a smoothing exponential moving average.

BearsBullsImpuls-2b
Indicator

BearsBullsImpuls-2b

iMA

This indicator quantifies market sentiment by measuring the aggregate deviation of high and low prices relative to a customizable moving average to determine bullish or bearish dominance.

Bears_001
Indicator

Bears_001

iMA

This indicator quantifies bearish momentum by calculating the real-time divergence between the current price floor and a smoothed exponential moving average.

Bears_mod_rickW
Indicator

Bears_mod_rickW

iMAiMAOnArray

This indicator quantifies bearish momentum by calculating the negative divergence between current low prices and an exponential moving average, smoothed by a secondary simple moving average.

Bear_Bulls_Power
Indicator

Bear_Bulls_Power

iMA

This indicator quantifies market dominance by calculating the average distance between price extremes and an Exponential Moving Average to visualize bullish or bearish momentum shifts.

Begashole
Indicator

Begashole

iMA

This indicator plots two distinct Exponential Moving Average lines at periods of 144 and 169 to visualize long-term trend trajectories and structural price shifts.

Better_H1
Indicator

Better_H1

iMA

This indicator synchronizes and plots Simple Moving Average values from M5, H1, and H4 timeframes onto a single chart to visualize cross- khung trend alignment.

Better_H1_1
Indicator

Better_H1_1

iMA

This indicator synchronizes and plots moving average values from the H1 timeframe onto the current chart to visualize higher-level trend dynamics.

Better_H1_2
Indicator

Better_H1_2

iMA

This indicator visualizes the synchronization of Simple Moving Averages across the M5, H1, and H4 timeframes to identify high-level trend alignment.

Better_H1_diff
Indicator

Better_H1_diff

iMA

This indicator calculates and visualizes the dynamic variance between three distinct Simple Moving Average lengths (5, 10, and 15) across various higher timeframes to identify momentum shifts.