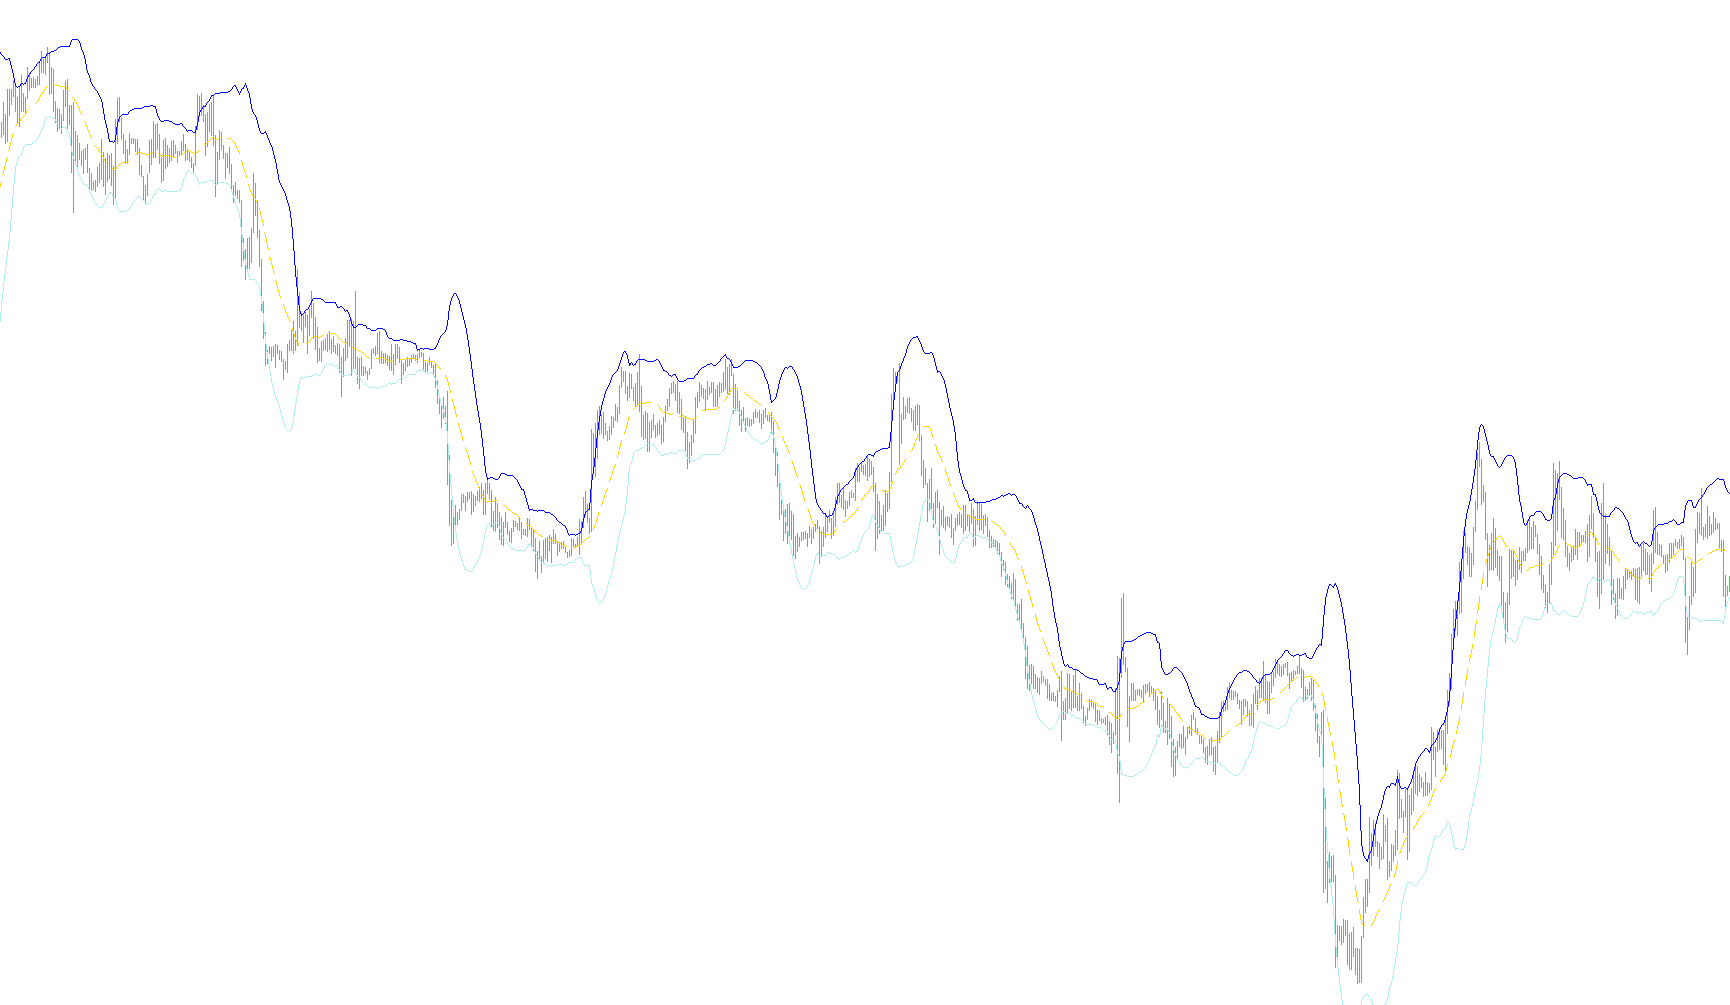
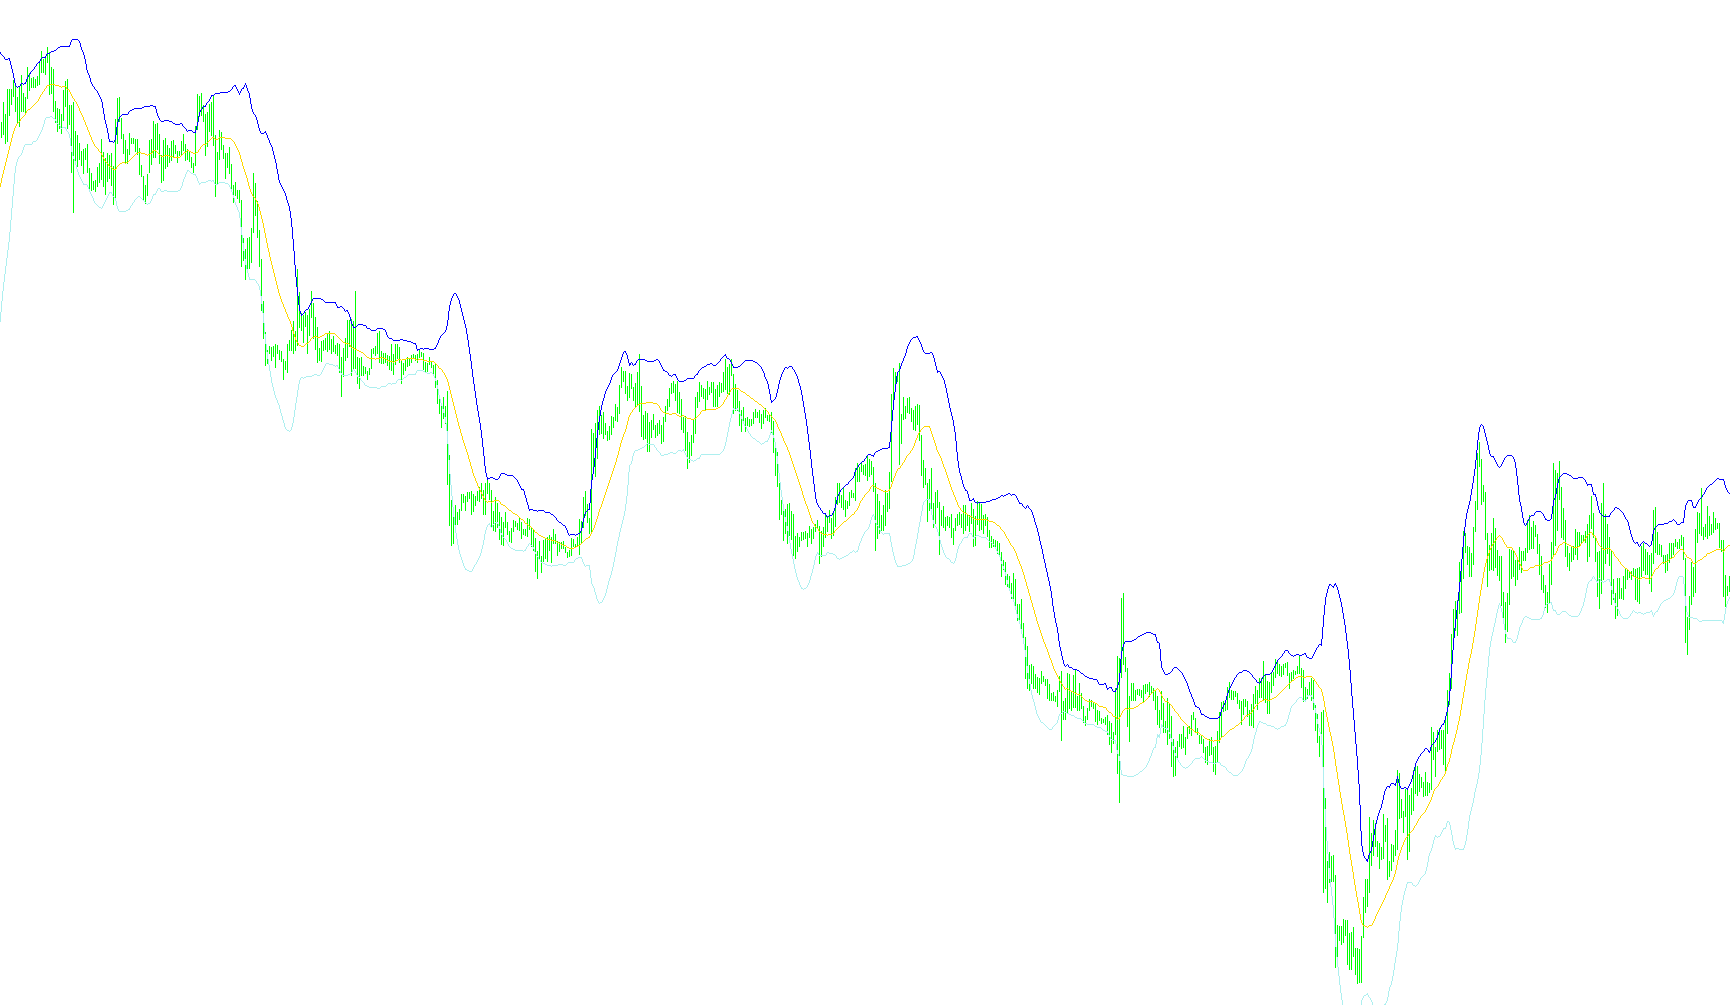
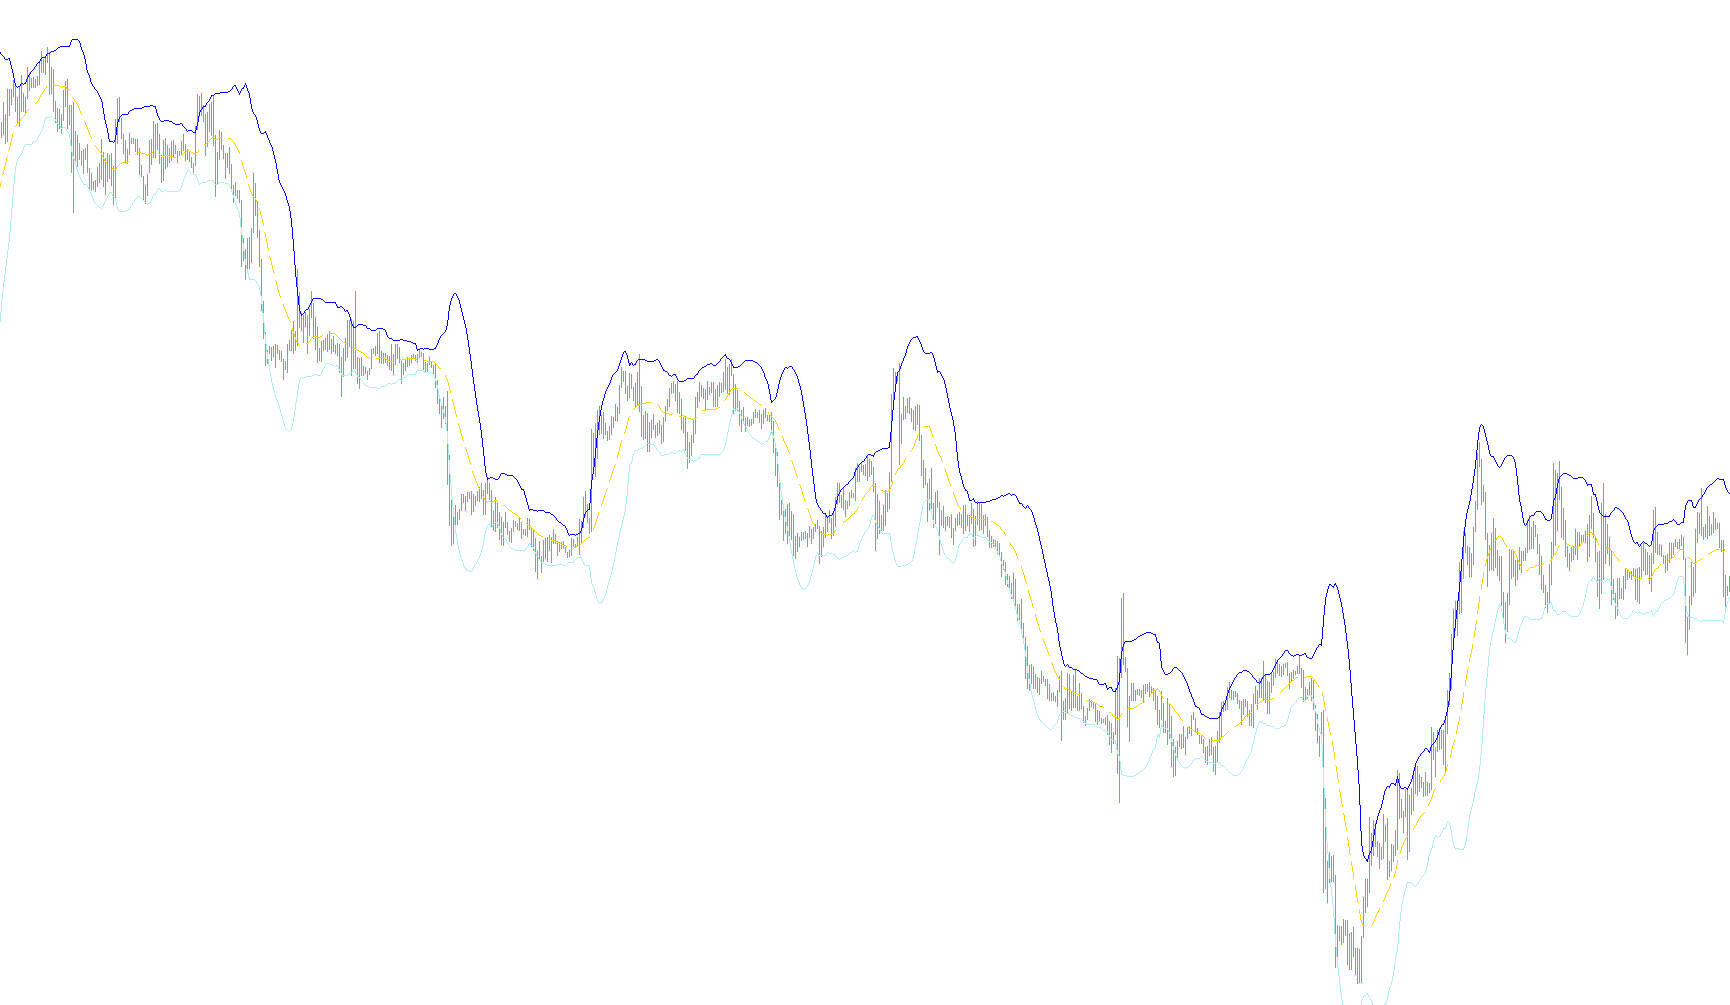
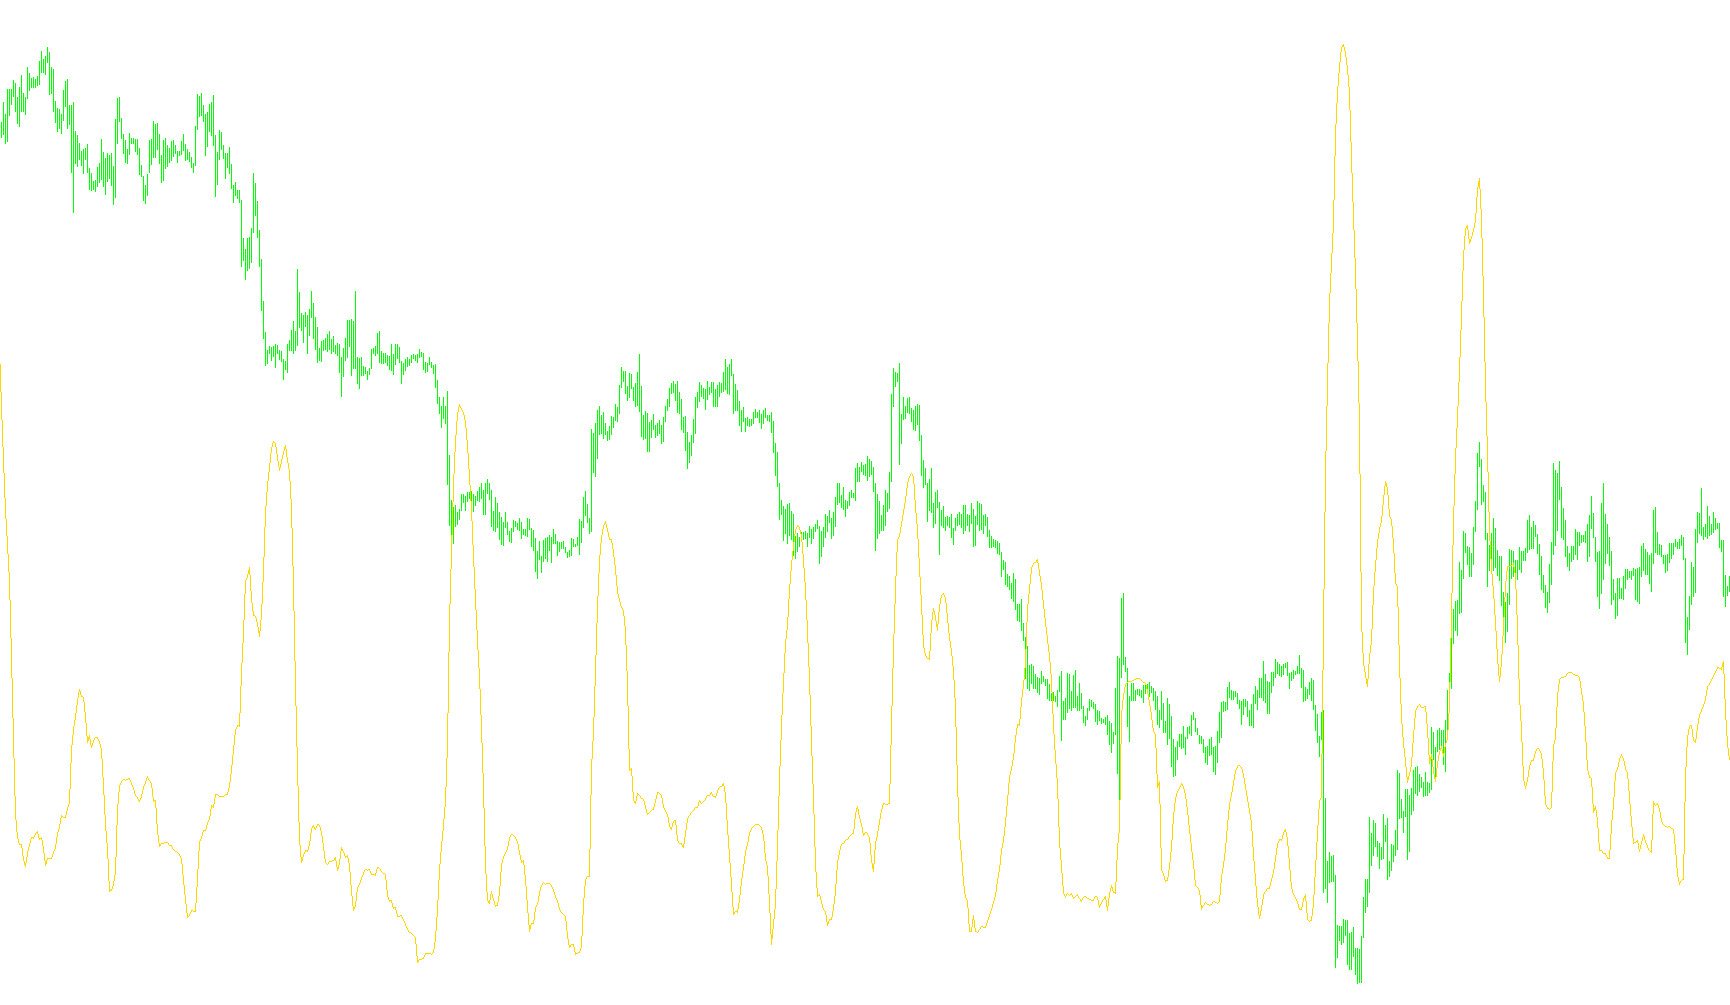
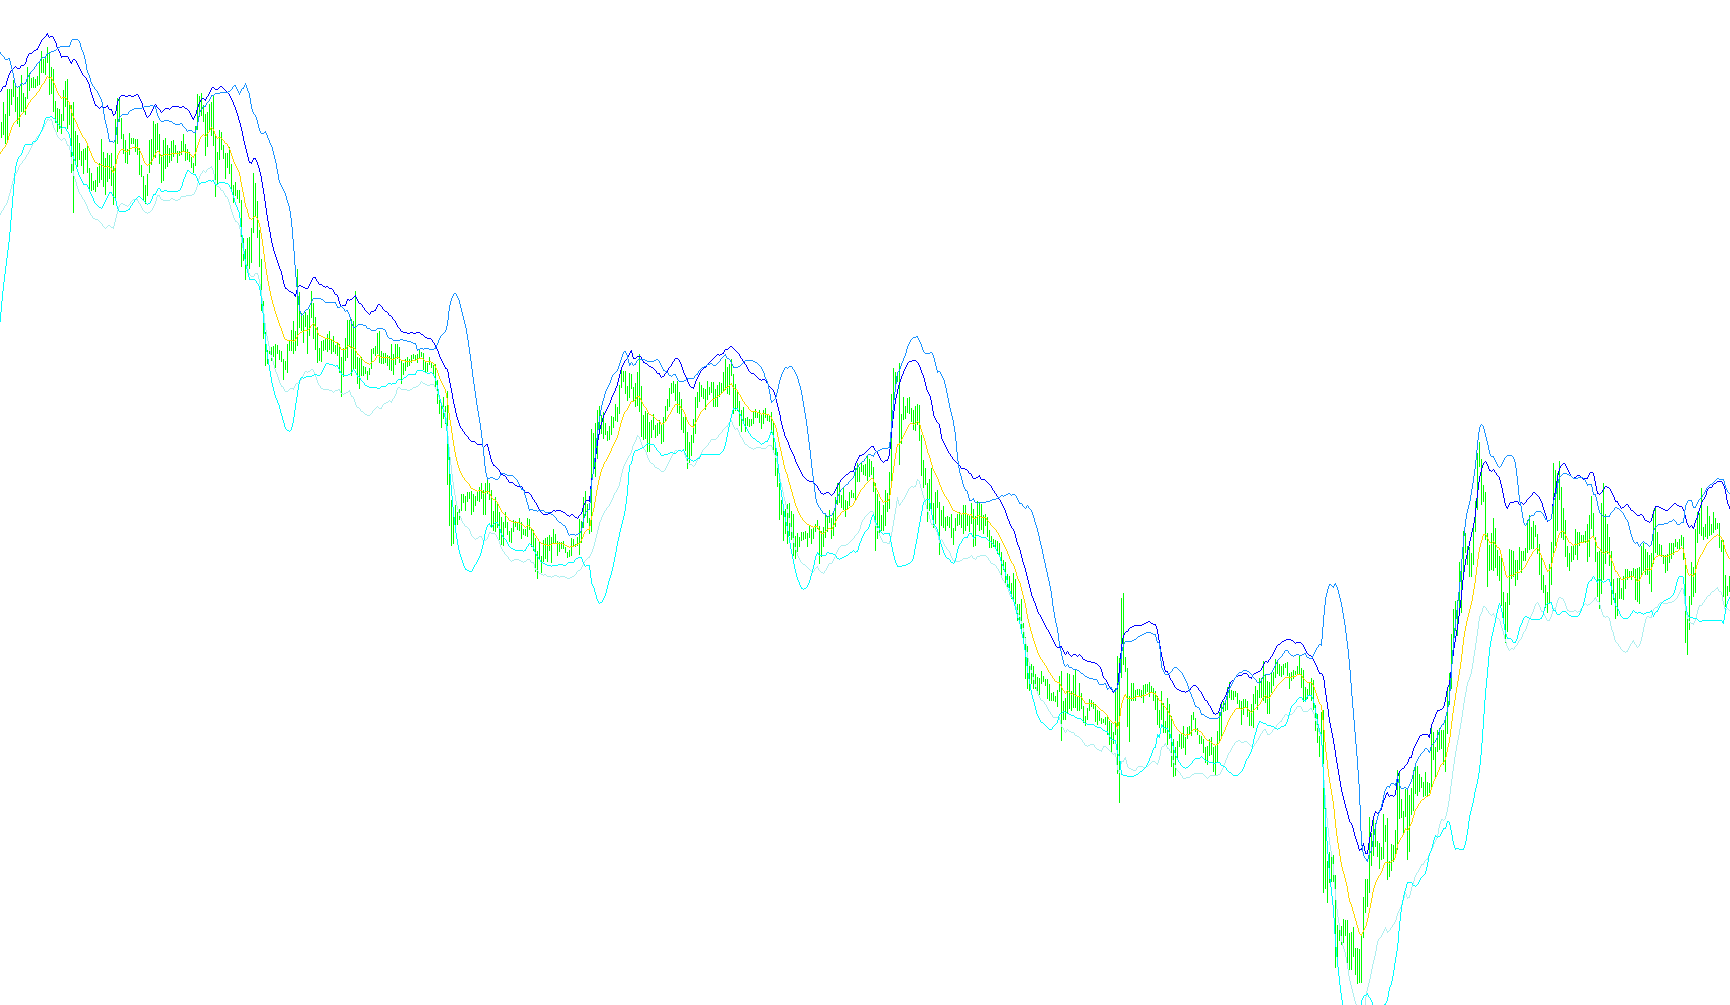
Better_H1_diff_001
Indicator

Better_H1_diff_001

iMA

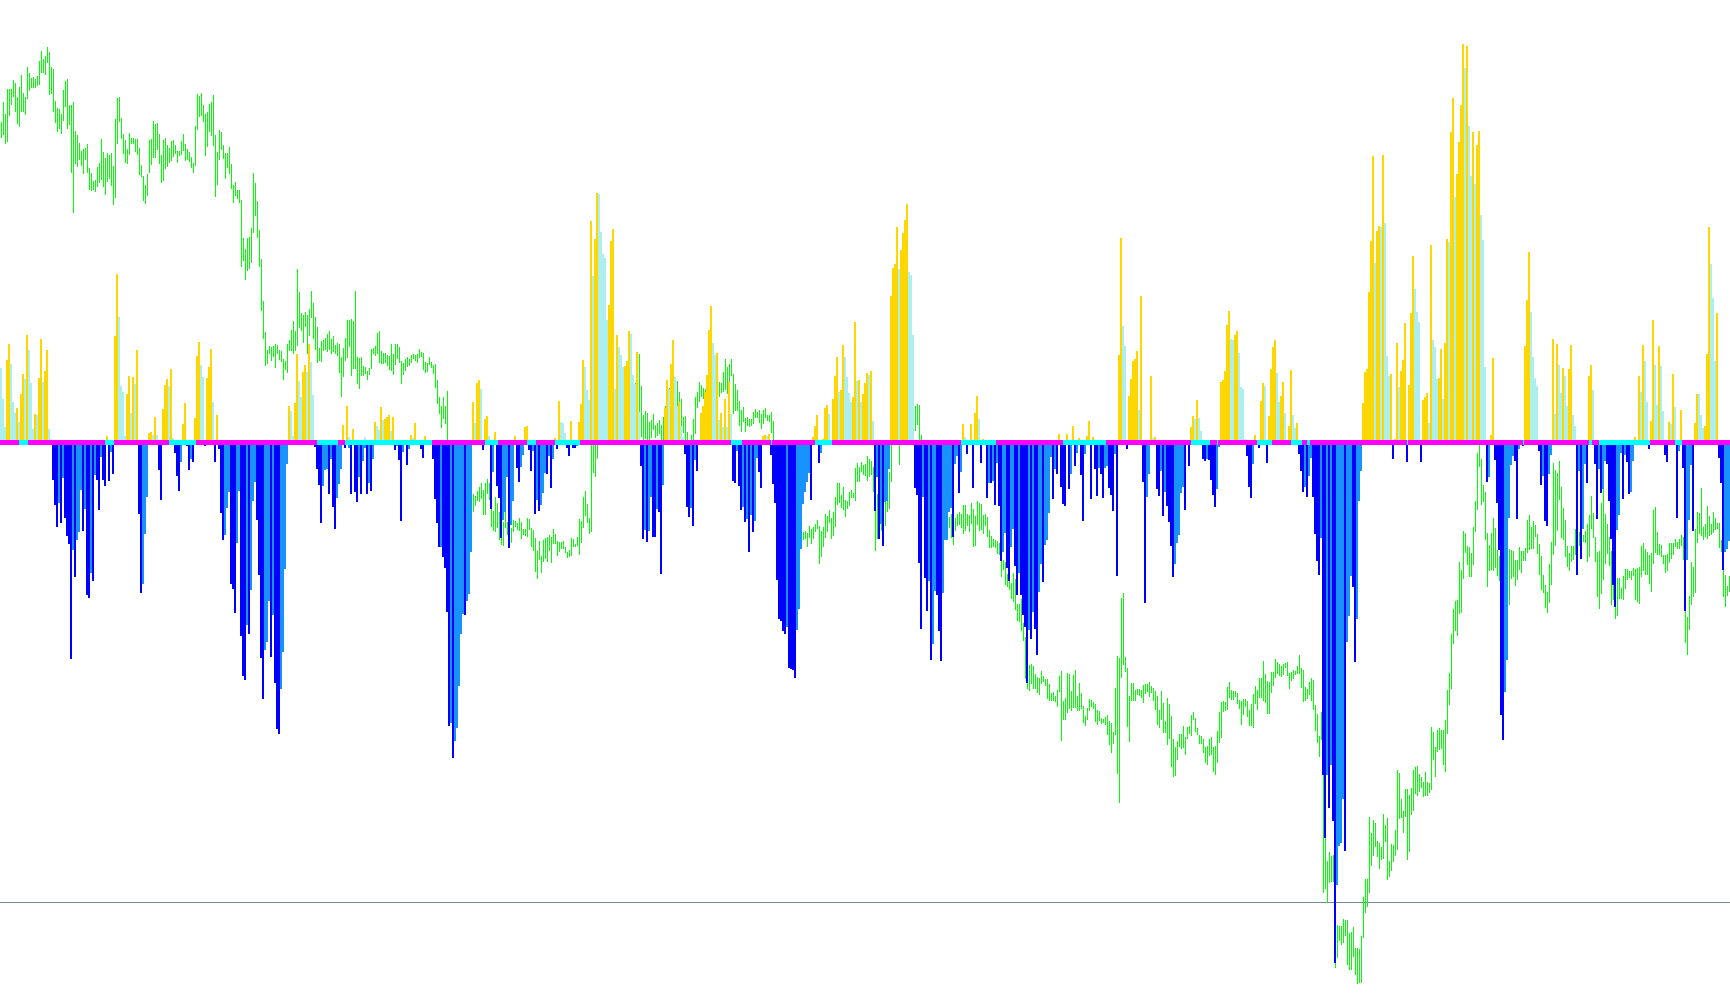
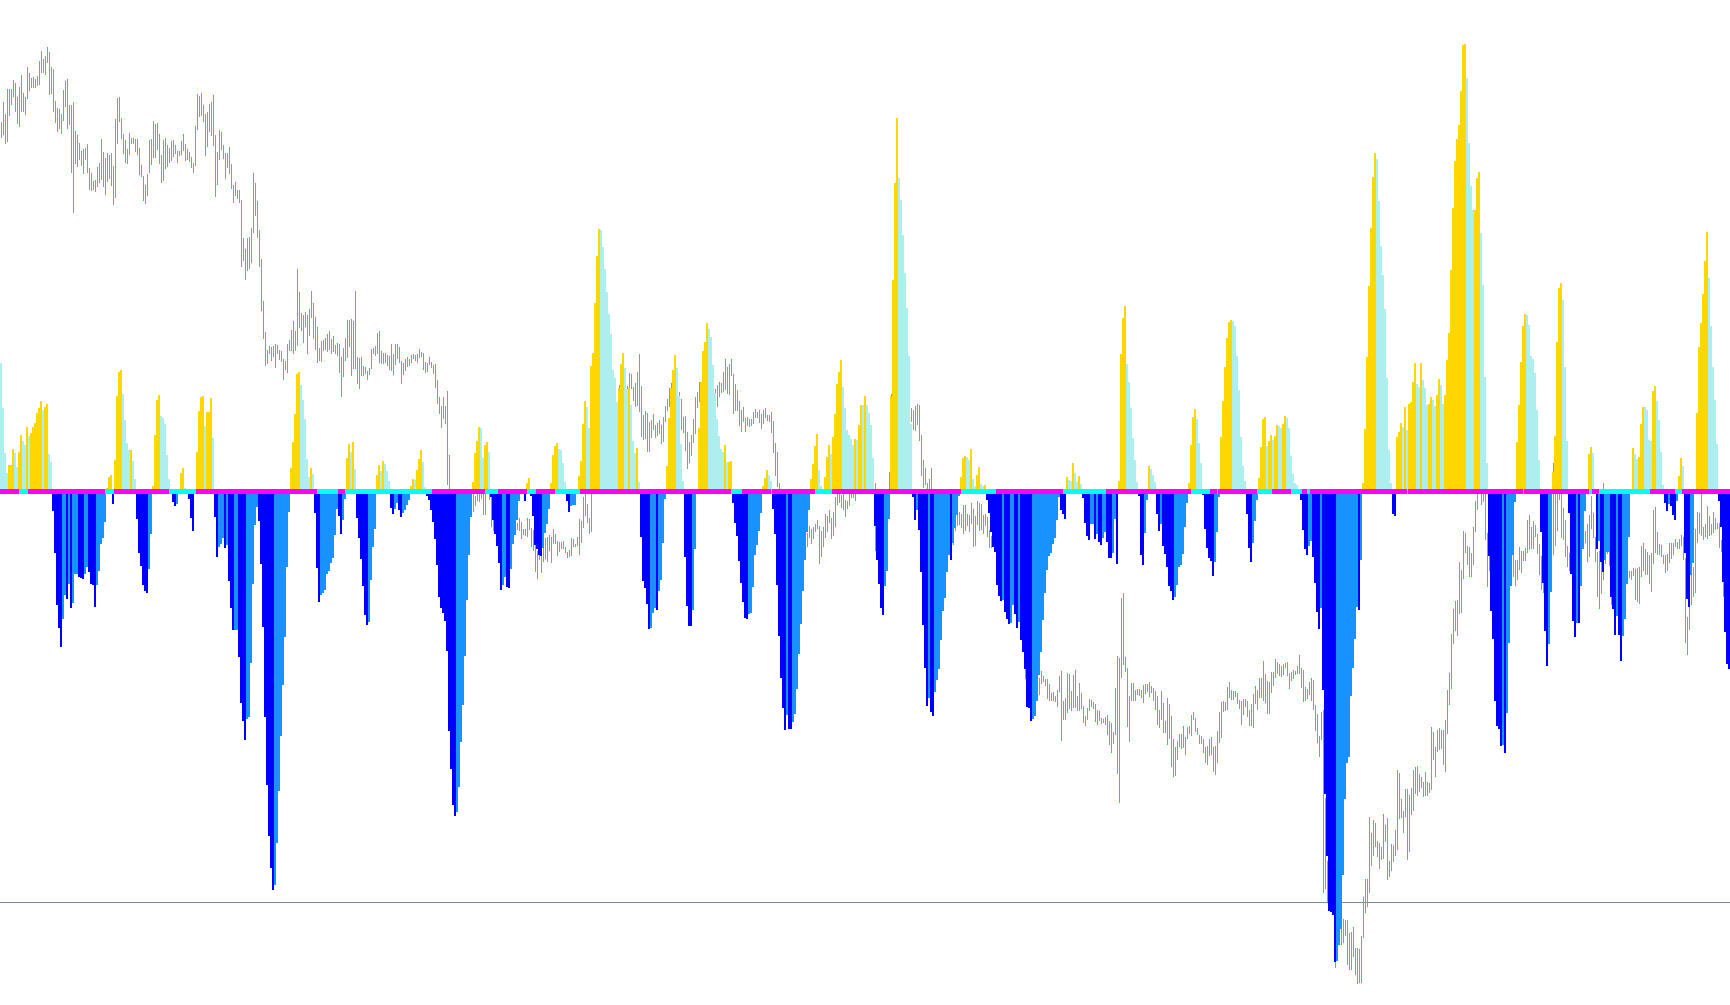
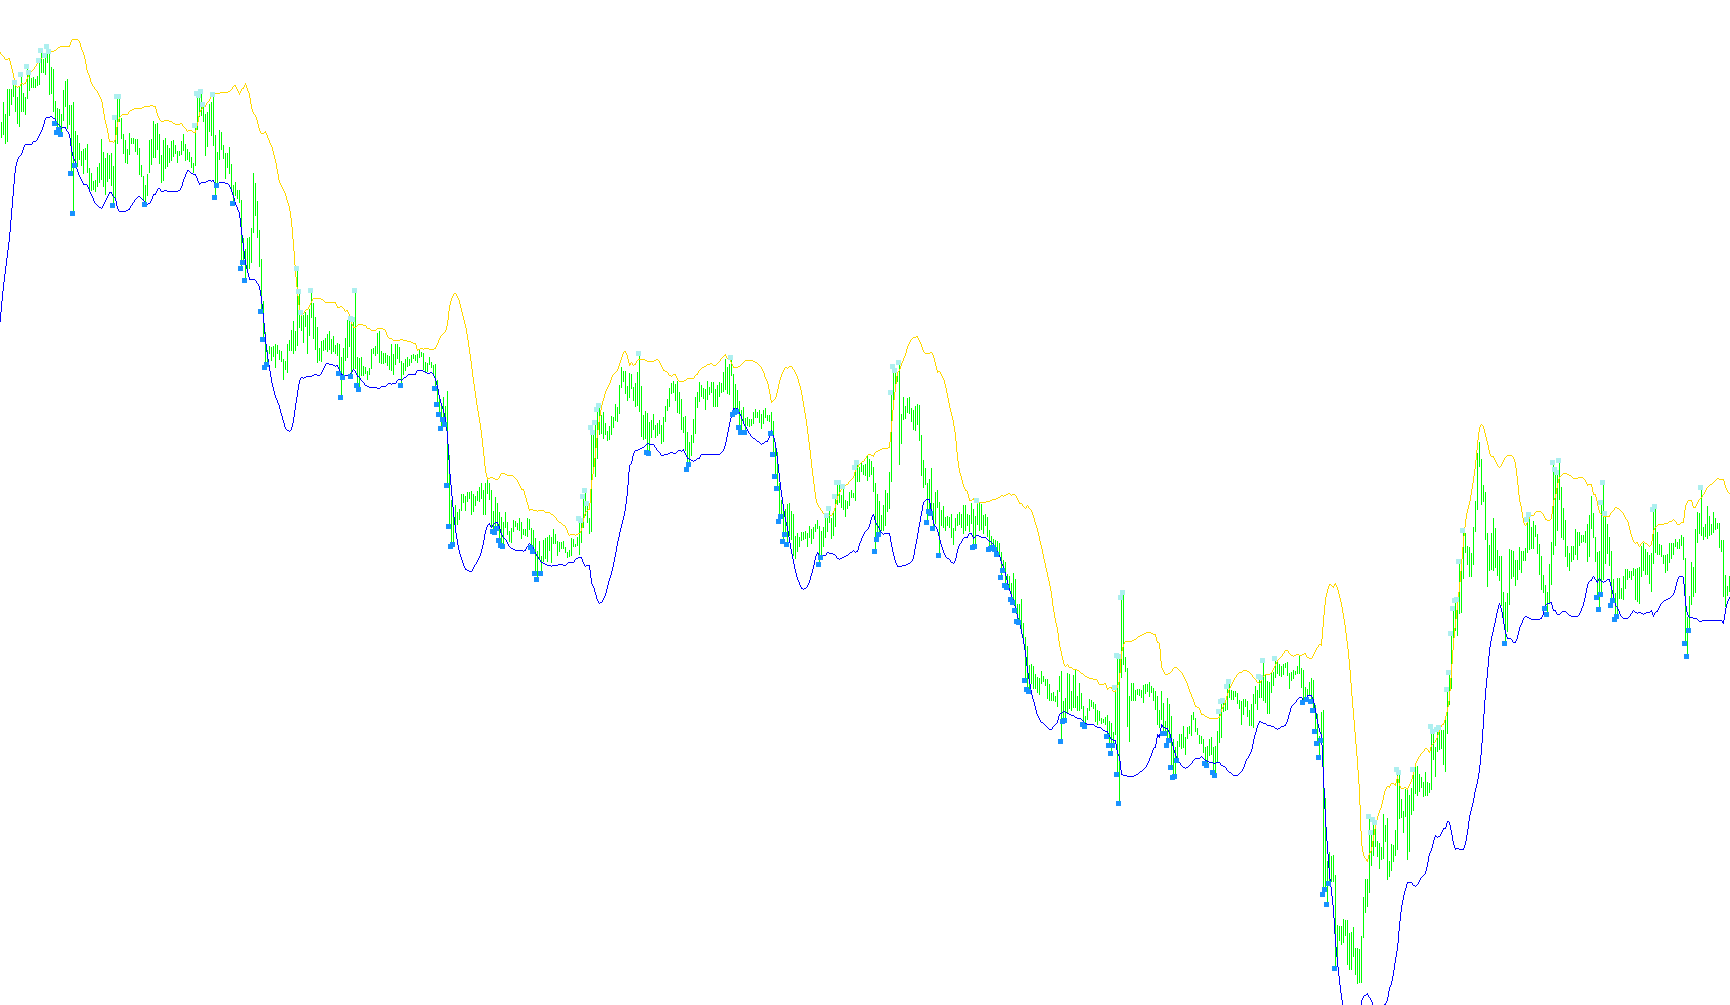
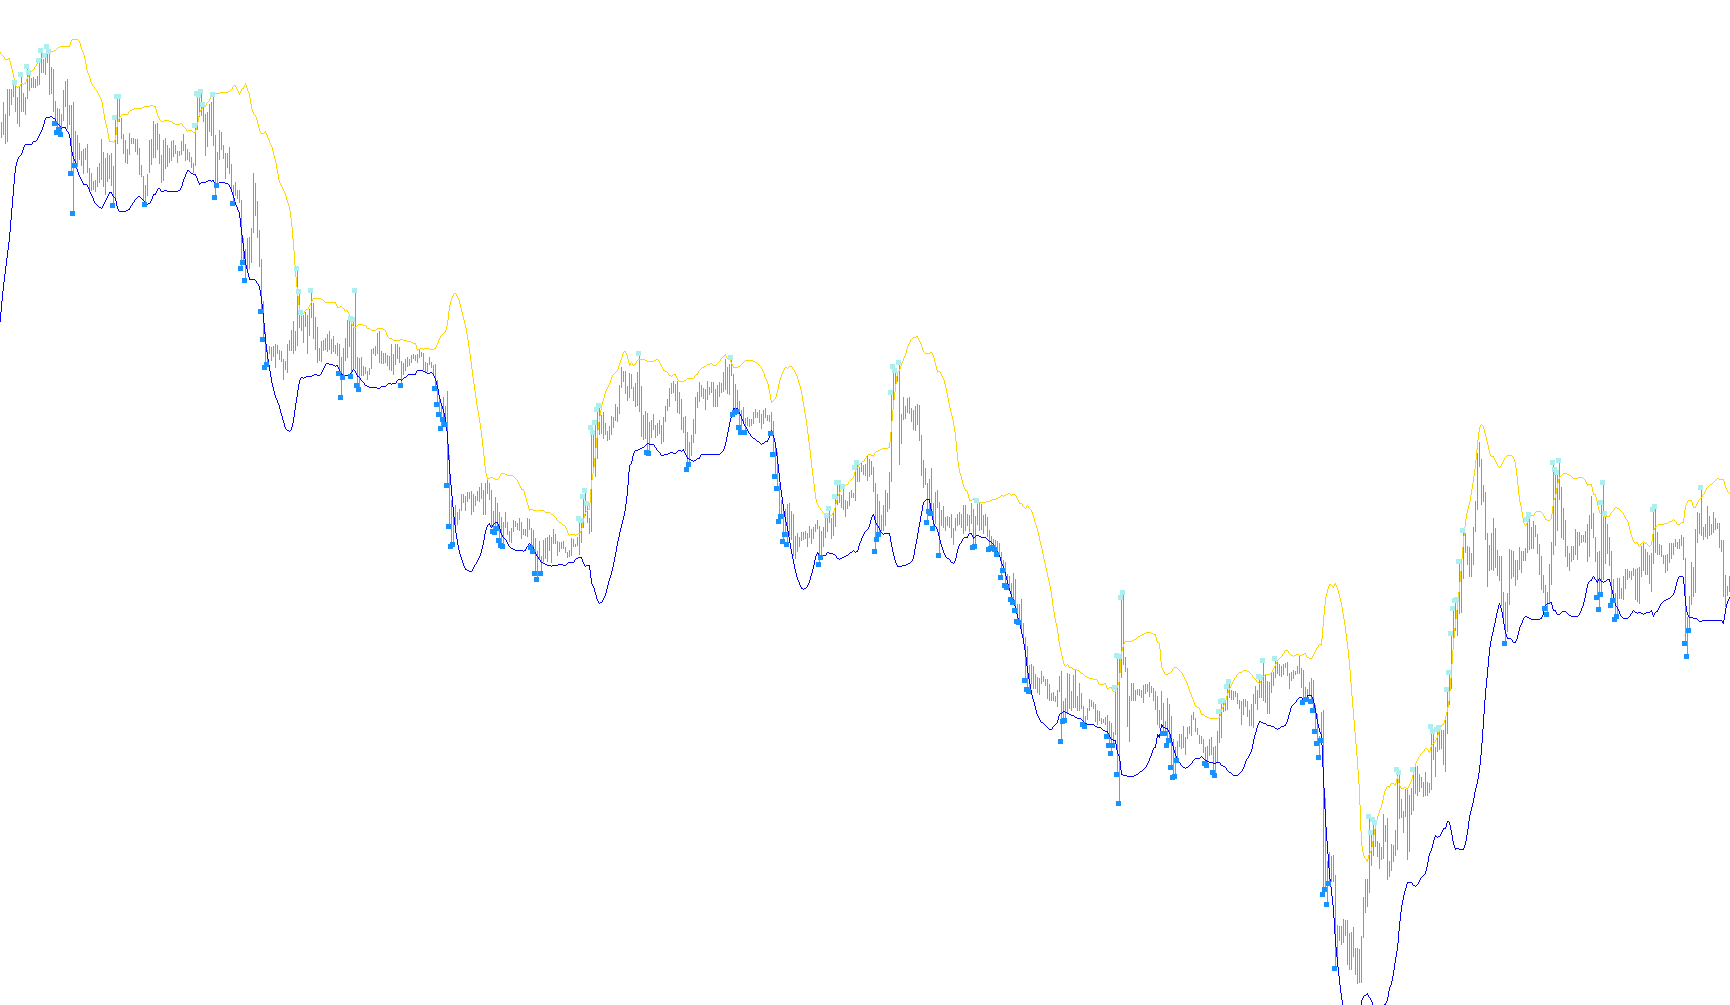
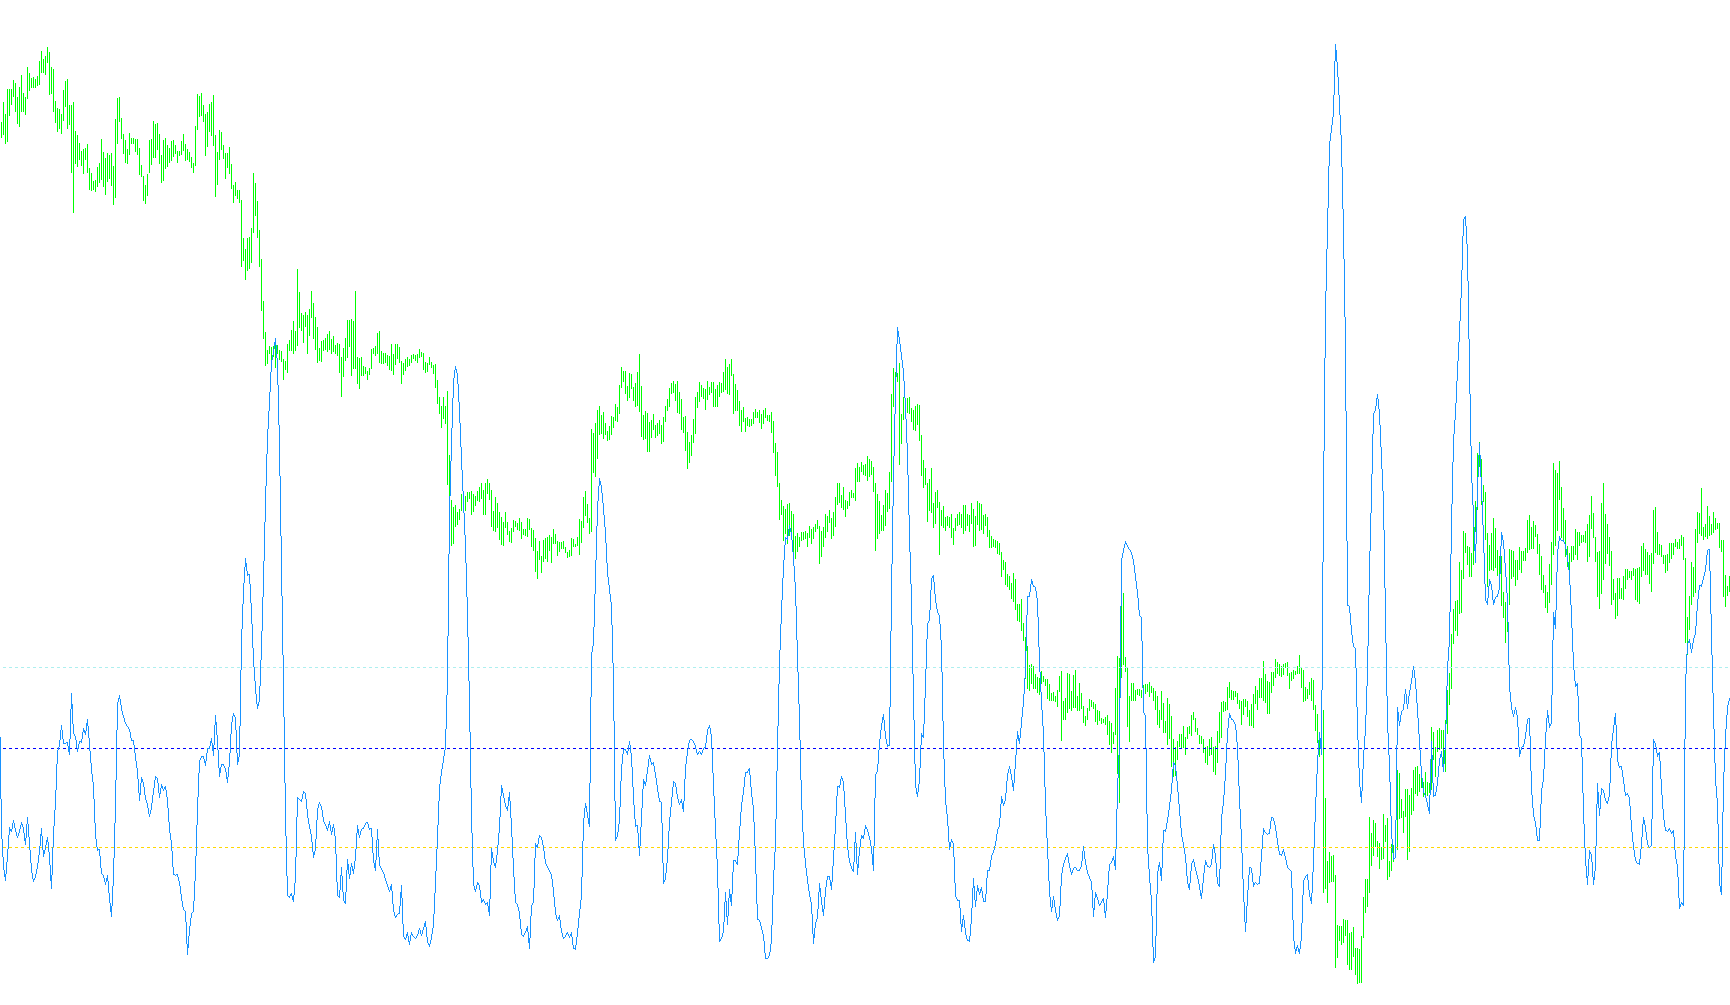
This indicator calculates and visualizes the arithmetic spread between multiple Simple Moving Average periods across higher timeframes to identify momentum shifts.

Better_H1_diff_1
Indicator

Better_H1_diff_1

iMA

This indicator calculates and visualizes the price velocity by determining the differential spreads between multiple Simple Moving Averages across varying timeframe offsets.

Better_H1_diff_2
Indicator

Better_H1_diff_2

iMA

This indicator calculates and visualizes the relative distance between three different Simple Moving Average periods across hourly timeframes to identify momentum shifts.

Better_H4
Indicator

Better_H4

iMA

This indicator synchronizes and visualizes three distinct Simple Moving Average values derived from the H4 timeframe across different chart intervals.

Better_H4_1
Indicator

Better_H4_1

iMA

This indicator synchronizes and displays Simple Moving Average values from 5-minute, 1-hour, and 4-hour timeframes onto the current chart to identify high-level trend alignment.

Better_H4_2
Indicator

Better_H4_2

iMA

This indicator synchronizes and plots high-timeframe 5, 10, and 15-period Simple Moving Averages onto a lower timeframe chart to visualize long-term trend dynamics.

Better_H4_diff
Indicator

Better_H4_diff

iMA

This indicator calculates the price differential between three distinct Simple Moving Average lengths across high-timeframe periods to reveal underlying trend momentum.

Better_H4_diff_1
Indicator

Better_H4_diff_1

iMA

This indicator calculates and visualizes the variance between multiple Simple Moving Averages across different timeframes to identify momentum shifts.

Better_H4_diff_2
Indicator

Better_H4_diff_2

iMA

This indicator calculates the numerical variance between multiple Simple Moving Averages on the H4 timeframe to identify structural price momentum shifts.

Better_M5
Indicator

Better_M5

iMA

This indicator maps and aligns Simple Moving Averages across 5-minute, 1-hour, and 4-hour timeframes onto a single display to identify multi-layered trend alignment.

Better_M5_1
Indicator

Better_M5_1

iMA

This indicator synchronizes and maps simple moving averages across disparate timeframes (M5, H1, and H4) onto a single visual buffer to identify structural trend alignment.
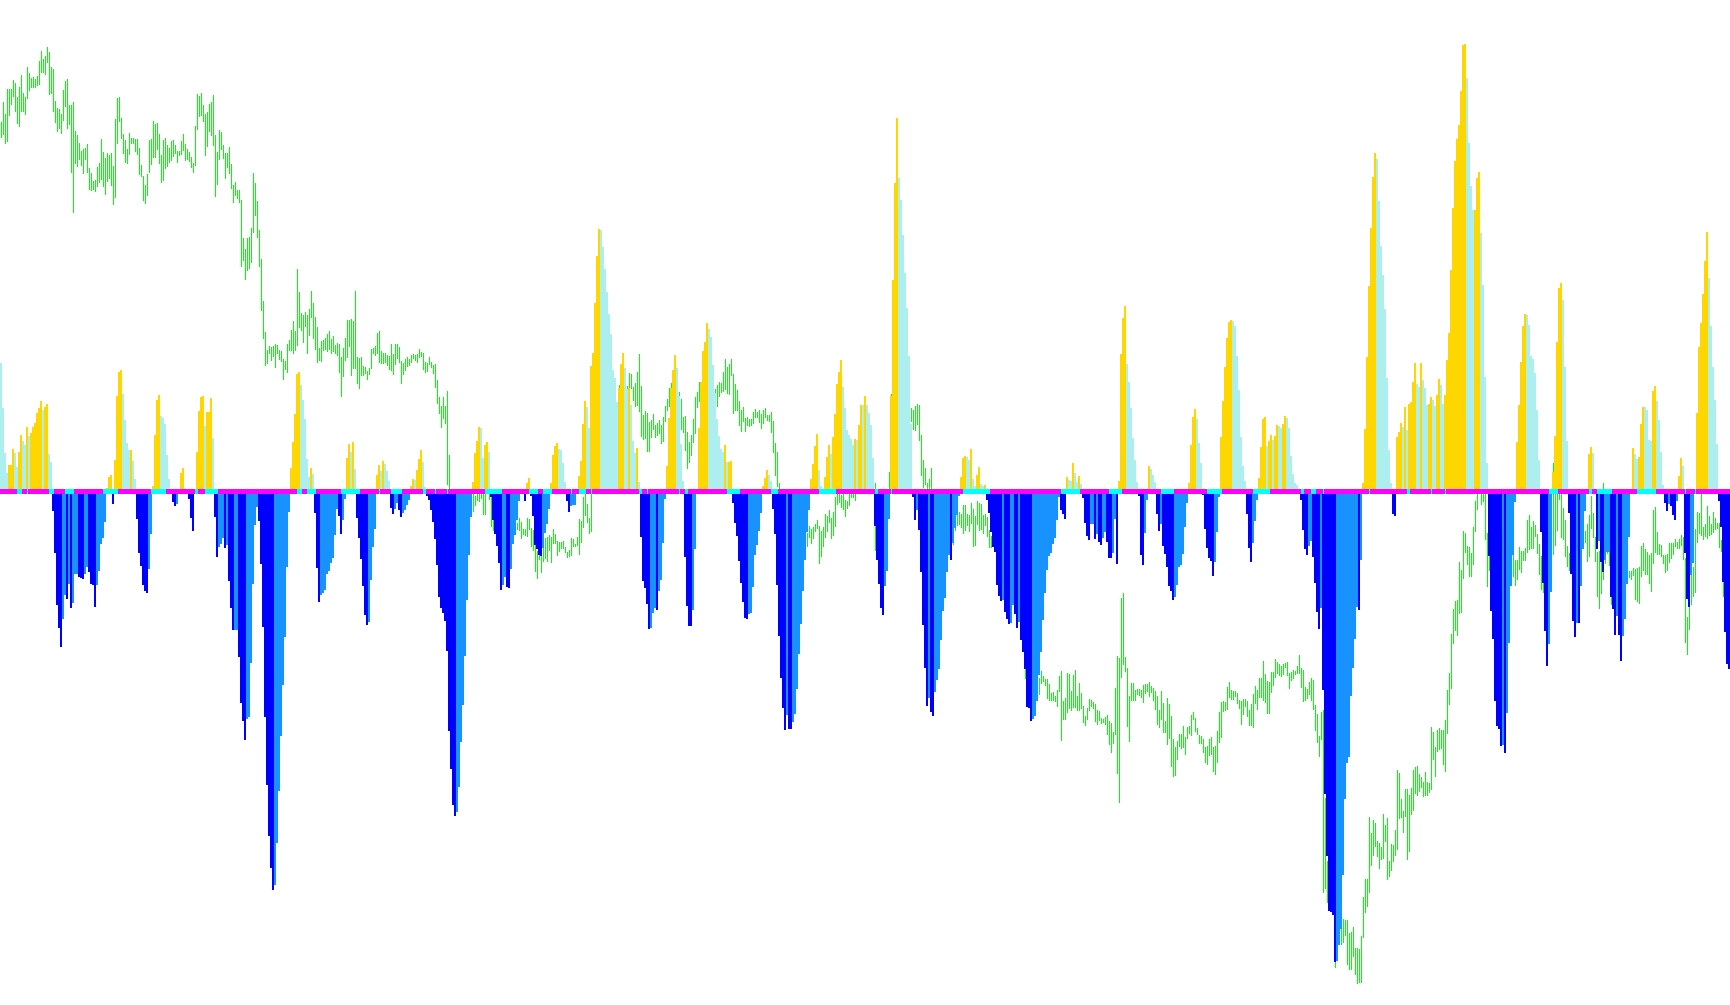
Better_M5_2
Indicator

Better_M5_2

iMA

This indicator synchronizes and plots Simple Moving Averages from M5, H1, and H4 timeframes onto a single visual buffer to identify price trends across concurrent intervals.
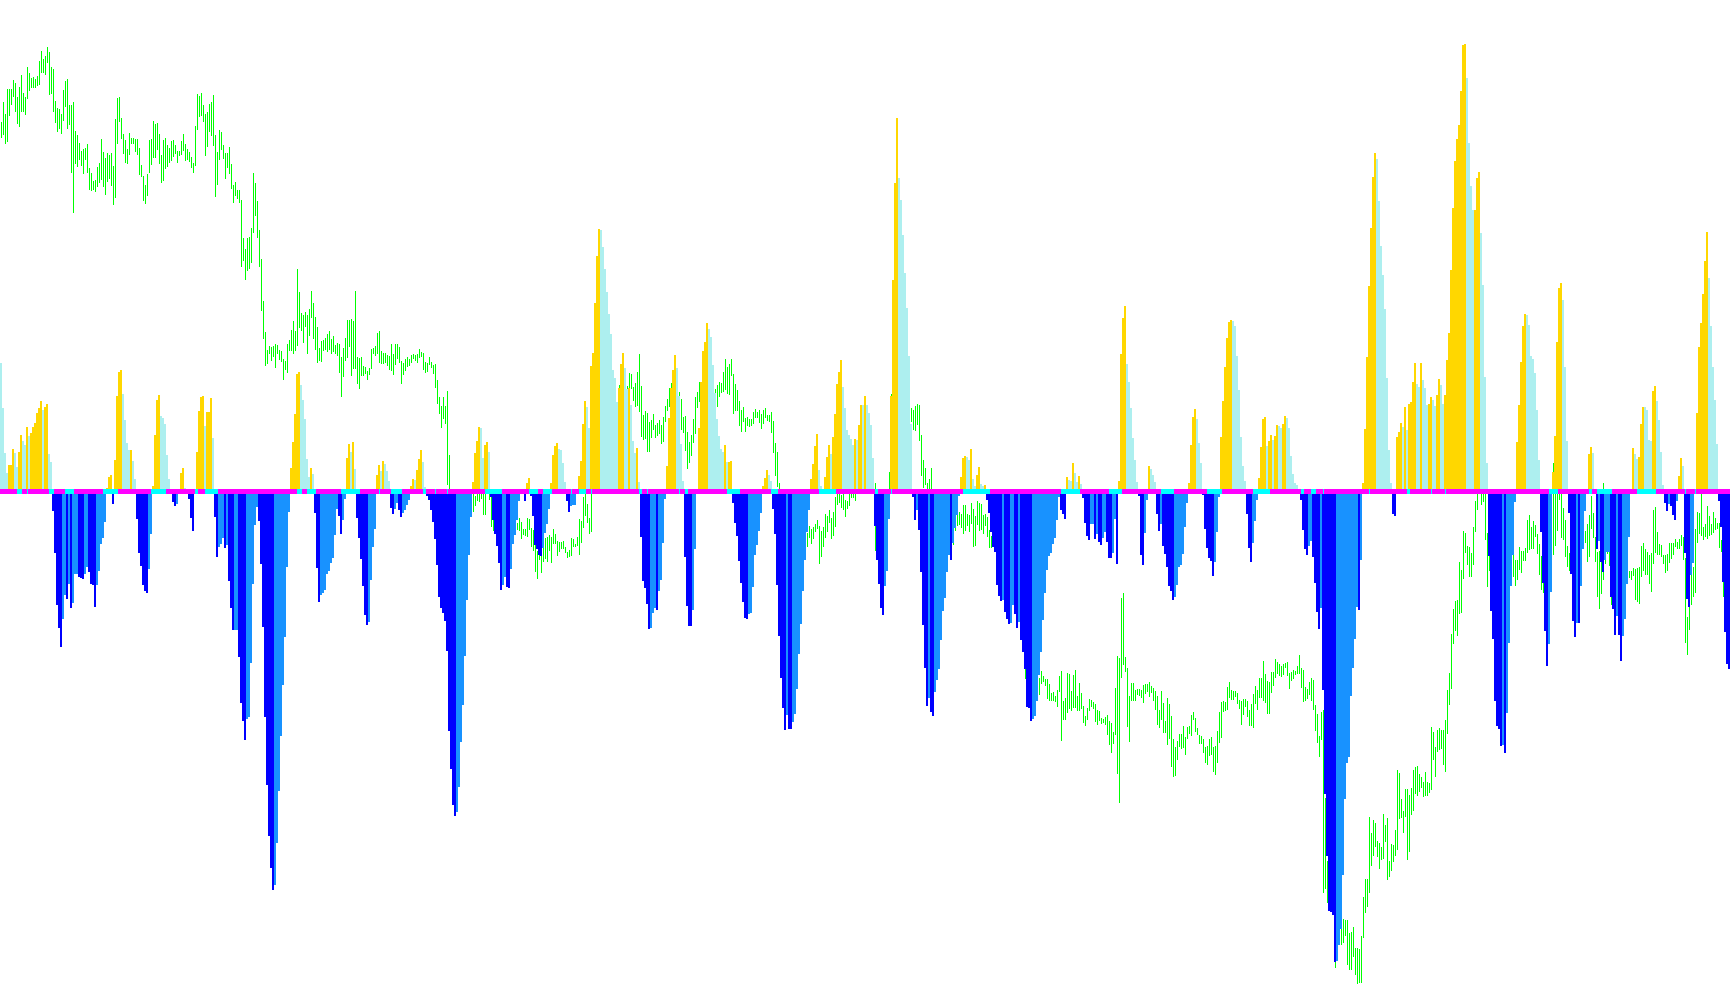
Better_M5_diff
Indicator

Better_M5_diff

iMA

This indicator calculates the differential spread between multiple Simple Moving Average periods (5, 10, and 15) to identify momentum velocity and price curvature.

Better_M5_diff_001
Indicator

Better_M5_diff_001

iMA

This indicator calculates the relative price dispersion between three Simple Moving Averages of varying lengths (5, 10, and 15) across different timeframes to visualize momentum variance.

Better_MA_H1
Indicator

Better_MA_H1

iMA

This indicator aligns and plots Simple Moving Averages from three different instruments onto a synchronized timeline based on specific historical bar counts.

Better_MA_H4
Indicator

Better_MA_H4

iMA

This indicator aligns and plots Simple Moving Averages from multiple assets onto a single timeline by synchronizing their specific historical bar offsets based on exact time coordinates.

Better_MA_M5
Indicator

Better_MA_M5

iMA

This indicator synchronizes and plots Simple Moving Averages of varying lengths across three distinct symbols onto a single temporal timeline.

Bezier_orig
Indicator

Bezier_orig

iMA

This indicator applies a probabilistic distribution weight to historical price points to generate a fluid, non-linear trend curve.

bias
Indicator

bias

iMA

This indicator quantifies the percentage variance between current market closing prices and the exponential moving average to determine directional momentum.

bias_LineHisto
Indicator

bias_LineHisto

iMA

This indicator quantifies market momentum by calculating the percentage variance between current closing prices and a dynamic exponential moving average.

Indicator

Bid_View1.6

iMA
Indicator

Bid_View2.0

iMA
Indicator

Bid_View2.0M

iMA
Big trend
Indicator

Big trend

iMAiMAOnArray

This indicator calculates a smoothed Hull Moving Average to identify momentum shifts and visualize distinct bullish and bearish trend segments on the chart.

Big trend_001
Indicator

Big trend_001

iMAiMAOnArray

This indicator identifies price momentum by calculating the square root weighted variance of double-weighted weighted moving averages to pinpoint directional shifts.

BinaryWave
Indicator

BinaryWave

iCCIiMACDiOsMAiMA
BO
Indicator

BO

iMA

This indicator calculates the relative position of a custom NavelSMA value between two different simple moving average envelopes to determine momentum shifts.

BOBB_V1
Indicator

BOBB_V1

iMA

This indicator quantifies price action extremes by calculating the standard deviation of historical returns relative to a simple moving average to project upper and lower boundary offsets.

BOBB_V2
Indicator

BOBB_V2

iMA

This indicator quantifies price variance by calculating the distance from a Simple Moving Average relative to its standard deviation, smoothed through a secondary moving average overlay.

BoDi
Indicator

BoDi

iMA

This indicator calculates the standard deviation of price movements relative to a moving average to visualize dynamic volatility range and momentum shifts.

bollinger band ema
Indicator

bollinger band ema

iMA

This indicator calculates dynamic price boundaries by projecting standard deviation offsets from an Exponential Moving Average to identify market extremes.

Bollinger Bands
Indicator

Bollinger Bands

iMA

This indicator calculates a central simple moving average and plots upper and lower boundaries based on standard deviation to visualize price extremes.

Bollinger Bands_v1
Indicator

Bollinger Bands_v1

iMA

This indicator calculates a central simple moving average and maps upper and lower boundaries based on the standard deviation of price variance.

Bollinger Bands_v2
Indicator

Bollinger Bands_v2

iMA

Calculates a dynamic price corridor by mapping standard deviation offsets against a simple moving average to identify statistical extremes.

Bollinger Bandwidth
Indicator

Bollinger Bandwidth

iBandsiMA
Bollinger MA Price
Indicator

Bollinger MA Price

iMA

This indicator calculates a moving average baseline and maps upper and lower boundaries based on the standard deviation of price variance from a user-selectable price point.

Bollinger Squeeze v3
Indicator

Bollinger Squeeze v3

iATRiMomentumiMAiStdDev

This indicator identifies market compression by calculating a volatility ratio between Standard Deviation and ATR while visualizing momentum shifts through comparative histogram bars.

Bollinger Squeeze v4
Indicator

Bollinger Squeeze v4

iATRiMAiStdDev

This indicator identifies potential volatility breakouts by measuring the ratio between Bollinger Band deviations and ATR-based fluctuations while tracking linear regression momentum shifts.

Bollinger Squeeze v4_001
Indicator

Bollinger Squeeze v4_001

iATRiMAiStdDev

This indicator identifies potential market breakouts by measuring the compression of price action using a ratio of Standard Deviation to Average True Range, overlaid with Linear Regression momentum histograms.

Bollinger Squeeze v4_v1
Indicator

Bollinger Squeeze v4_v1

iATRiMAiStdDev

This indicator identifies market compression and trend direction by calculating the ratio between standard deviation and ATR volatility while plotting a linear regression-based momentum histogram.

Bollinger Squeeze
Indicator

Bollinger Squeeze

iATRiMAiStdDev

This indicator identifies trend shifts by correlating Linear Regression Momentum values with an ATR-based Bollinger Band squeeze ratio to pinpoint volatility breakouts.

Bollinger_SqueezeX
Indicator

Bollinger_SqueezeX

iATRiMAiStdDev

This indicator identifies periods of low market volatility by comparing standard deviation to ATR, while utilizing a custom linear regression formula to map price momentum trends.

BolliToucher_001
Indicator

BolliToucher_001

iMAiStdDev

This indicator identifies potential reversal opportunities by detecting price interaction with upper and lower Bollinger Bands using standard deviation volatility.

BolliToucher_002
Indicator

BolliToucher_002

iMAiStdDev

This indicator identifies 'Gimmee Bar' patterns based on price touching Bollinger Bands and closing in the opposite direction, marking potential entry points and triggering alerts on new bar formations when configured.

BolliTrigger
Indicator

BolliTrigger

iBandsiMA

This indicator generates a signal line by calculating a weighted sum of Bollinger Bandwidth and a modified Percent B value to identify price momentum relative to volatility.

BollStarc-TC
Indicator

BollStarc-TC

iBandsiATRiMA

This indicator synthesizes price momentum by overlaying Keltner Channel envelopes derived from ATR and EMA with standard Bollinger Band volatility boundaries.

BollStarc-TC_Sig
Indicator

BollStarc-TC_Sig

iBandsiATRiMA

This indicator identifies high-probability trend reversals by detecting instances where price action pierces through a hybrid boundary of Bollinger Bands and STARC volatility channels.

BollStarc-TC_v1
Indicator

BollStarc-TC_v1

iBandsiATRiMA

This indicator synthesizes Bollinger Bands with Keltner-style ATR channels to provide a dual-layered visualization of market volatility and price extremes.

BollStarc-TC_v2
Indicator

BollStarc-TC_v2

iBandsiATRiMA

This indicator synchronizes Keltner Channel dynamics with Bollinger Band boundaries to provide a comprehensive visual representation of price expansion and compression.

BO_v1
Indicator

BO_v1

iMA

The algorithm calculates the relative position of a primary smoothed average against two distinct Simple Moving Average envelopes to identify momentum shifts and trend exhaustion.