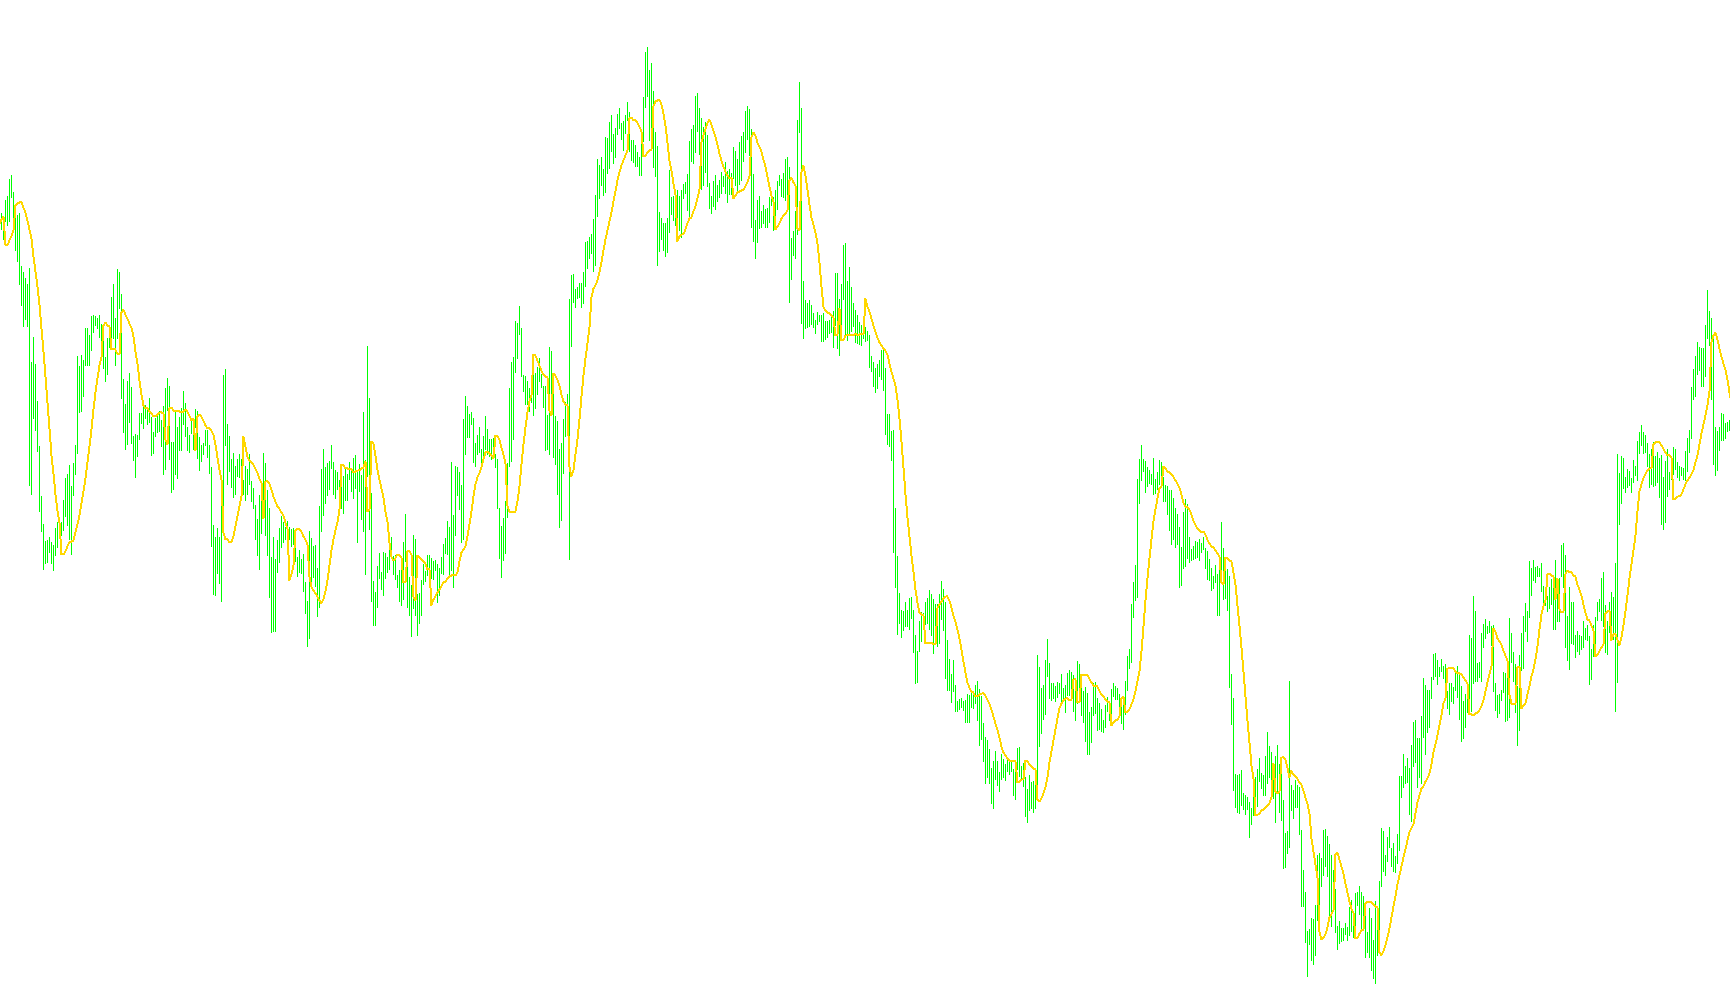
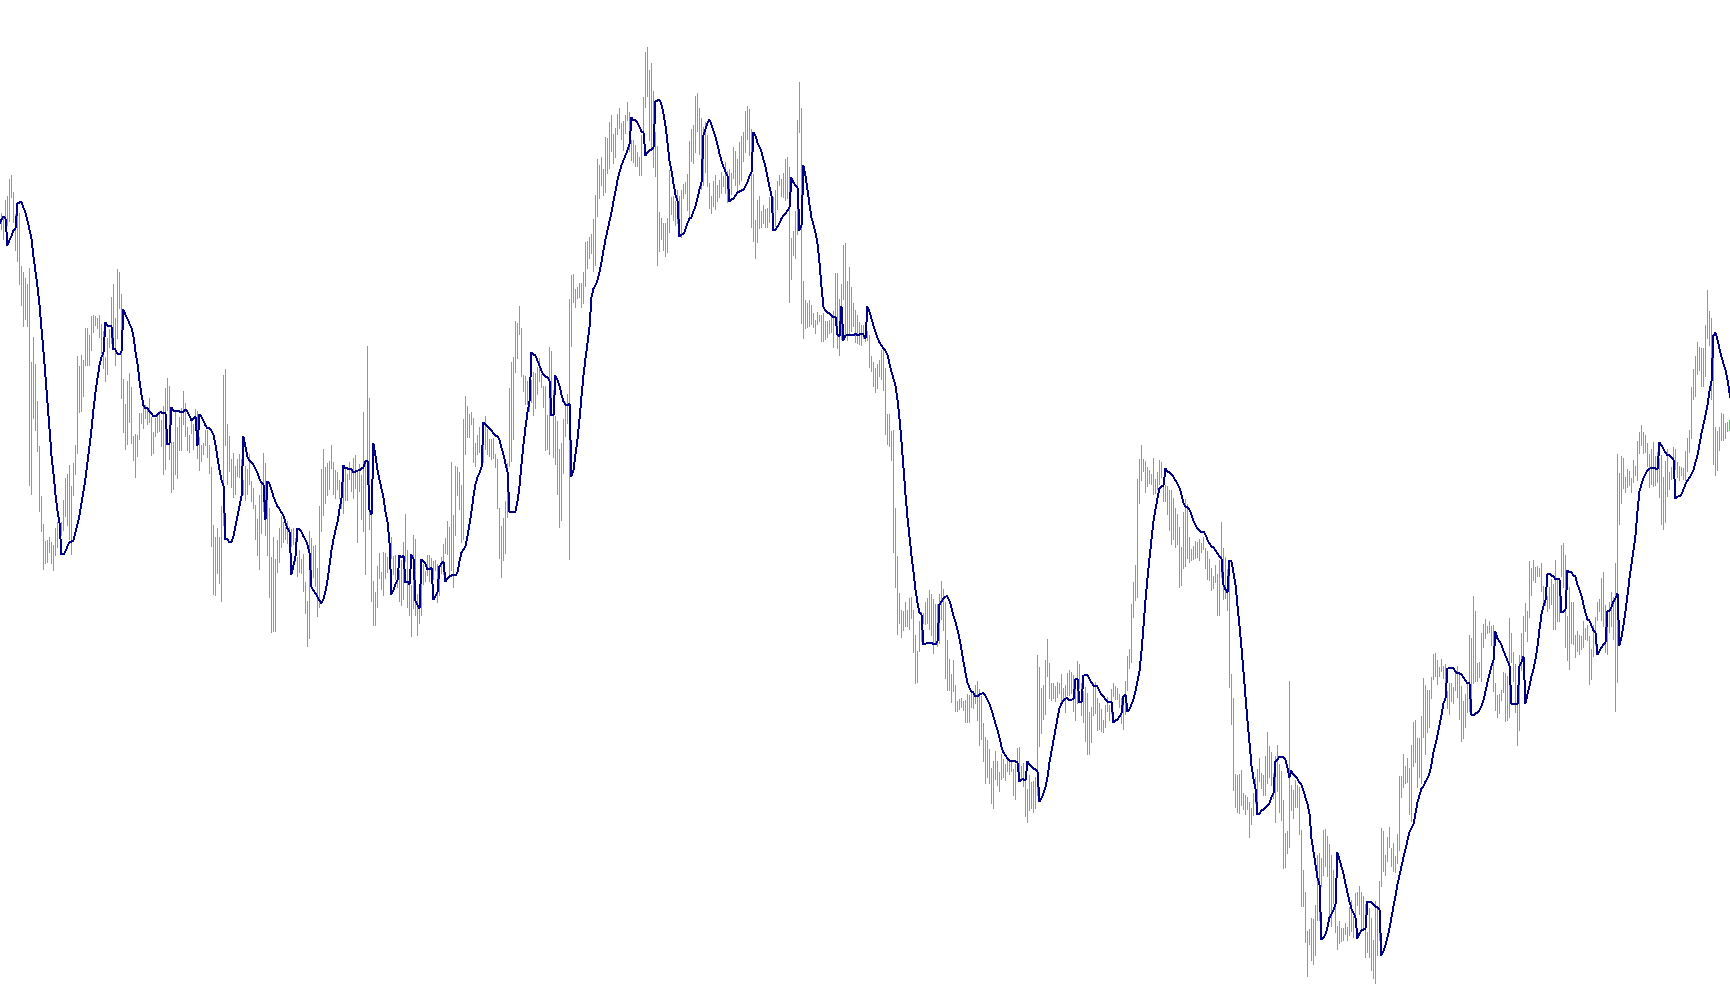
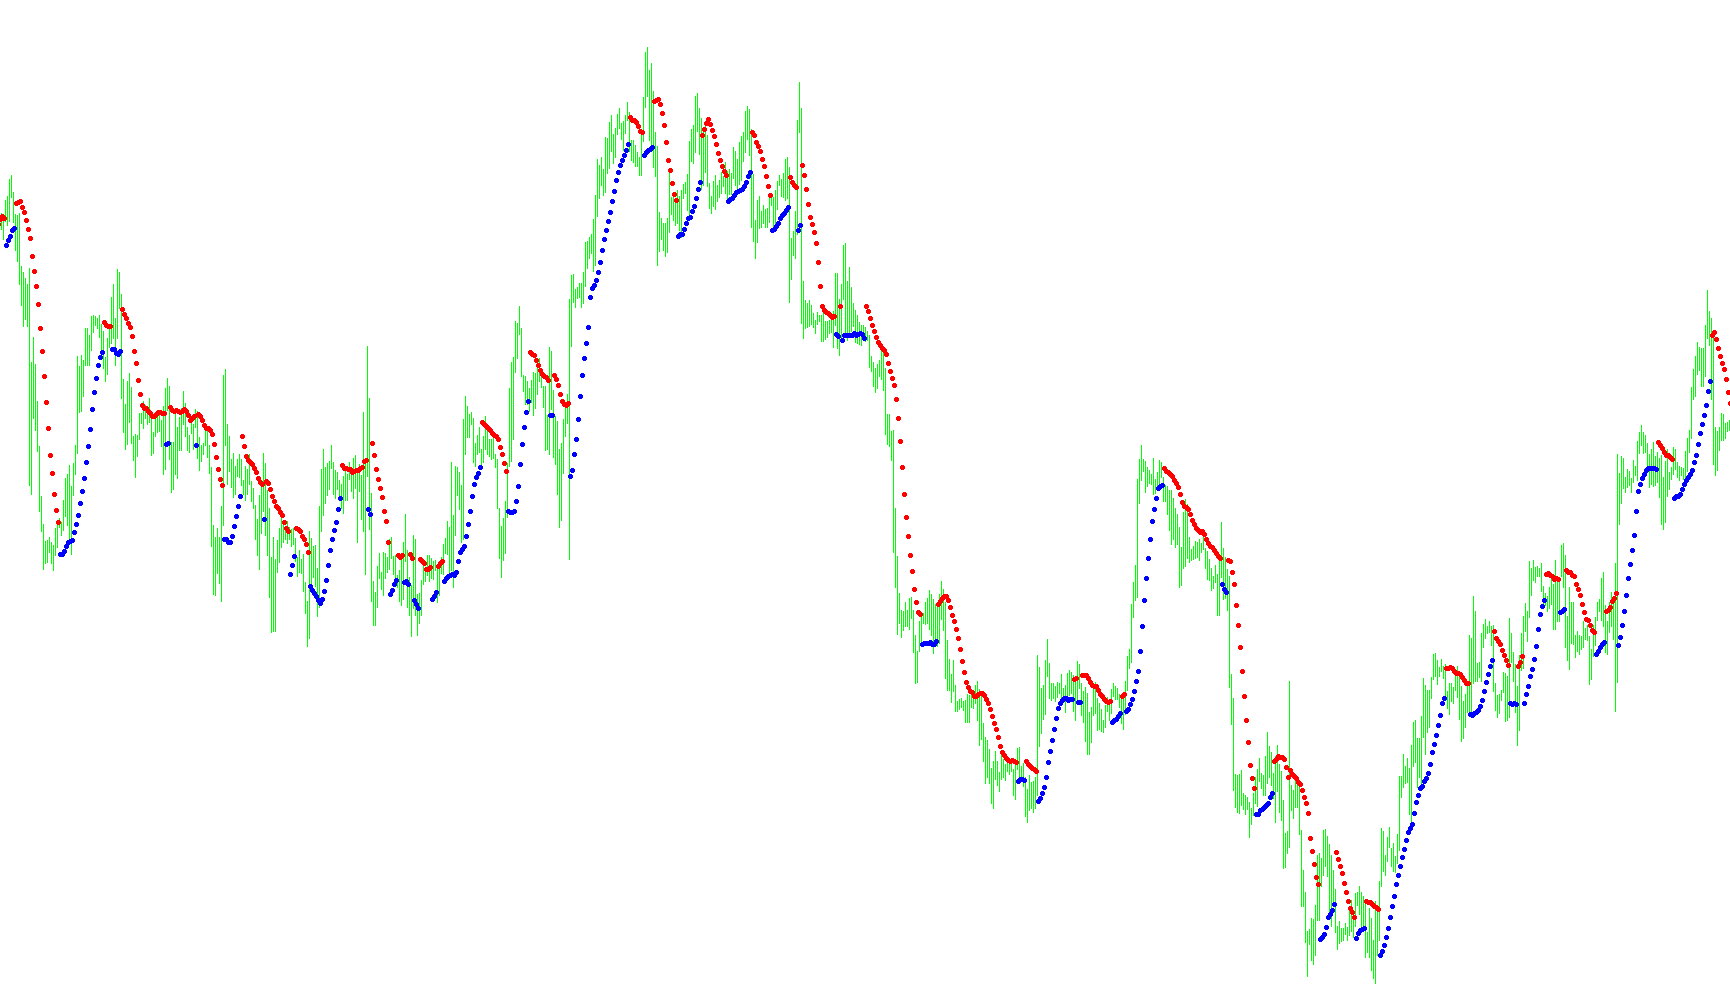
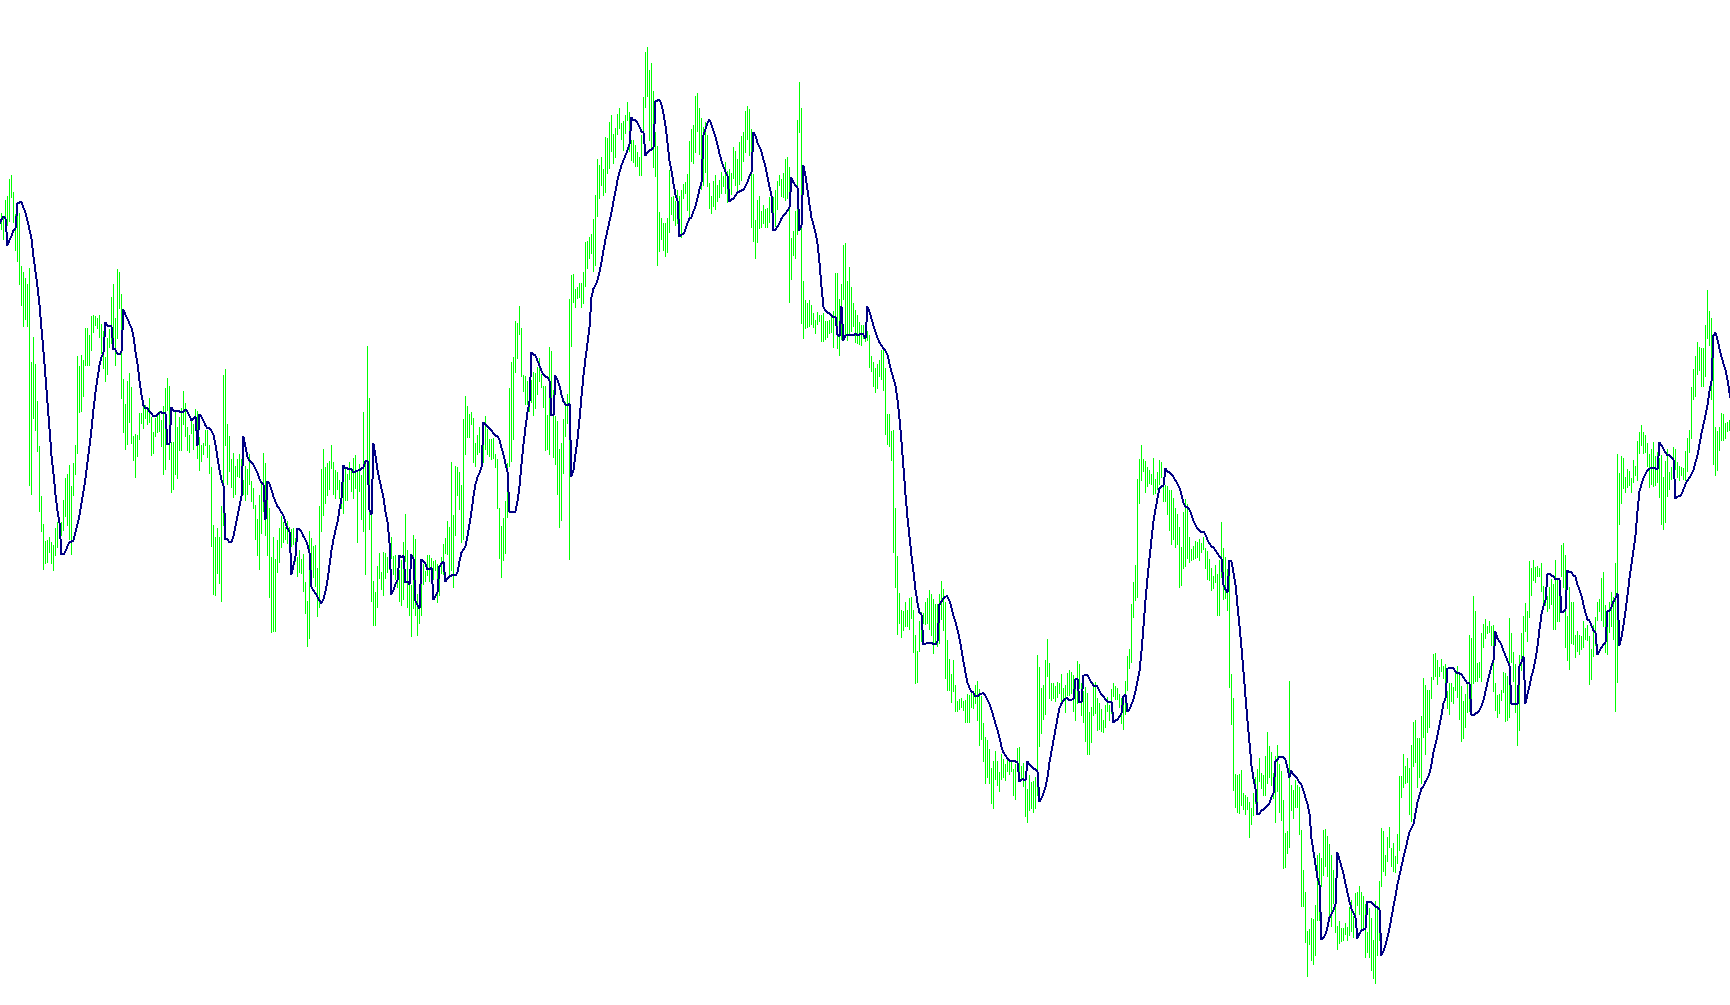
FXFreedomBars_v2
Indicator

FXFreedomBars_v2

iCCIiMA

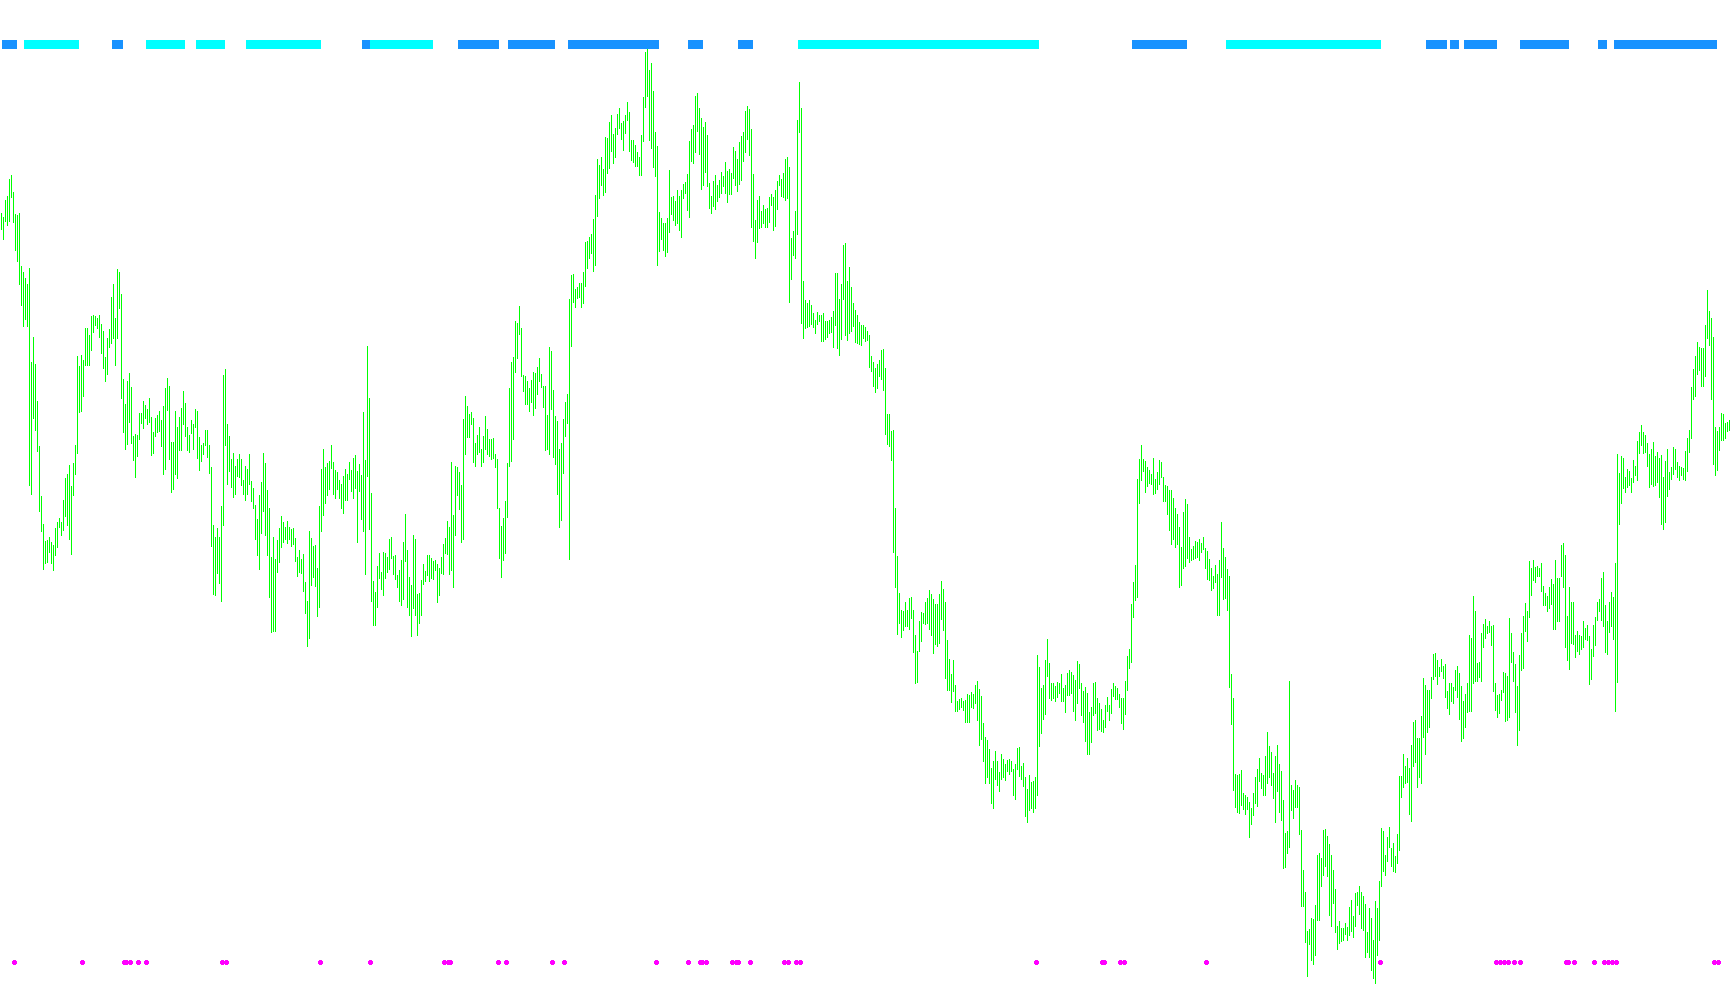
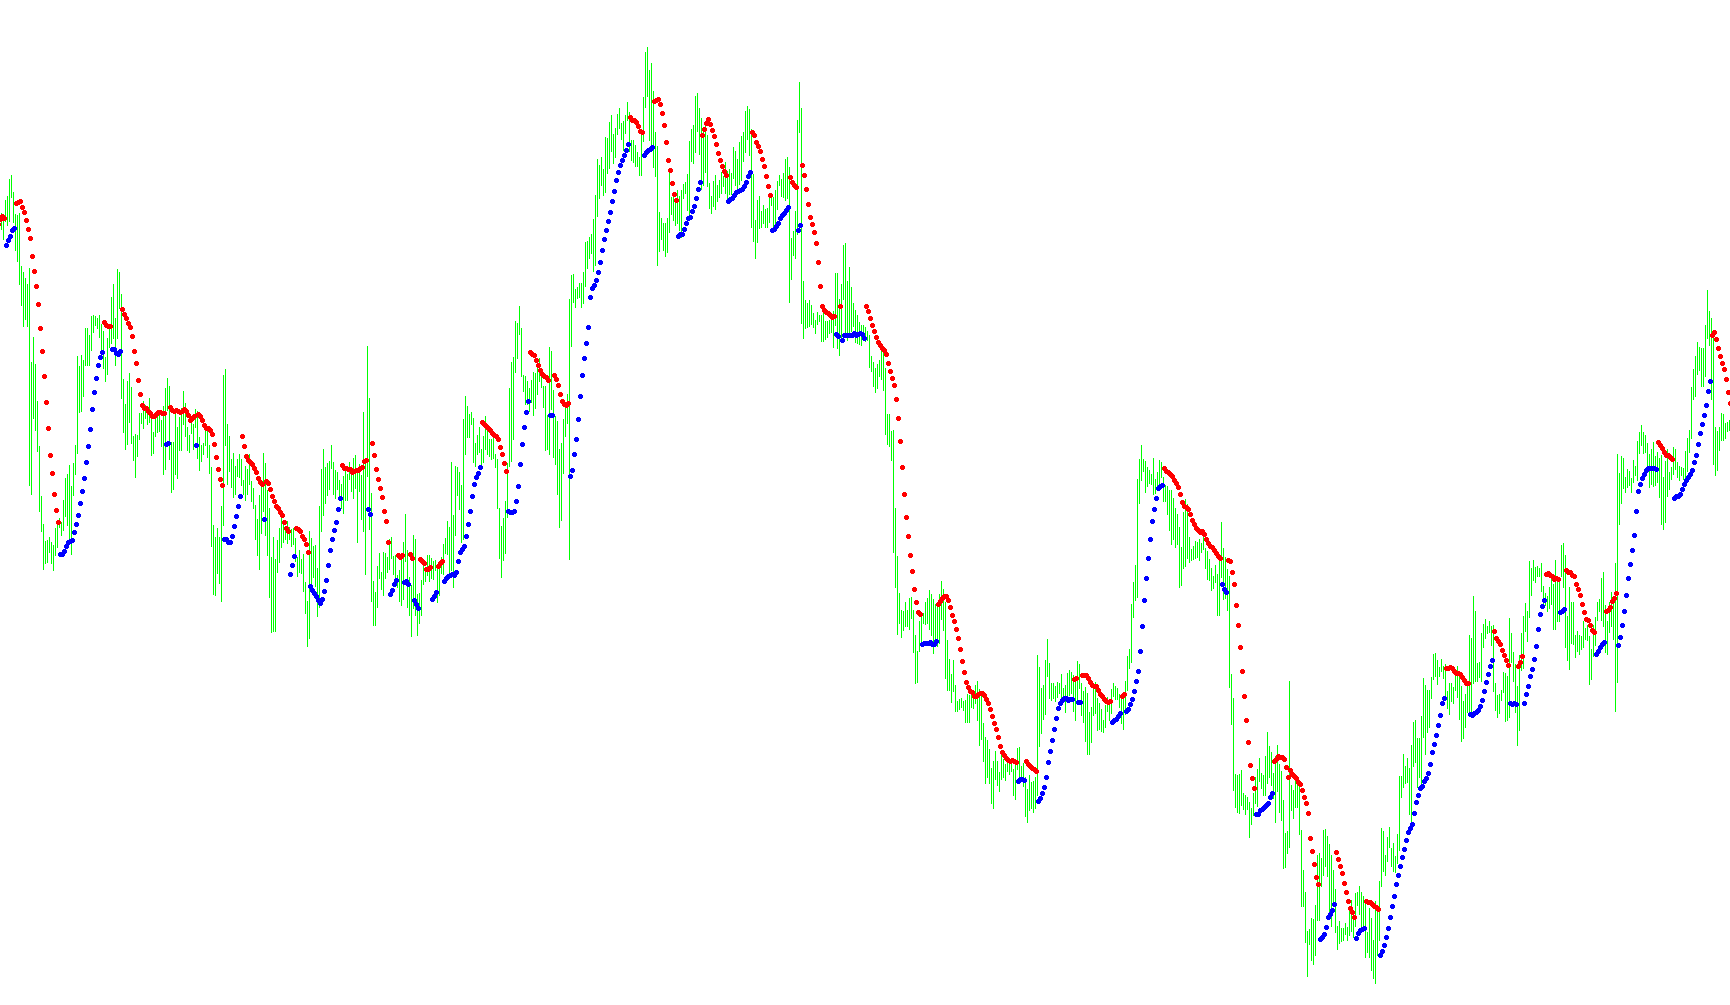
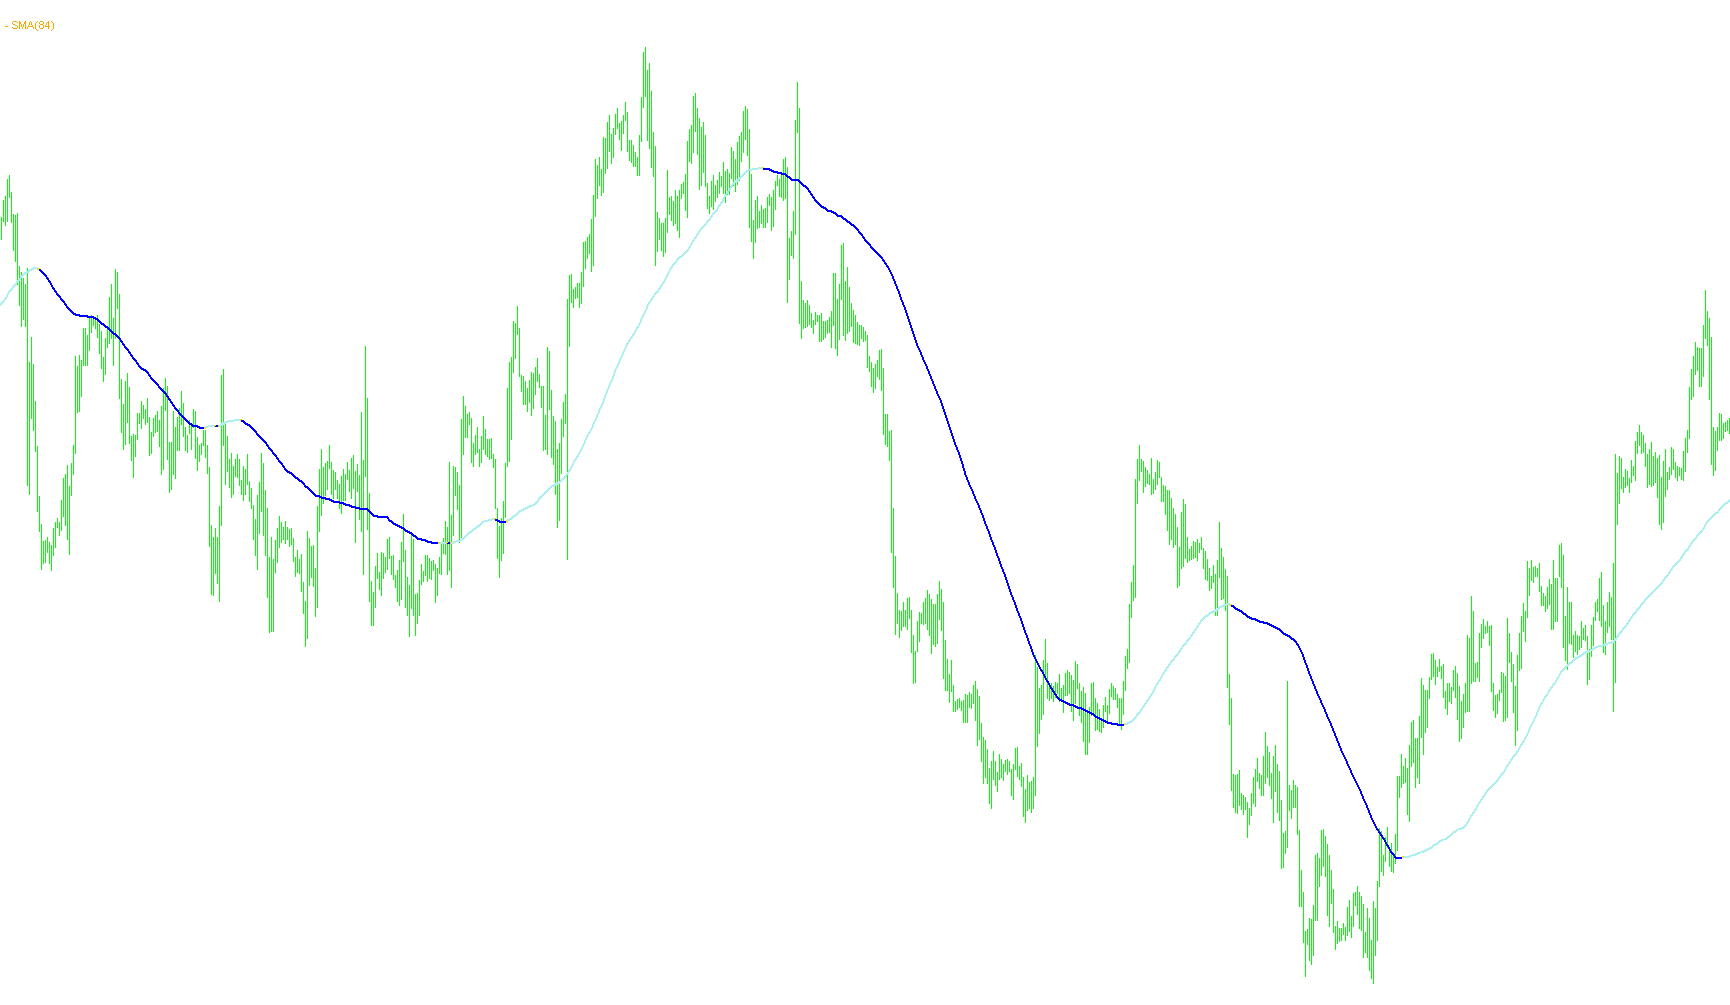
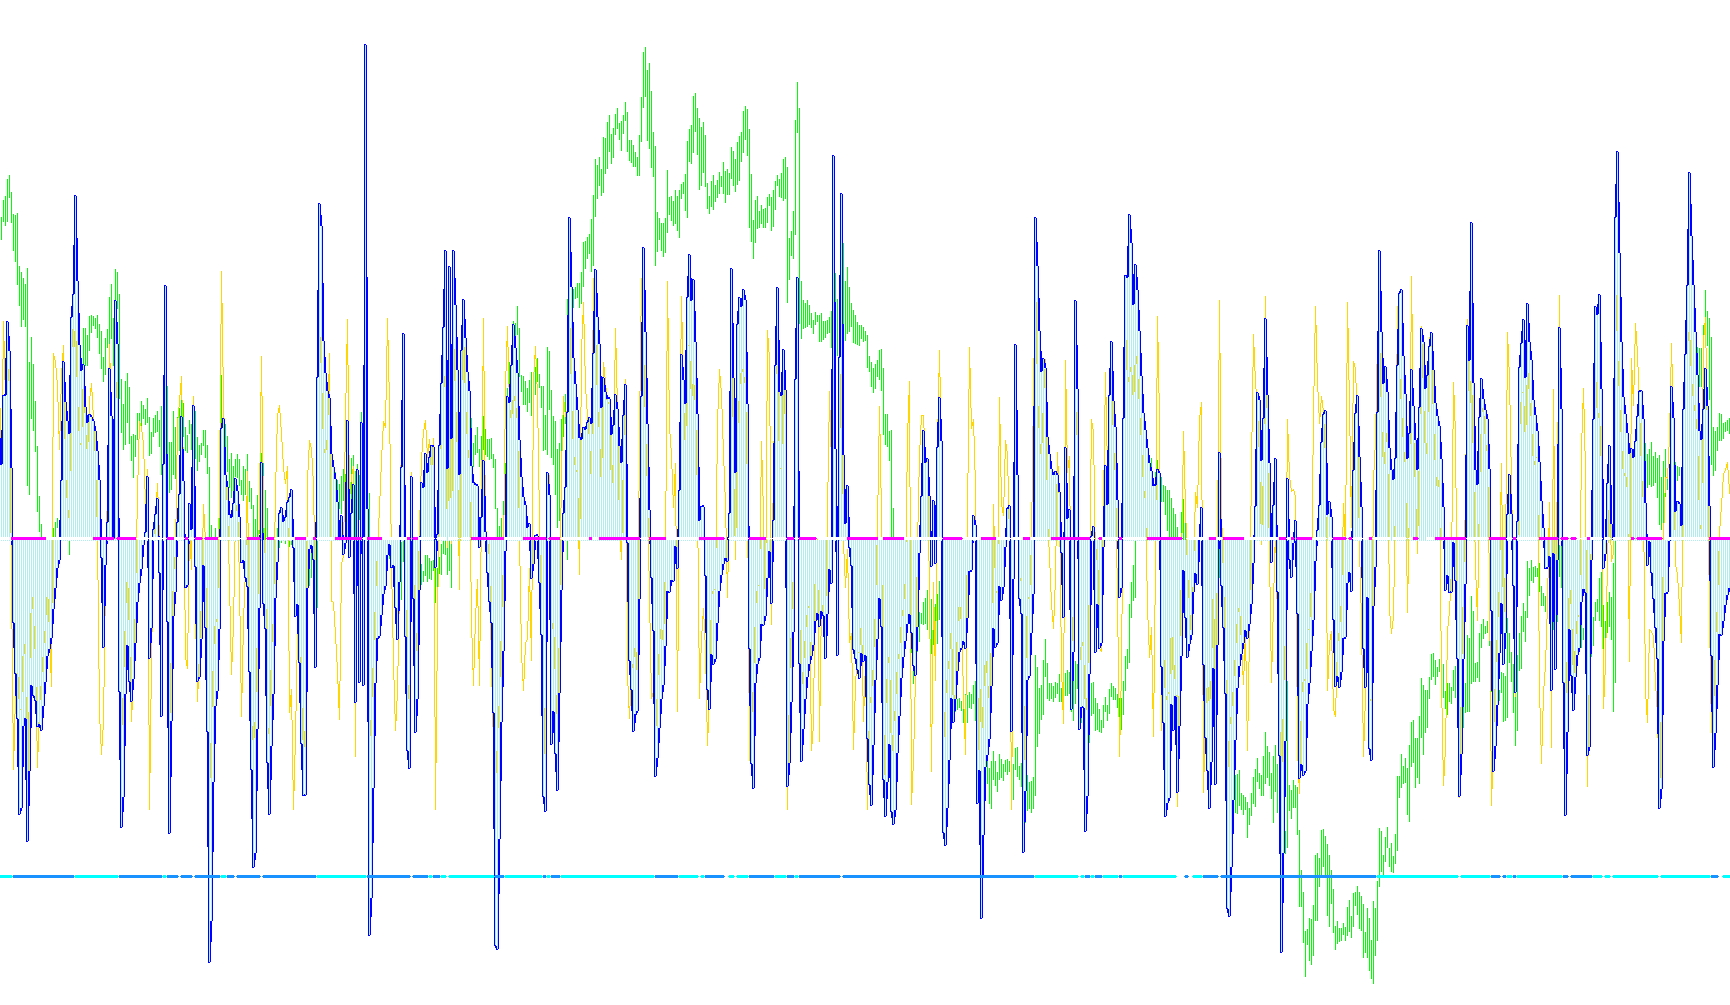
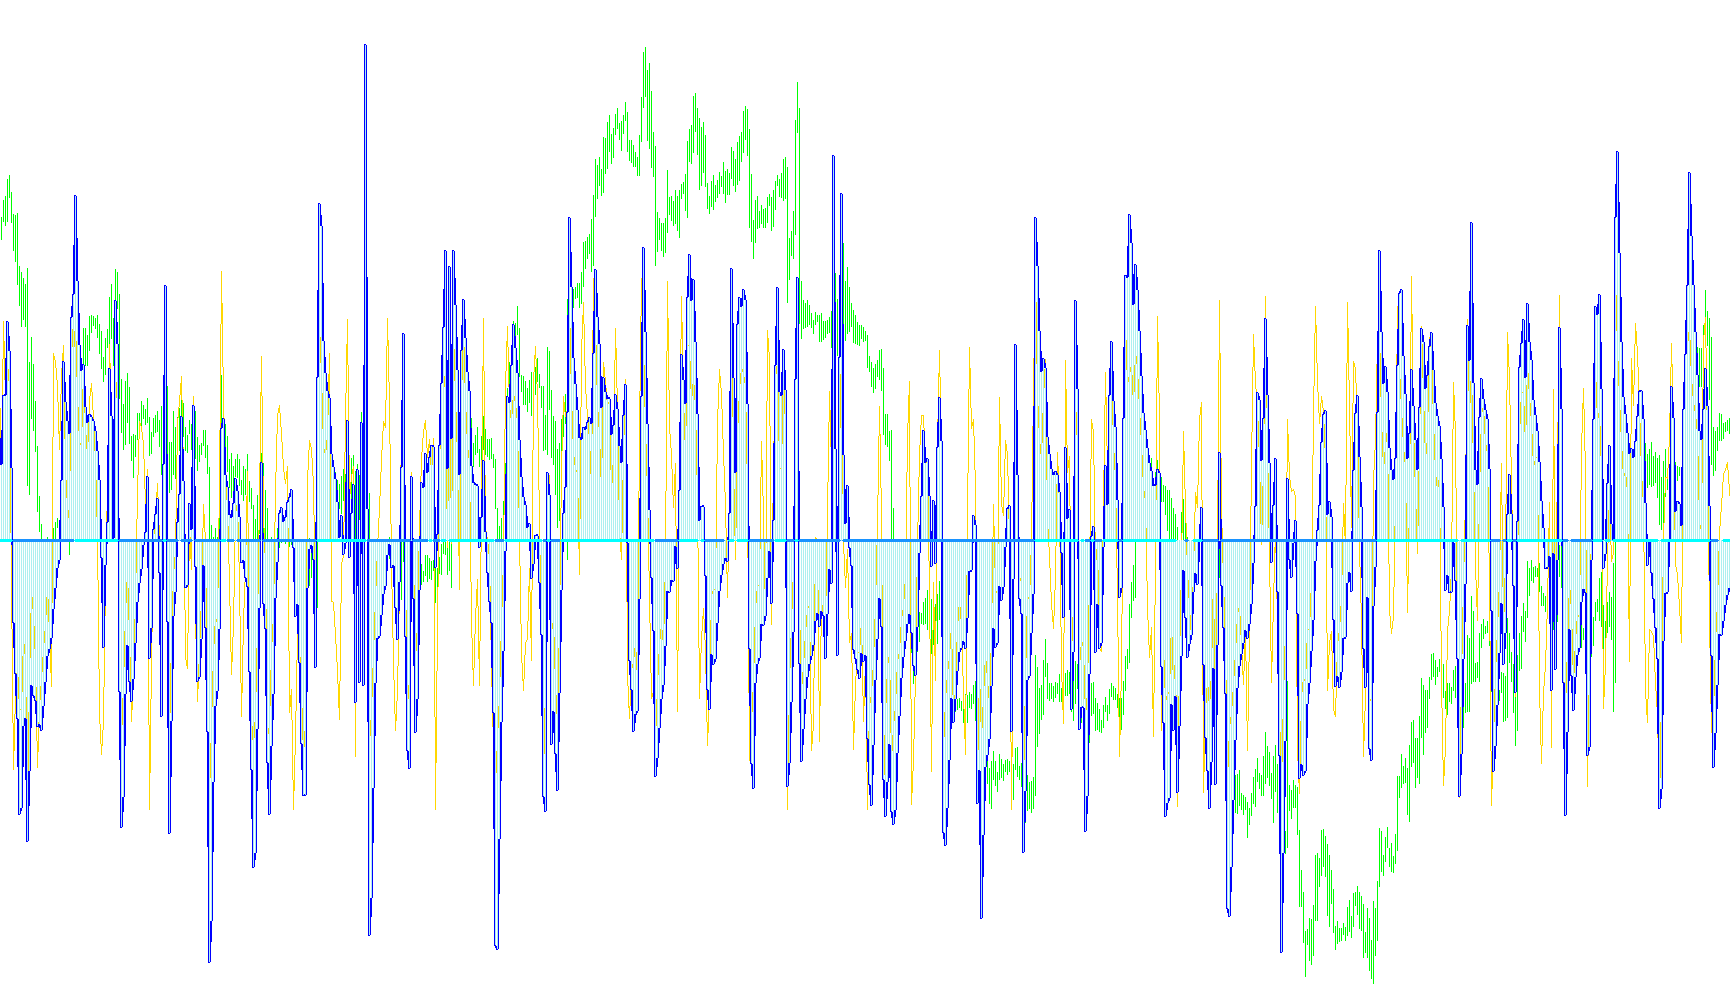
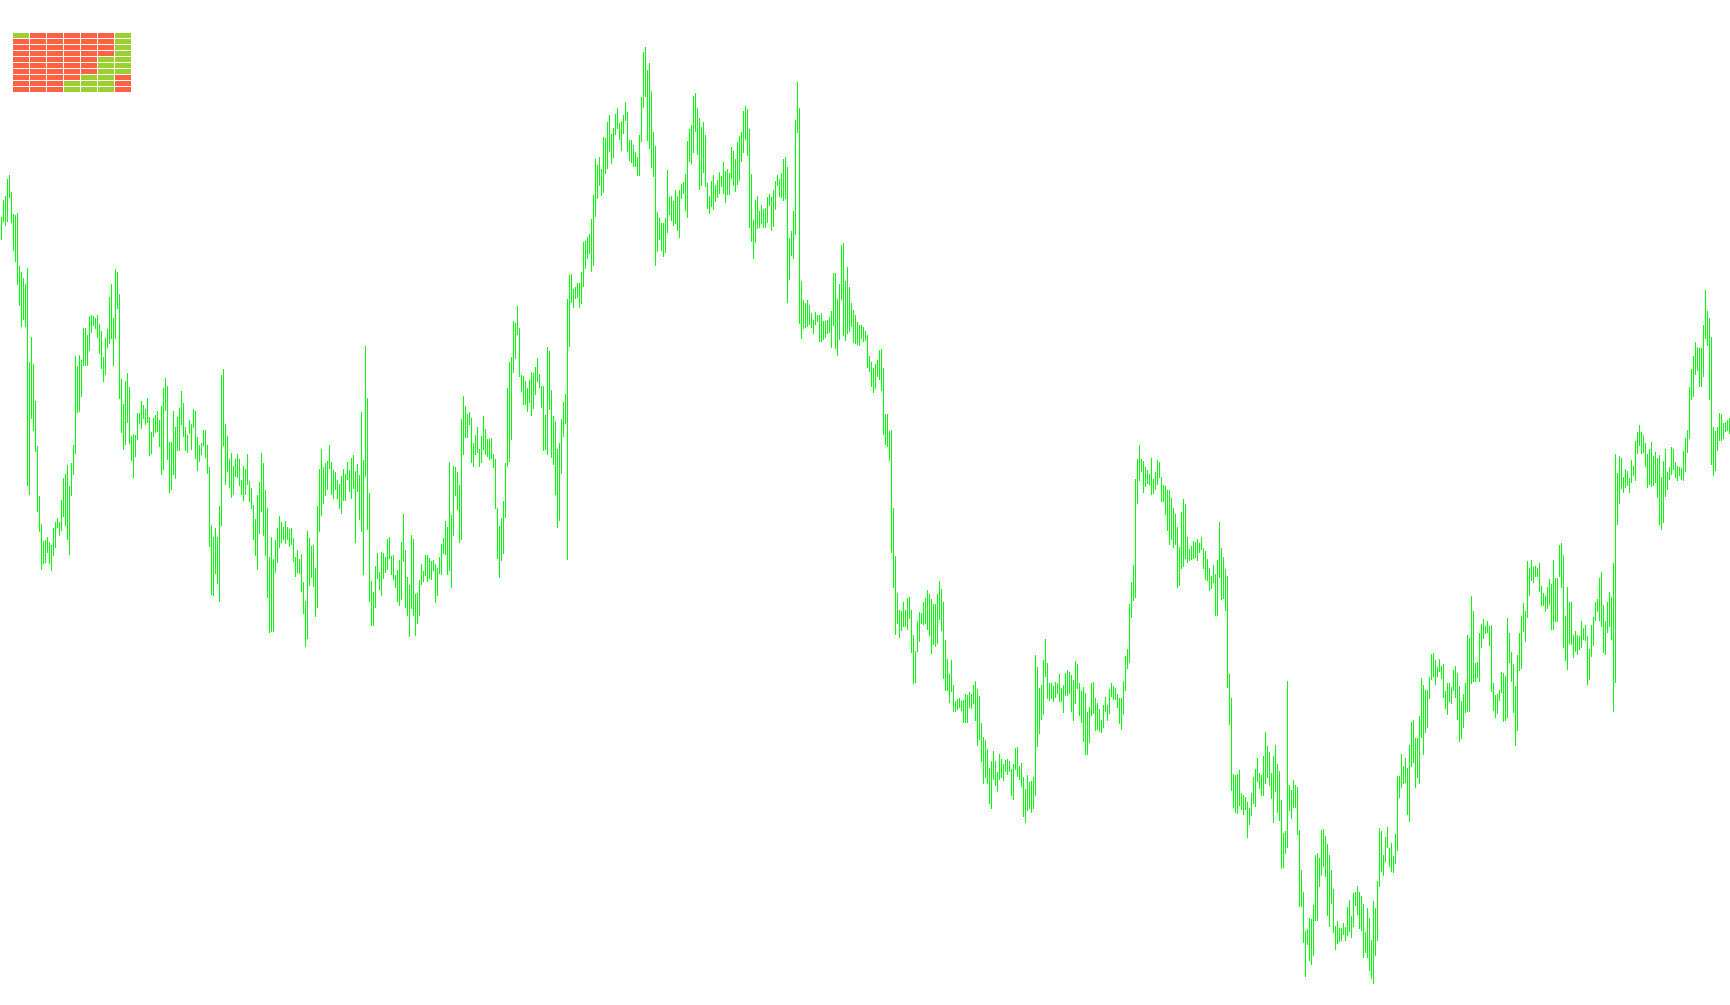
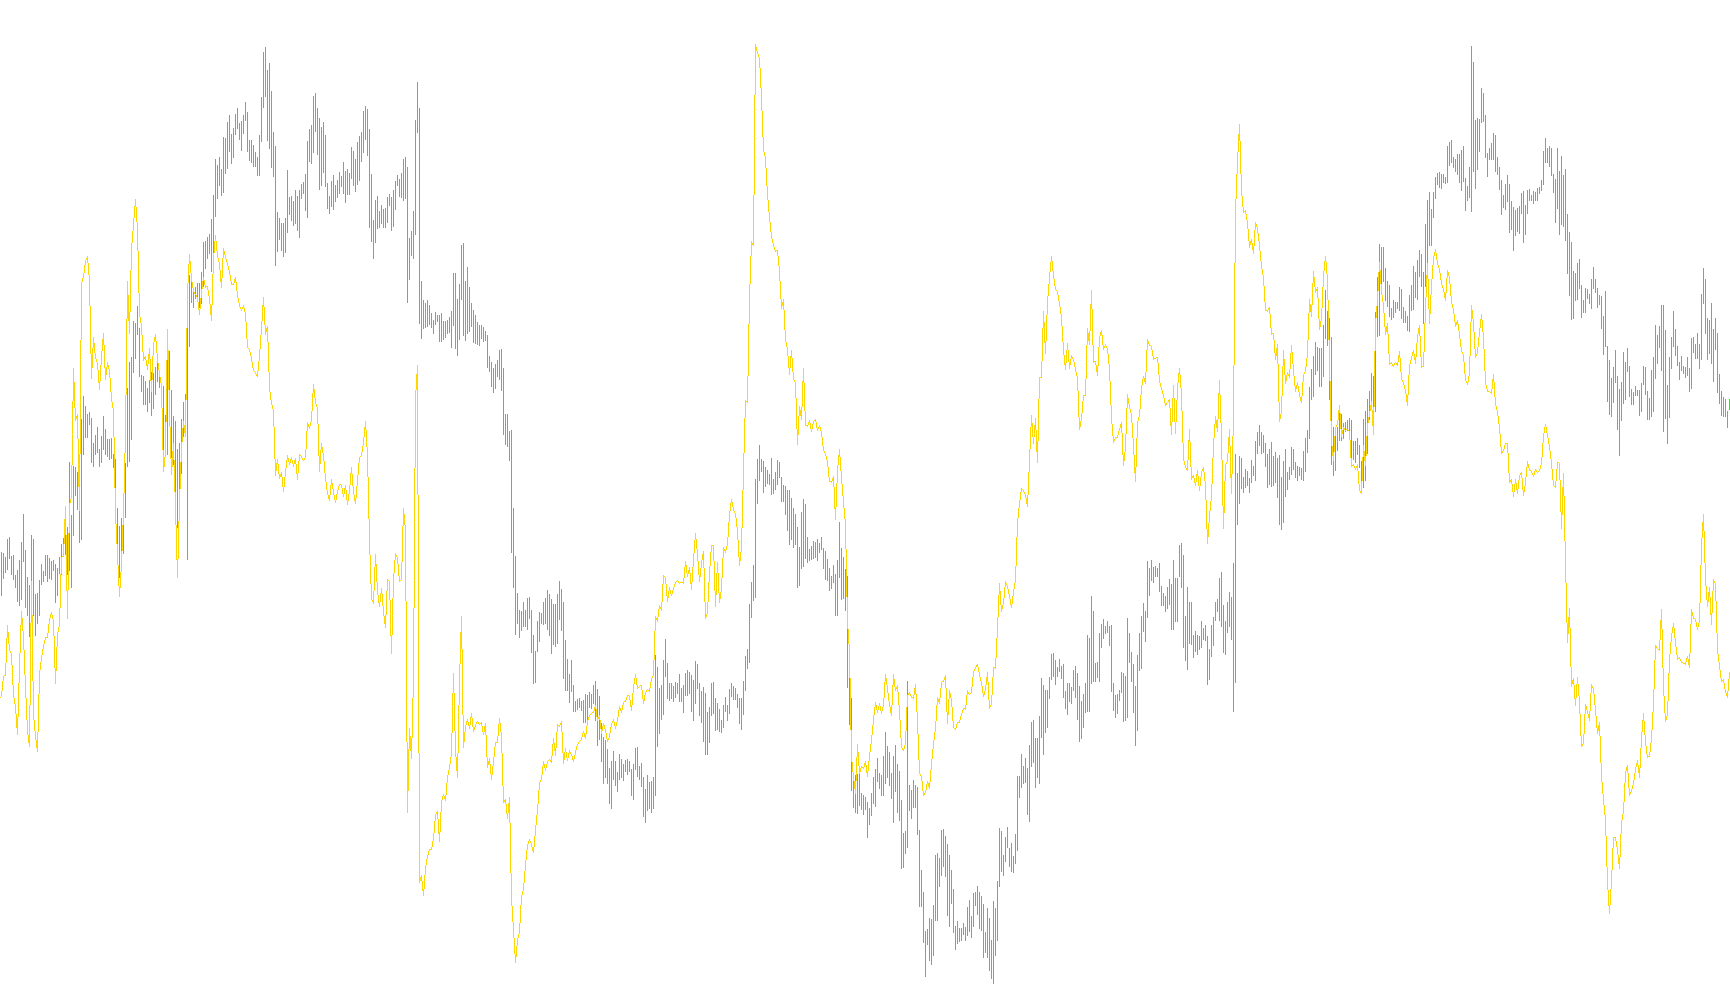
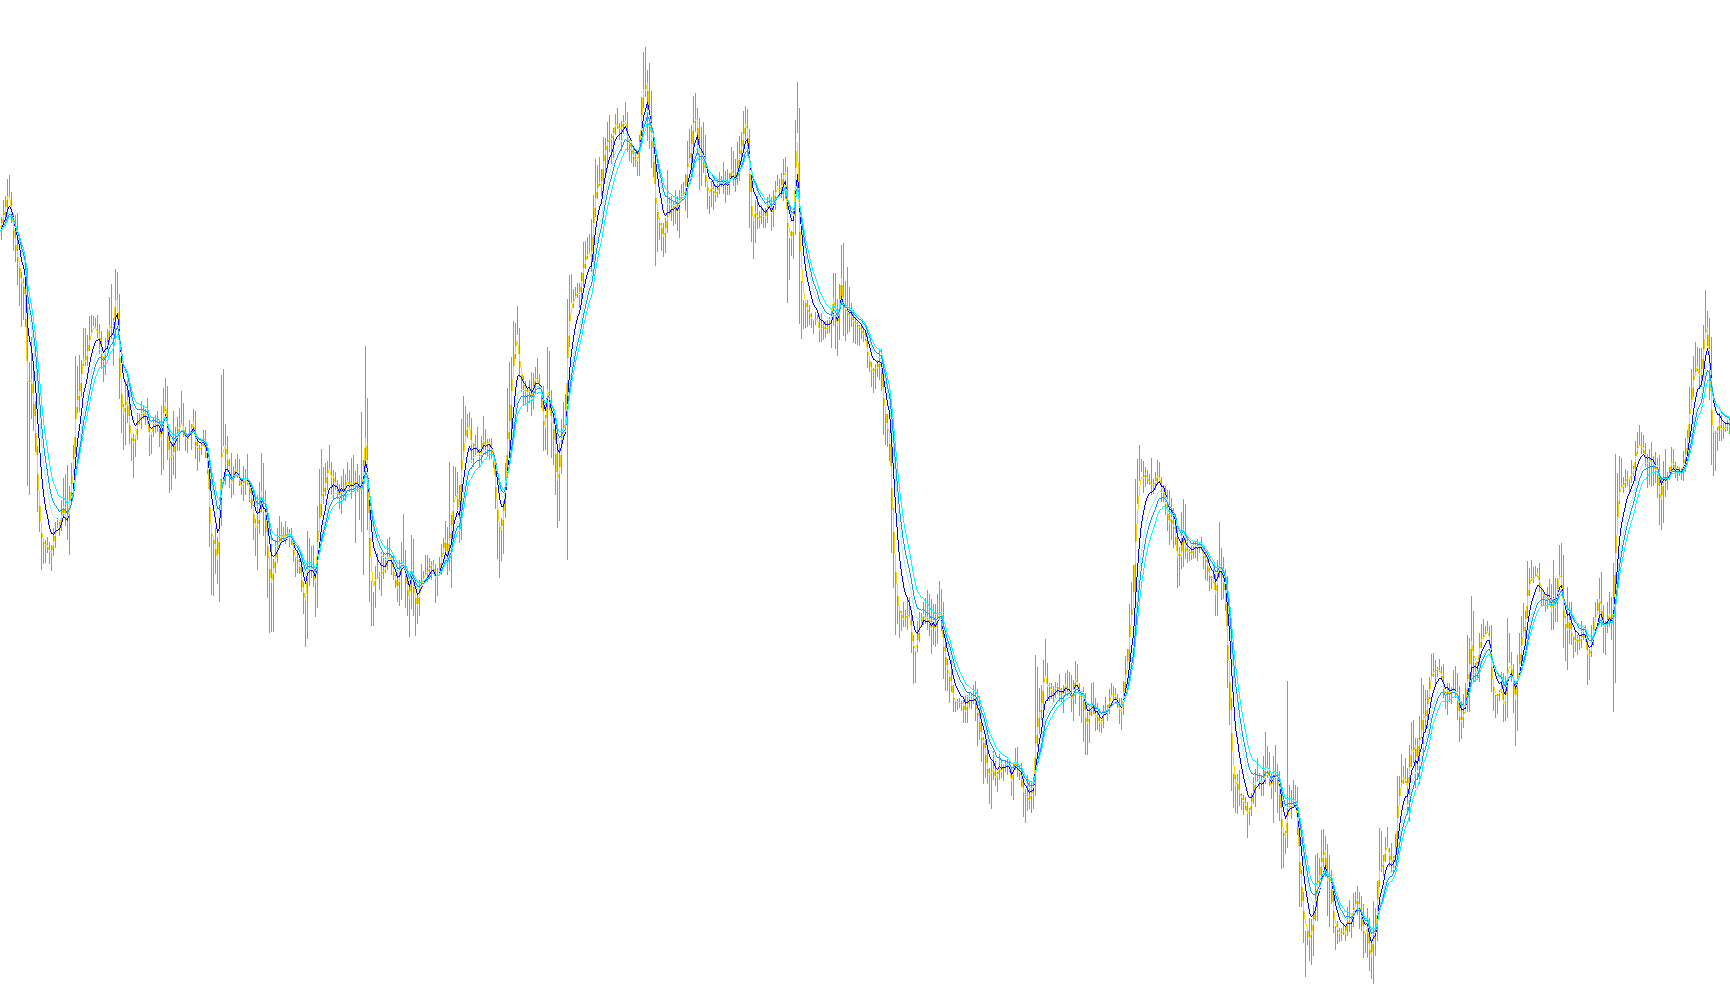
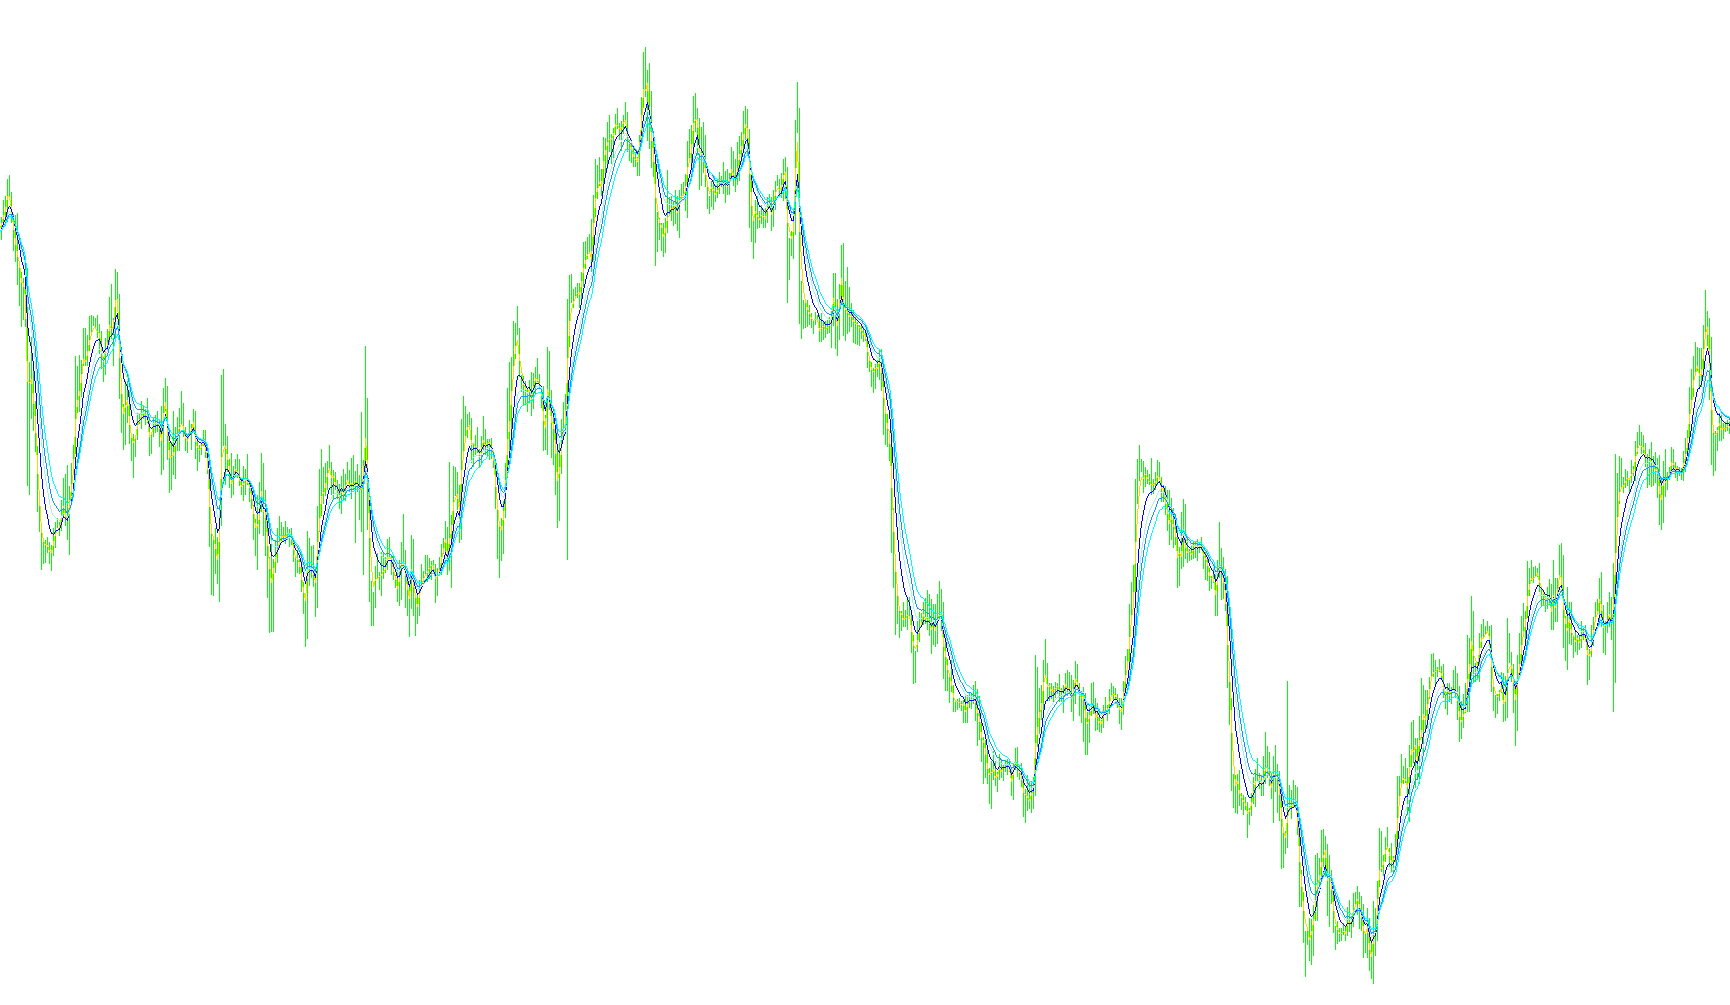
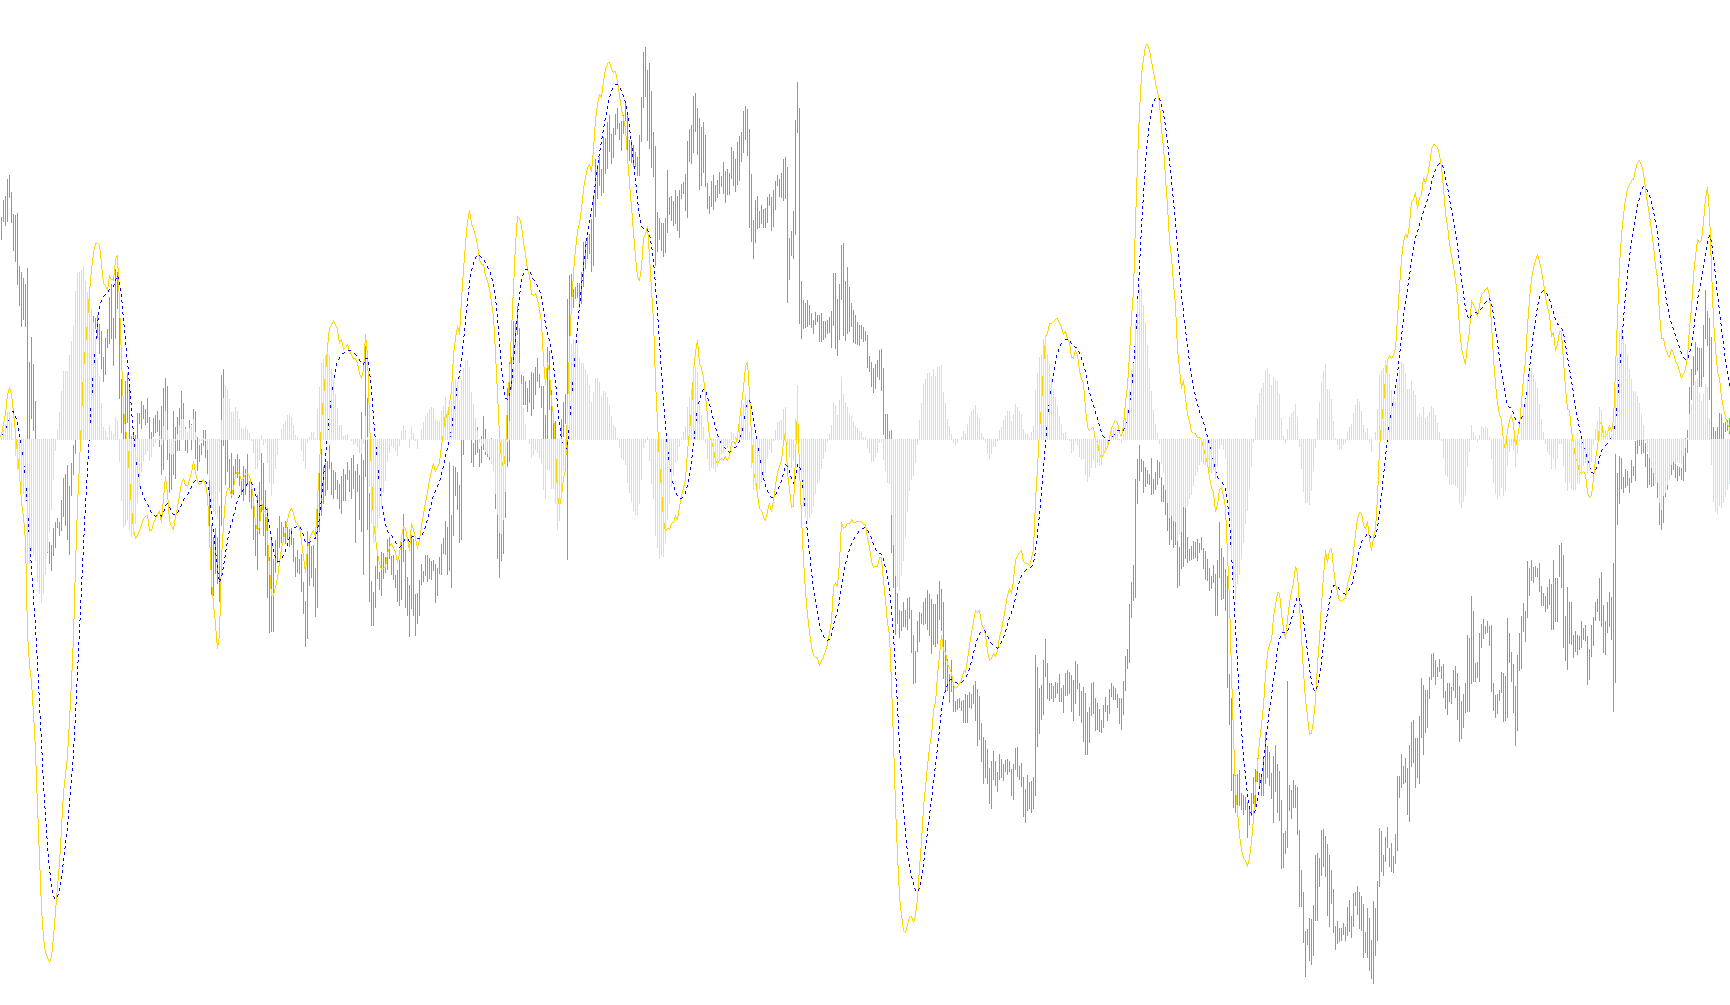
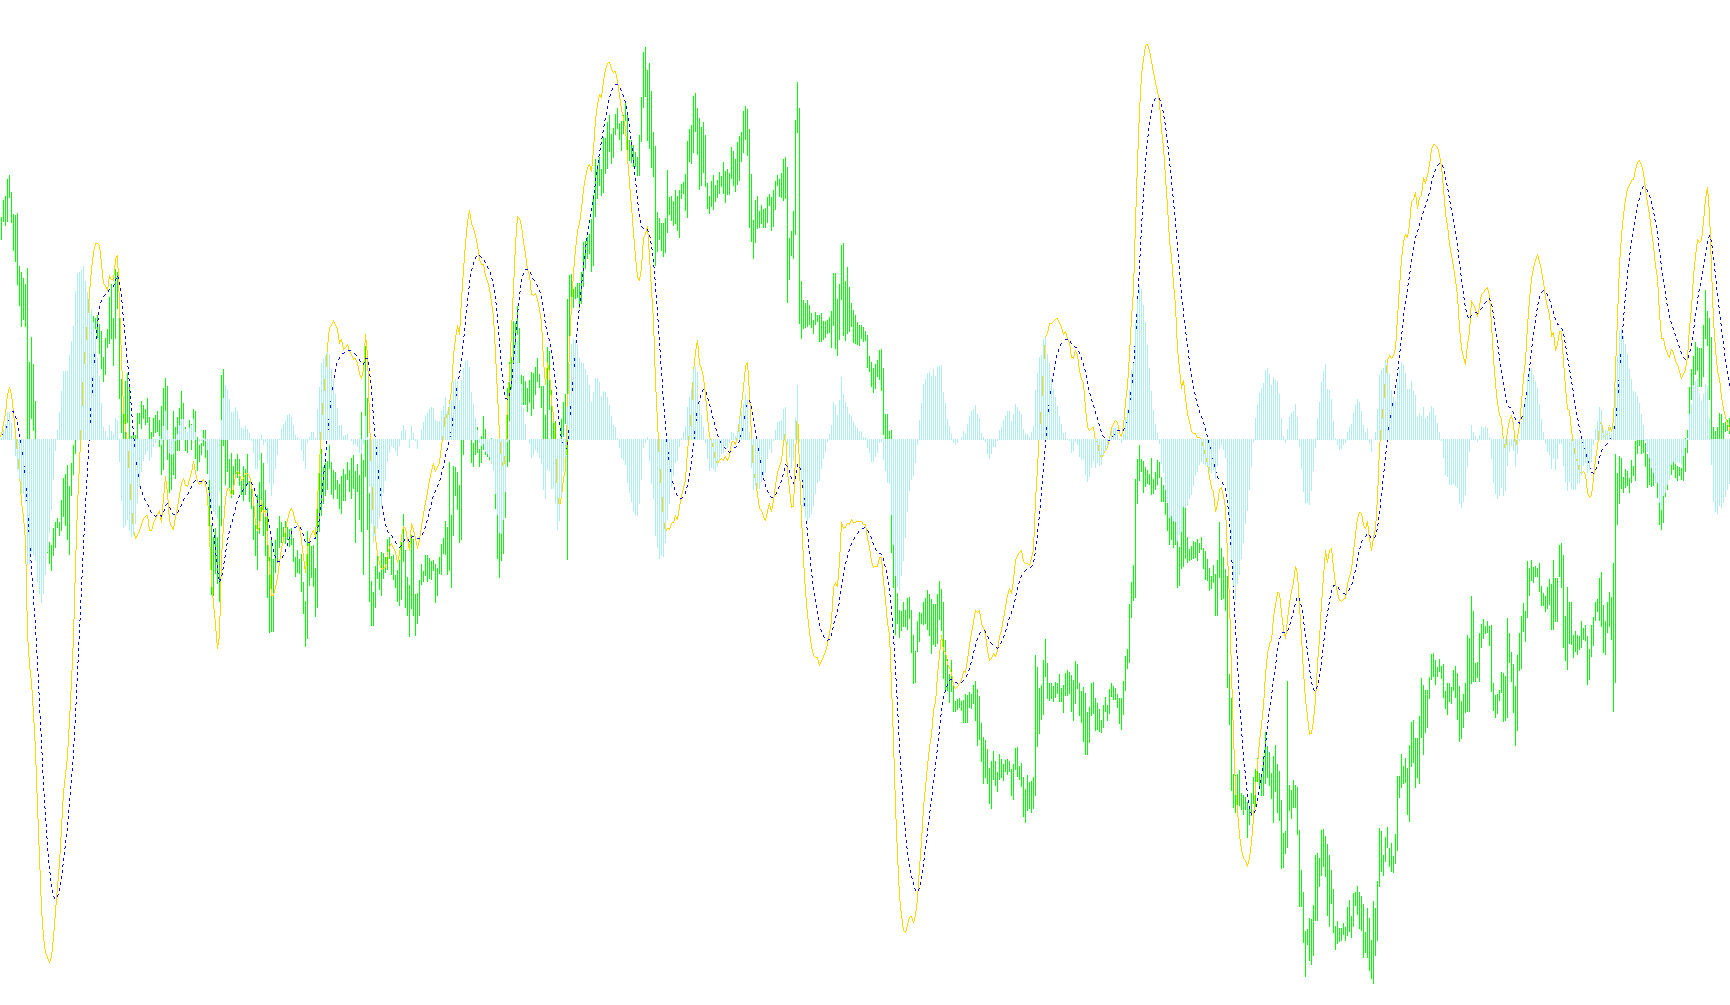
This indicator identifies directional bias by comparing real-time price action against smoothed moving averages across multiple synchronized timeframes.

FXFreedomBars_v3
Indicator

FXFreedomBars_v3

iCCIiMA

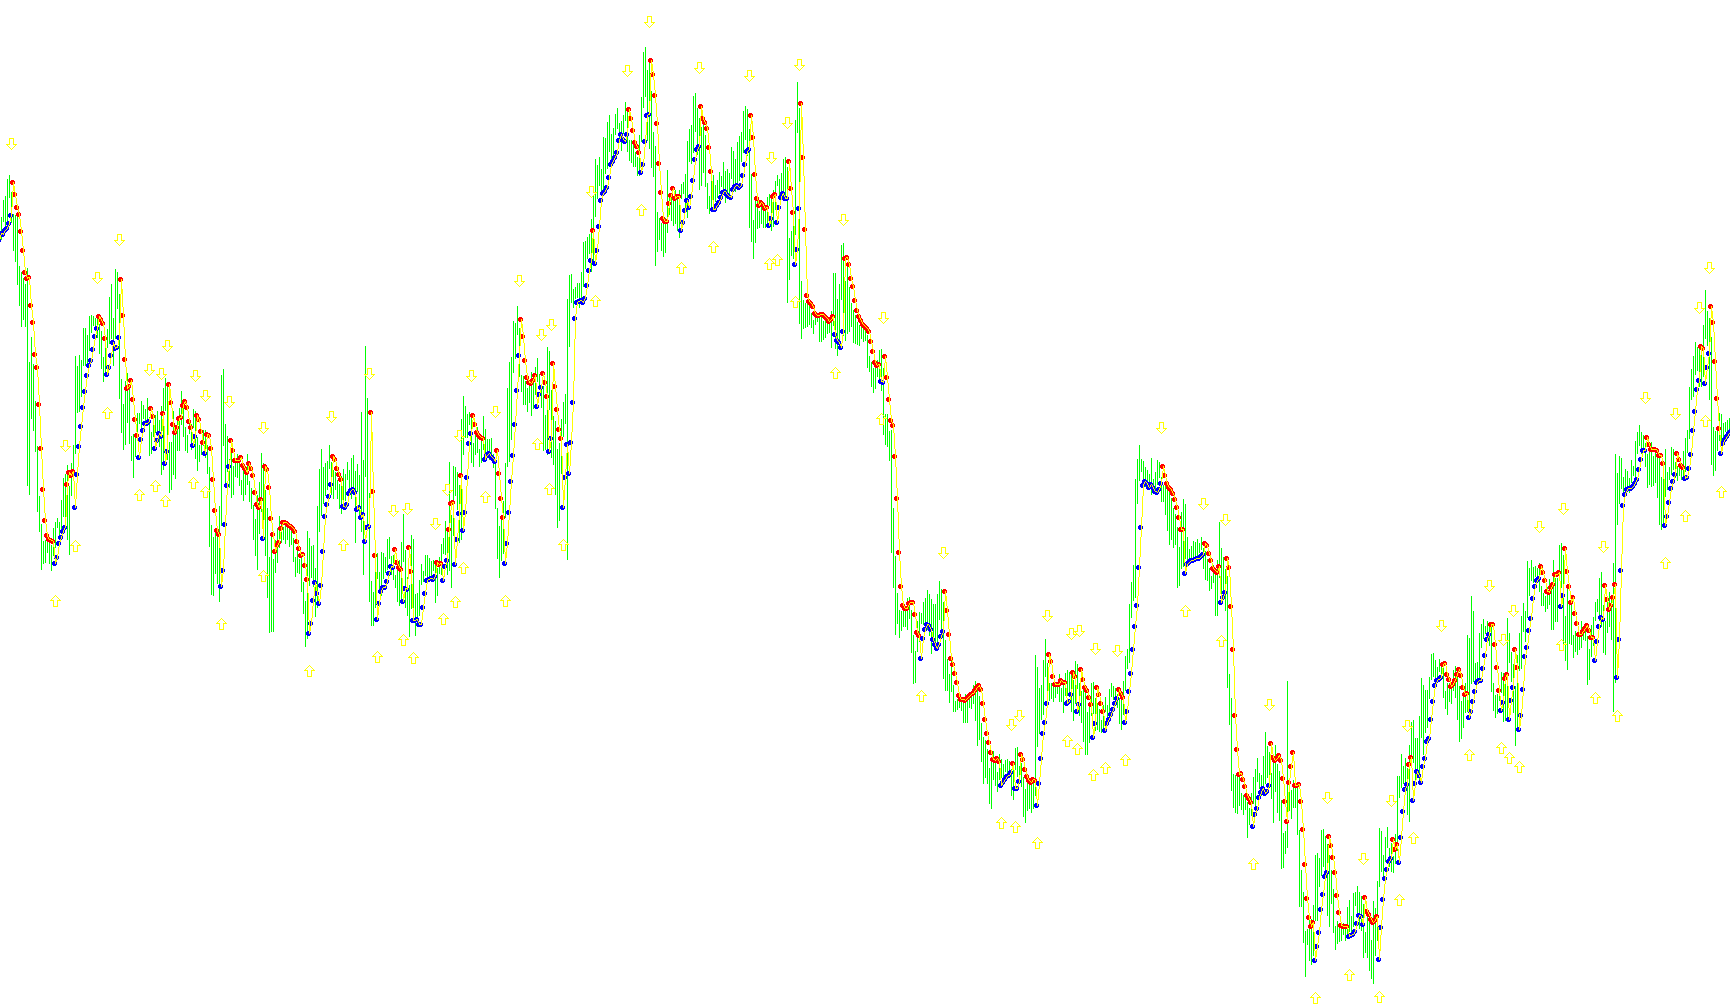
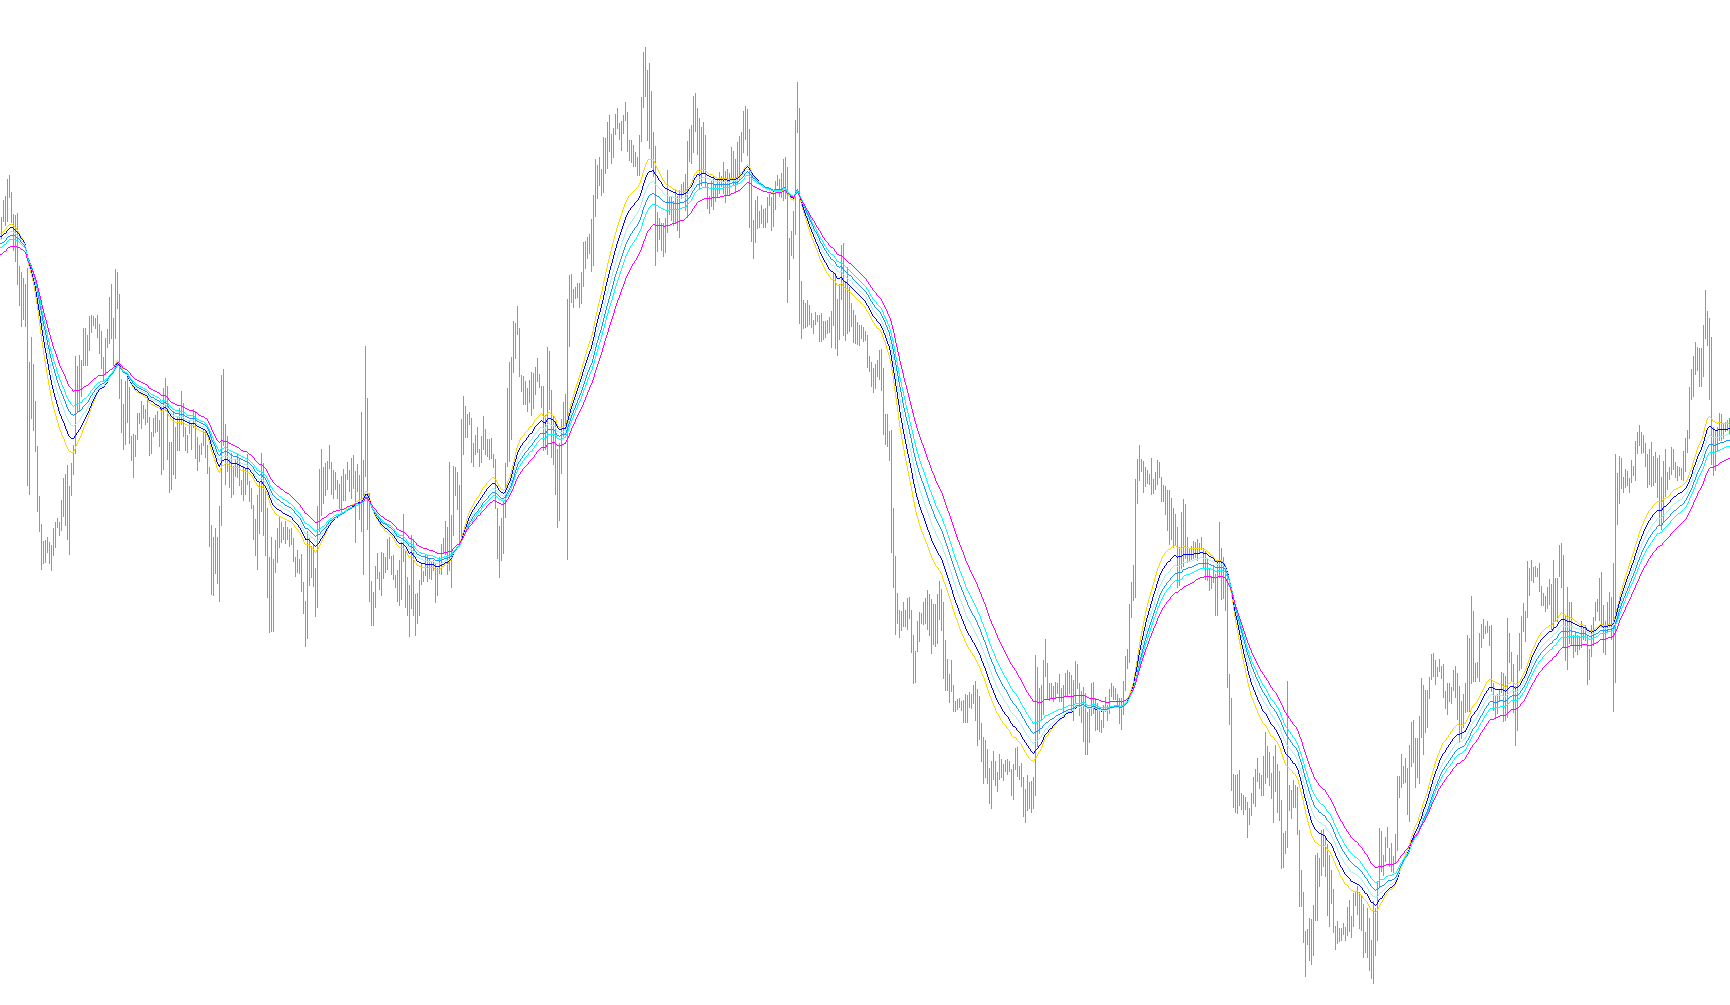
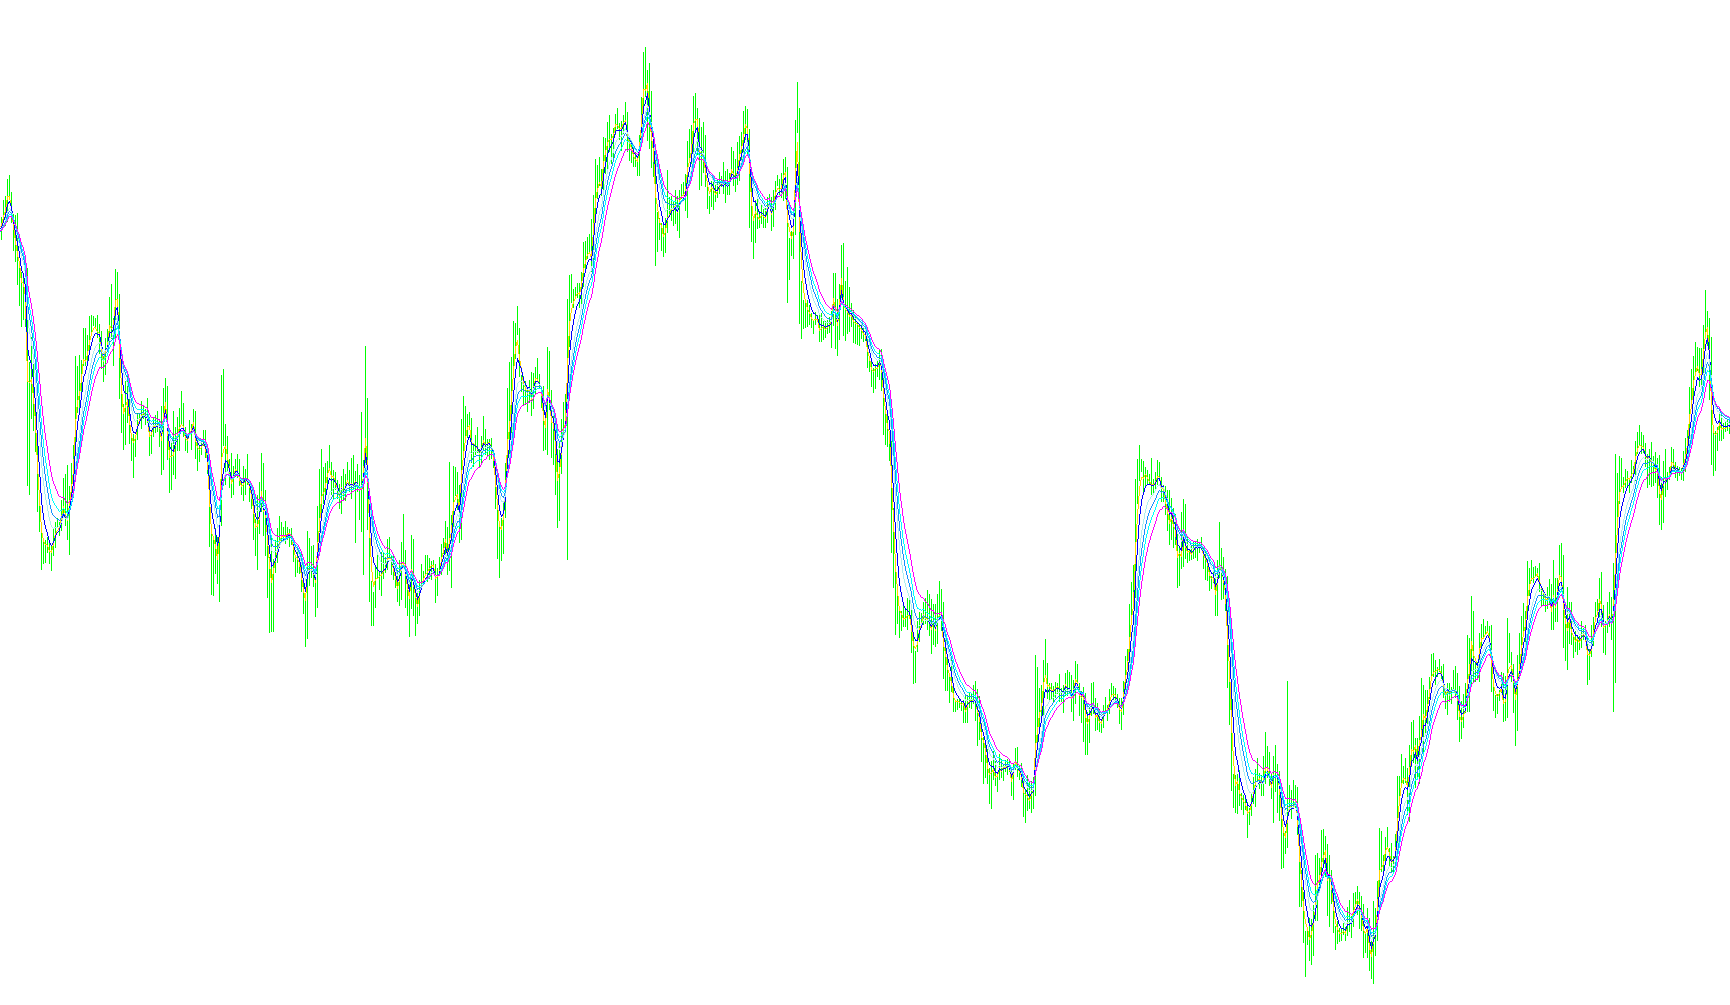
This indicator synchronizes Price Action with Moving Average trends across four distinct timeframes simultaneously to identify multi-layered trend alignment.

FXGaugeMAs_lite
Indicator

FXGaugeMAs_lite

iMA

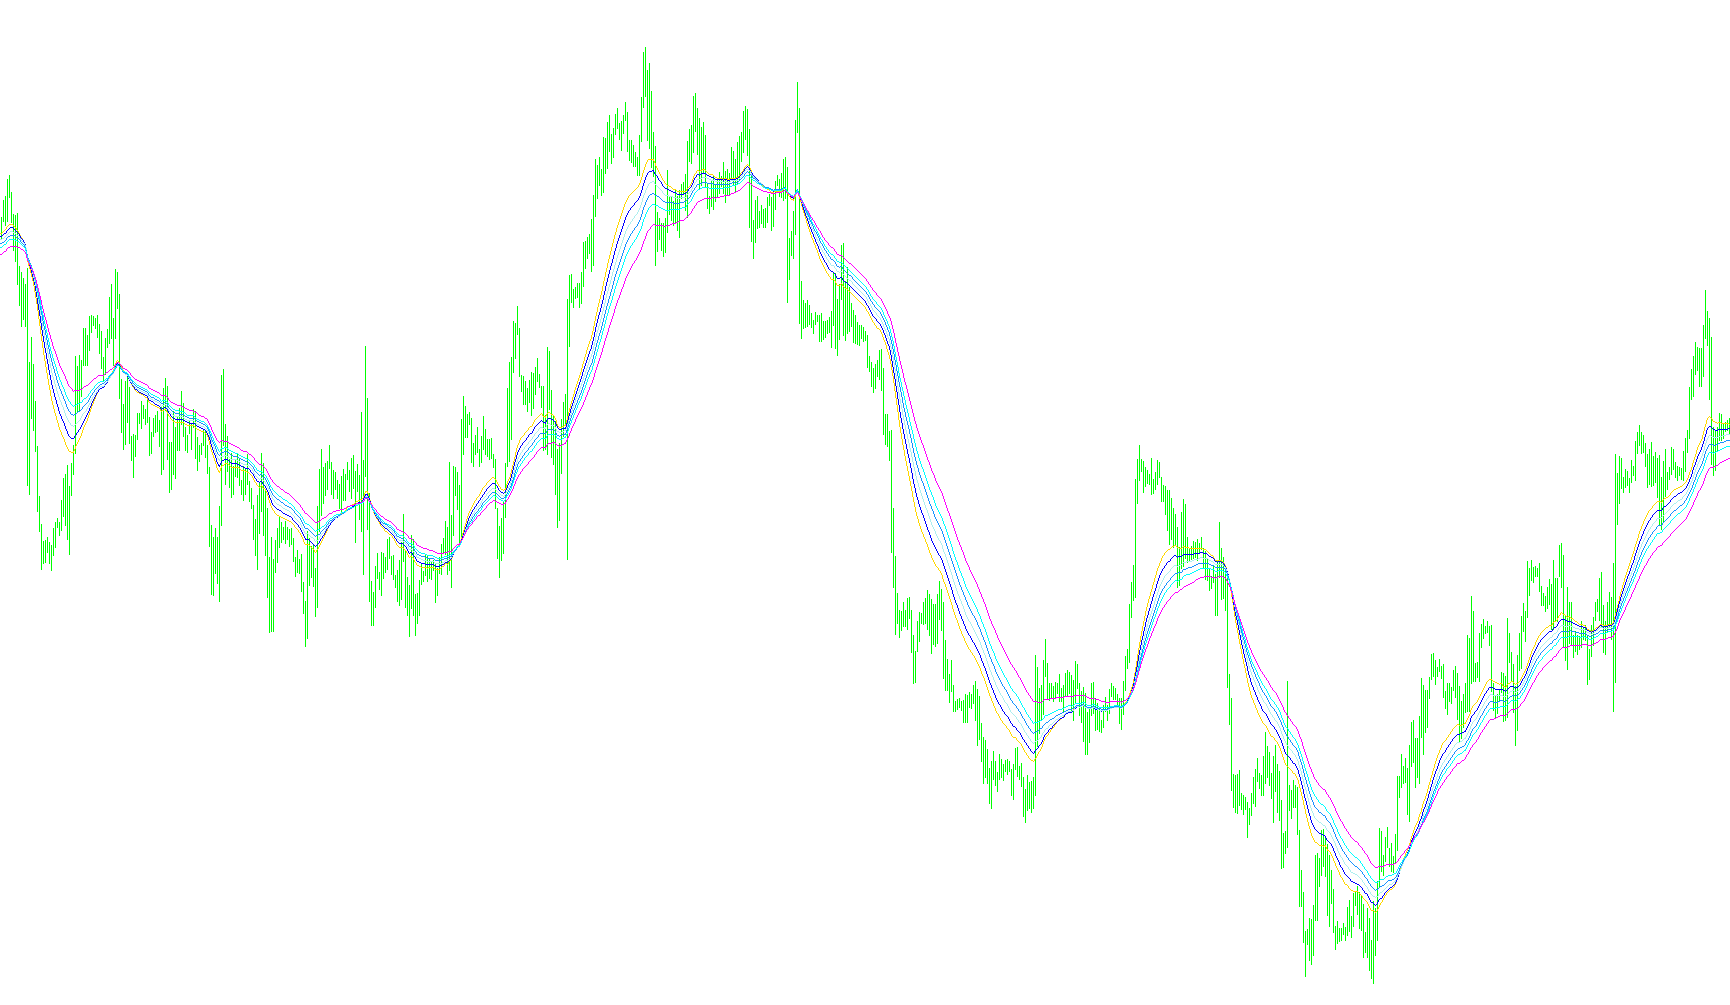
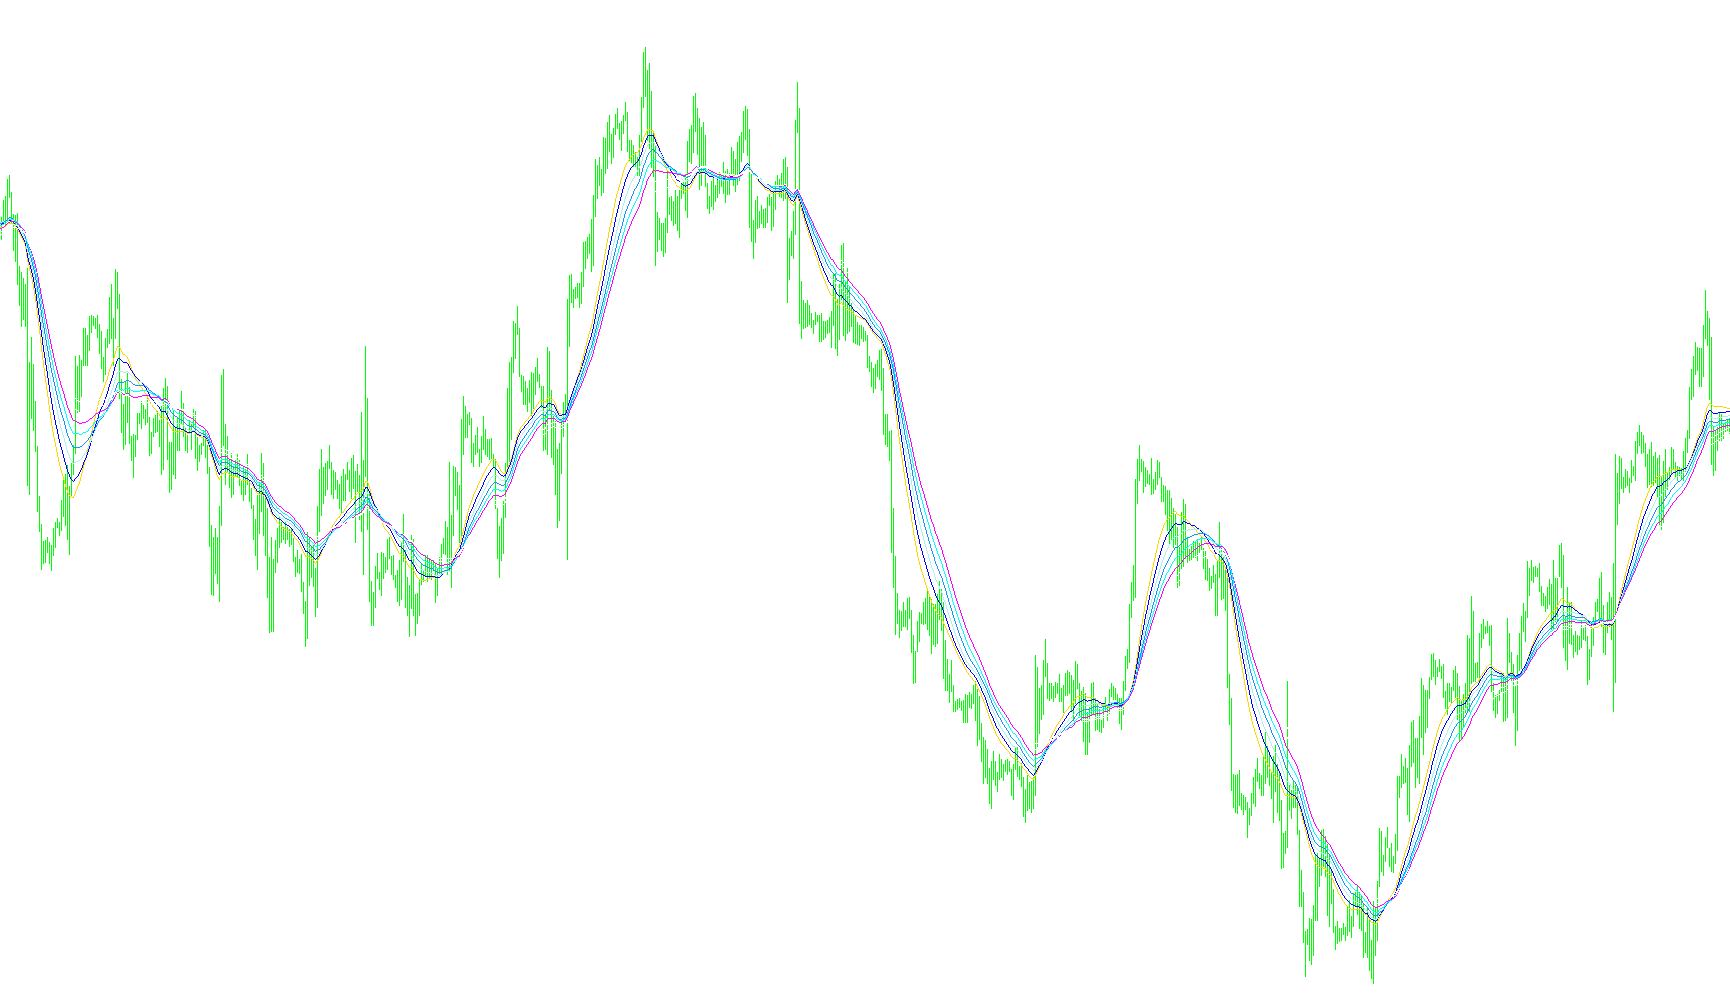
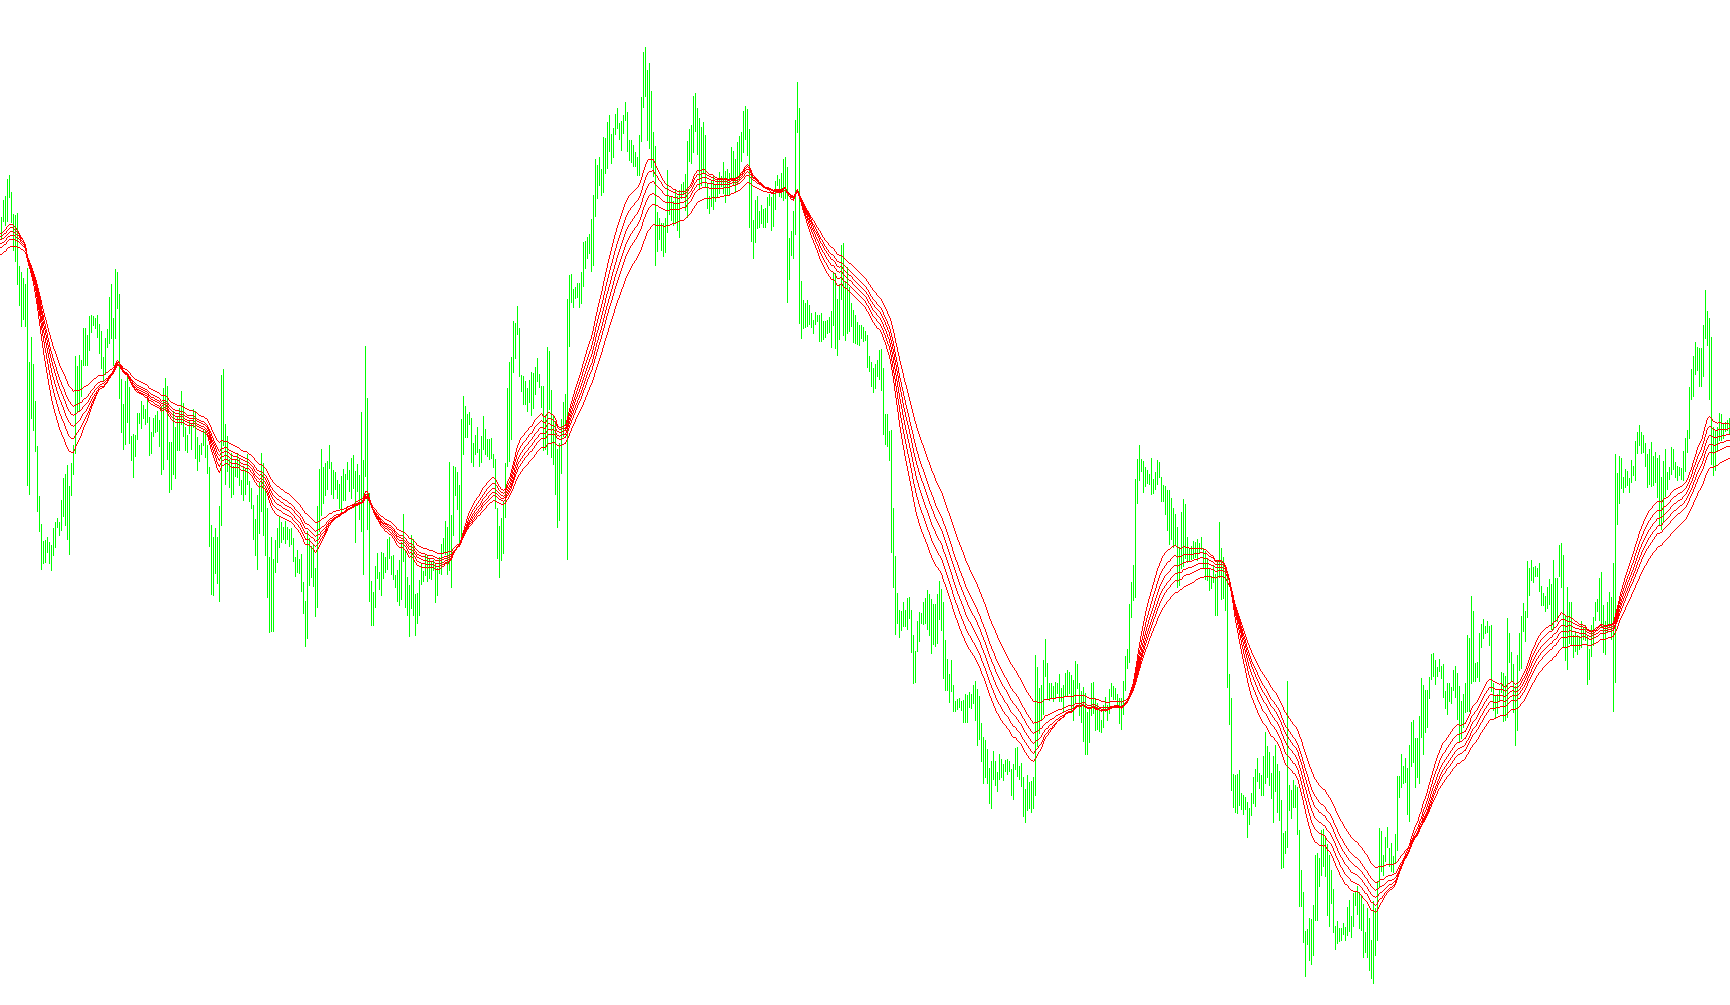
This indicator renders a synchronized ensemble of seven Simple Moving Averages mapped to classic Fibonacci intervals to visualize structural momentum and trend curvature.

FXprime_V2 Final
Indicator

FXprime_V2 Final

iCCIiADXiMAiRSI

This indicator identifies high-probability trade entries by synchronizing EMA slope intensity with CCI momentum thresholds, RSI strength, and ADX trend directionality.

fxprime_v231
Indicator

fxprime_v231

iCCIiADXiMAiRSI

This indicator identifies high-probability trend entries by synchronizing EMA angular velocity, RSI momentum, and CCI multi-period crossovers with ADX directional strength.

FXRaiderTable_enM
Indicator

FXRaiderTable_enM

iMACDiMA

This indicator synthesizes moving averages, MACD oscillators, and Parabolic SAR across weekly, daily, and hourly intervals to provide a visual matrix of directional momentum alignment for multiple currency pairs simultaneously.

FXSniperMA_SW
Indicator

FXSniperMA_SW

iMA

This indicator identifies directional momentum shifts by detecting the precise change in slope of various moving average types and projecting visual markers on trend reversals.

f_rsi
Indicator

f_rsi

iMA

This indicator calculates a modified Relative Strength Index using smoothed price momentum and generates dynamic upper and lower boundary levels based on the standard deviation of historical RSI values.

GA-ind
Indicator

GA-ind

iMAiMAOnArray

Calculates the sum of two Exponential Moving Averages to derive a primary trend line, overlaid with a Simple Moving Average signal for momentum shifts.

GA-ind_2color
Indicator

GA-ind_2color

iMAiMAOnArray

This indicator calculates the sum of two Exponential Moving Averages and identifies bullish or bearish momentum by comparing that aggregate against a Simple Moving Average signal line.

Gann Hi-lo Activator SSL
Indicator

Gann Hi-lo Activator SSL

iMA

The algorithm identifies trend direction by comparing current closing prices against smoothed high and low averages to plot a responsive structural boundary line.

Gann Hi-lo Activator SSL_001
Indicator

Gann Hi-lo Activator SSL_001

iMA

This indicator dynamically switches between high and low price moving averages based on a momentum-driven trend detection logic.

Gann HiLo Activator
Indicator

Gann HiLo Activator

iMA

This indicator identifies trend reversal points by detecting instances where price action breaches simple moving averages calculated from the high and low extremes.

Gann HiLo ActivatorV2
Indicator

Gann HiLo ActivatorV2

iMA

This indicator identifies price extremes by detecting breaches of high and low simple moving average envelopes to pinpoint structural reversal levels.

Gann HiLo ActivatorV2_Alert_Email
Indicator

Gann HiLo ActivatorV2_Alert_Email

iMA

This indicator identifies trend exhaustion by detecting price breaches of high/low SMA boundaries relative to a secondary moving average filter.

Gann HiLo ActivatorV2_Alert_Email_v1.1 todd
Indicator

Gann HiLo ActivatorV2_Alert_Email_v1.1 todd

iMA

This indicator identifies price momentum shifts by detecting breaches of high and low moving averages relative to a secondary smoothed trend filter.

Gann HiLo ActivatorV2_Alert_Email_v1.1
Indicator

Gann HiLo ActivatorV2_Alert_Email_v1.1

iMA

This indicator identifies trend shifts by detecting price crossovers between moving averages of high/low extremes and a primary closing price moving average.

Gann HiLo ActivatorV2_Alert_Email_v1.1_001
Indicator

Gann HiLo ActivatorV2_Alert_Email_v1.1_001

iMA

Identifies trend reversals by detecting when price action breaks through high and low moving average boundaries relative to a secondary trend filter.

Gann_v1
Indicator

Gann_v1

iMA

The indicator identifies potential trend reversals by monitoring price breaches of moving average bounds calculated from high and low price extremes.

gator
Indicator

gator

iMA

This indicator quantifies market volatility and trend direction by calculating the absolute differential between three nested moving averages with varying periods and shifts.

Gator_v1
Indicator

Gator_v1

iMA

This indicator quantifies market momentum by calculating the absolute differences between three nested moving averages to visualize expansion and contraction zones through dual-colored histogram bars.

Gaussian filter
Indicator

Gaussian filter

iMA

The indicator applies a high-order Gaussian kernel to price action to isolate underlying trends by suppressing market noise through recursive coefficient weighting.

Gem-xpMA
Indicator

Gem-xpMA

iMAiMAOnArray

This indicator synthesizes diverse moving average algorithms to identify trend reversals by comparing current price action against a dynamic short-term localized mean.

GentorCCI
Indicator

GentorCCI

iCCIiMA

This indicator synthesizes multi-period Commodity Channel Index calculations with dynamic EMA price filtering to identify momentum divergence and trend bias.

GentorCCIM_v[1].0.0
Indicator

GentorCCIM_v[1].0.0

iCCIiMA

This indicator synthesizes dual Woodie CCI oscillators with EMA trend filters and LSMA price-action weighting to identify momentum divergence and trend shifts.

GentorCCI_v1
Indicator

GentorCCI_v1

iCCIiMA

This indicator synthesizes multi-period Commodity Channel Index (CCI) crossovers with EMA price action filtering to identify momentum shifts and trend exhaustion.

GentorCCI_v2
Indicator

GentorCCI_v2

iCCIiMA

This indicator identifies momentum shifts by calculating the variance between fast and slow CCI values while filtering trend directionality through an EMA-based price crossover.

GG-RiverFlow
Indicator

GG-RiverFlow

iMA

This indicator visualizes the synchronization of Exponential Moving Average crossovers across multiple timeframes simultaneously to identify unified trend direction.

Gioteen-Norm
Indicator

Gioteen-Norm

iMA

This indicator quantifies price momentum by calculating the normalized difference between the current price and its moving average relative to the standard deviation.

GMMA Long
Indicator

GMMA Long

iMA

This indicator identifies long-term structural trends by plotting a series of synchronized exponential moving averages to visualize collective institutional price flow.

GMMA Long_v1
Indicator

GMMA Long_v1

iMA

This indicator projects six distinct exponential moving averages ranging from 30 to 60 periods to visualize multi-layered trend momentum and price equilibrium.

GMMA Long_v2
Indicator

GMMA Long_v2

iMA

This indicator visualizes the interplay of six sequential exponential moving averages to identify structural trend transitions and price momentum.

GMMA Long_v3
Indicator

GMMA Long_v3

iMA

This indicator synthesizes six distinct exponential moving averages to visualize institutional trend strength and long-cycle momentum shifts.

GMMA Long_v4
Indicator

GMMA Long_v4

iMA

This indicator visualizes the convergence and divergence of six high-period exponential moving averages to identify structural trend shifts and momentum stability.

GMMA Sashken_v1
Indicator

GMMA Sashken_v1

iMA

This indicator projects a series of progressive moving averages with incremental periods to visualize trend synchronization and momentum shifts.

GMMA Short
Indicator

GMMA Short

iMA

This indicator visualizes a tight cluster of five exponential moving averages with periods ranging from 3 to 15 to identify short-term price momentum and trend cohesion.

GMMA Short_v1
Indicator

GMMA Short_v1

iMA

This indicator identifies immediate price momentum by calculating a cluster of five short-period exponential moving averages to visualize localized trend cohesion.

GMMA Short_v2
Indicator

GMMA Short_v2

iMA

This indicator visualizes high-frequency trend dynamics by clustering five rapid exponential moving averages to identify short-term price velocity and structural alignment.

GMMA Short_v3
Indicator

GMMA Short_v3

iMA

This indicator utilizes a cluster of five short-term exponential moving averages to identify immediate price velocity and trend synchronization.

GMMA Short_v4
Indicator

GMMA Short_v4

iMA

This indicator visualizes immediate price momentum by layering five rapid Exponential Moving Averages to identify short-term trend velocity and structural shifts.

GMMAShort6
Indicator

GMMAShort6

iMA

This indicator visualizes a high-frequency convergence of six nested exponential moving averages to identify immediate momentum shifts and micro-trend alignment.

GMMA_Long
Indicator

GMMA_Long

iMA

This indicator identifies structural market shifts by plotting a cluster of six exponential moving averages spanning the 30 to 60 period range to visualize macro trend synchronization.

GMMA_Long_v1
Indicator

GMMA_Long_v1

iMA

This indicator identifies structural bullish sentiment by plotting a cluster of six progressive exponential moving averages to visualize medium and long-term price momentum.

GMMA_Short
Indicator

GMMA_Short

iMA

This indicator evaluates immediate price velocity by overlaying a dense cluster of five exponential moving averages to identify short-term trend alignment.

GMMA_Short_v1
Indicator

GMMA_Short_v1

iMA

This tool analyzes short-term price velocity by aggregating a cluster of high-frequency exponential moving averages to visualize immediate trend convergence and divergence.

go
Indicator

go

iMA

This indicator calculates a weighted price-action momentum by aggregating the sum of relative price deviations across high, low, open, and close boundaries, scaled by the current bar's trading volume.

Good_Macd dark screen
Indicator

Good_Macd dark screen

iMA

The algorithm quantifies price velocity by calculating the divergence between two exponential moving averages and overlaying a smoothed signal line to identify trend momentum.

Good_Macd dark screen_v1
Indicator

Good_Macd dark screen_v1

iMA

This indicator quantifies relative price velocity by calculating the differential between dual exponential moving averages and generating a smoothed signal line for momentum tracking.

Good_Macd
Indicator

Good_Macd

iMA

Calculates the spread between two exponential moving averages and applies an alpha-weighted smoothing to derive a signal line and histogram for momentum identification.

Good_Macd_v1
Indicator

Good_Macd_v1

iMA

This indicator calculates the spread between two exponential moving averages and filters the resulting momentum through a smoothed signal line to generate a visual histogram of price velocity.