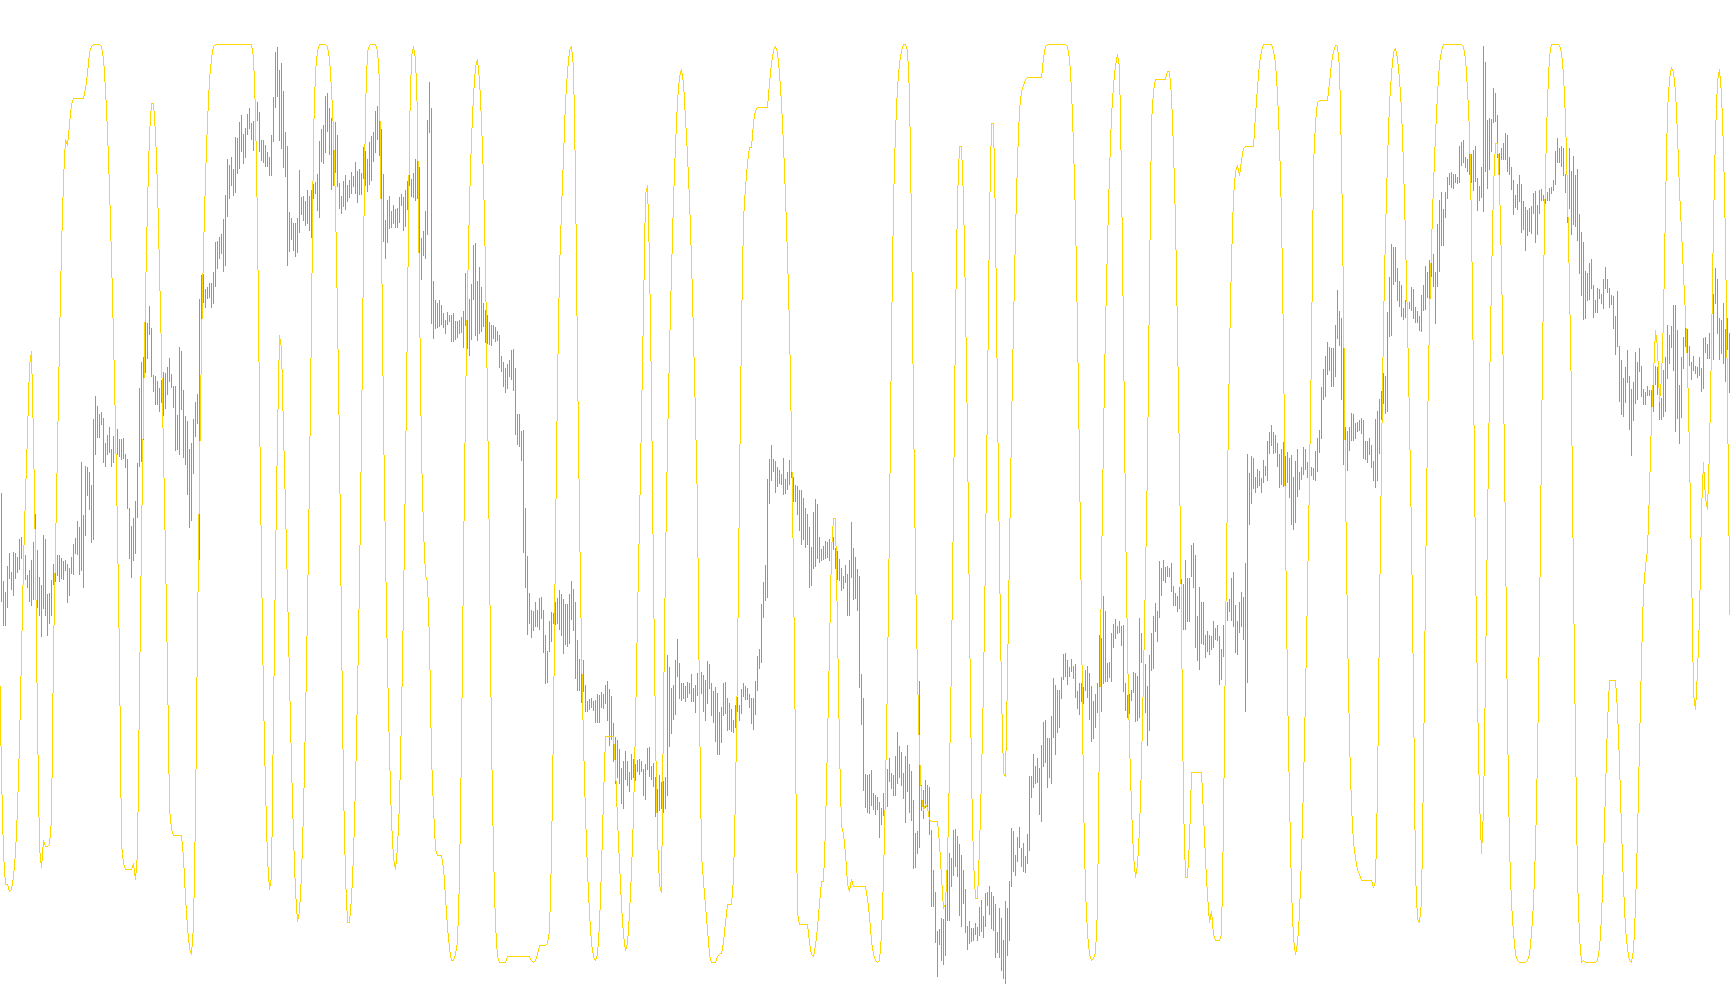
SMA_ CROSSOVER SIGNAL_v1
Indicator

SMA_ CROSSOVER SIGNAL_v1

iMA

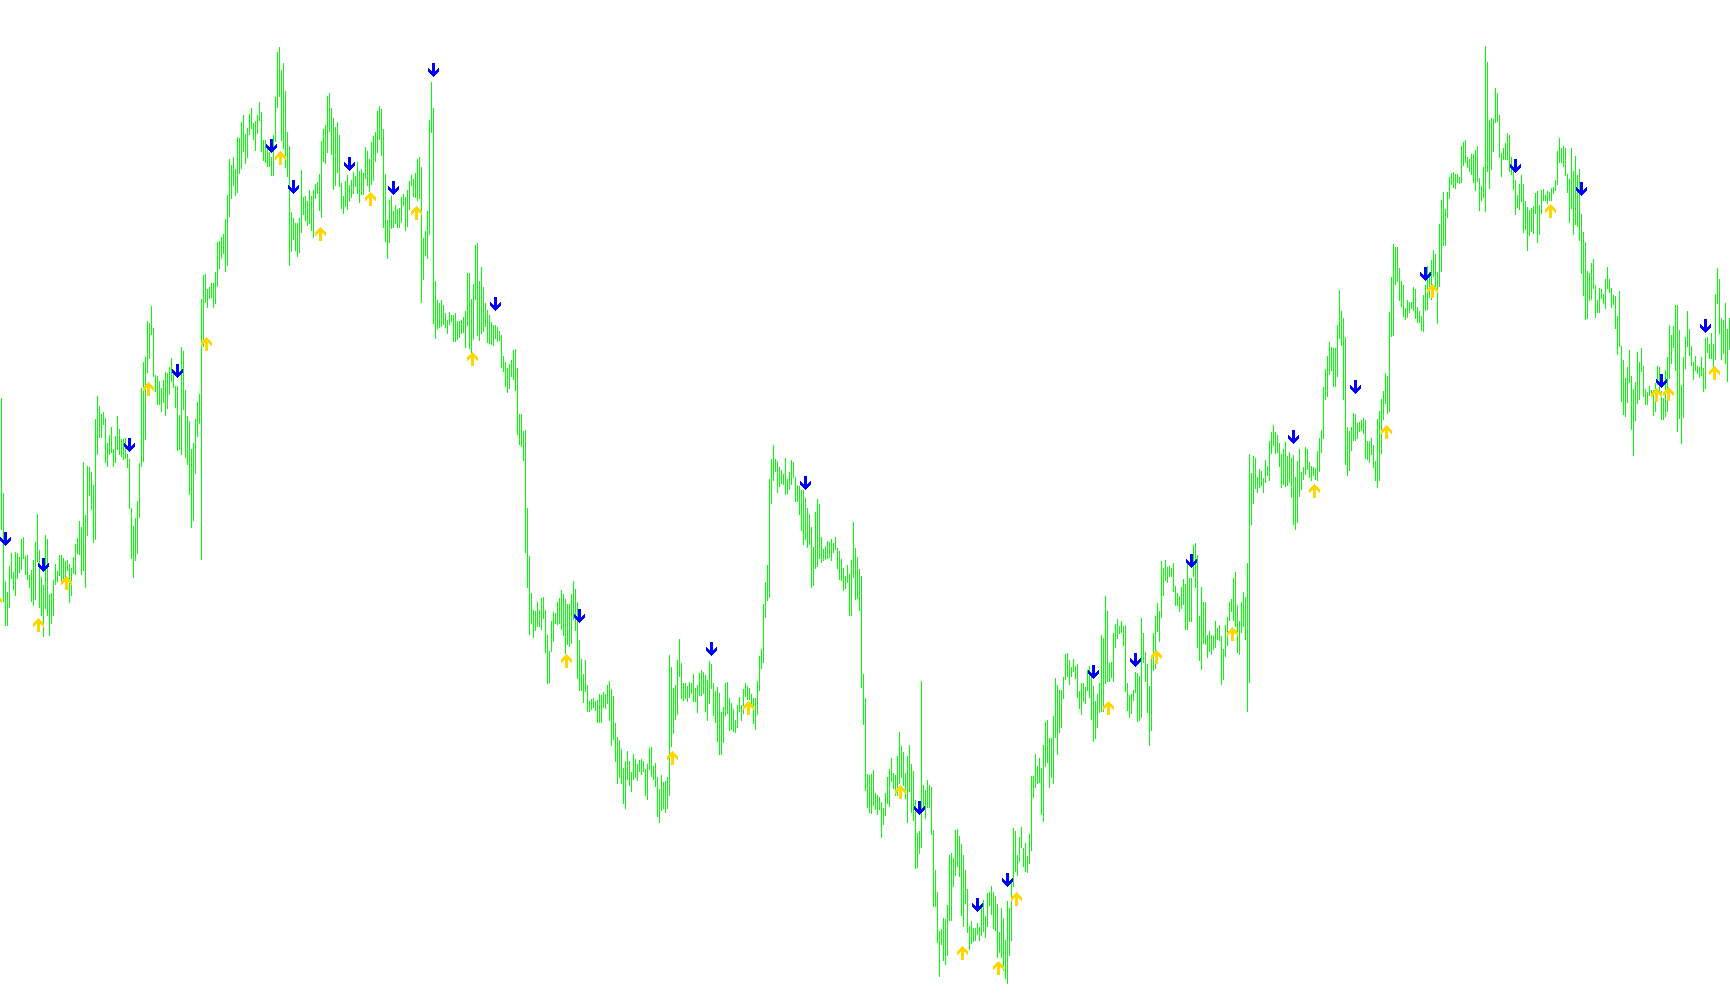
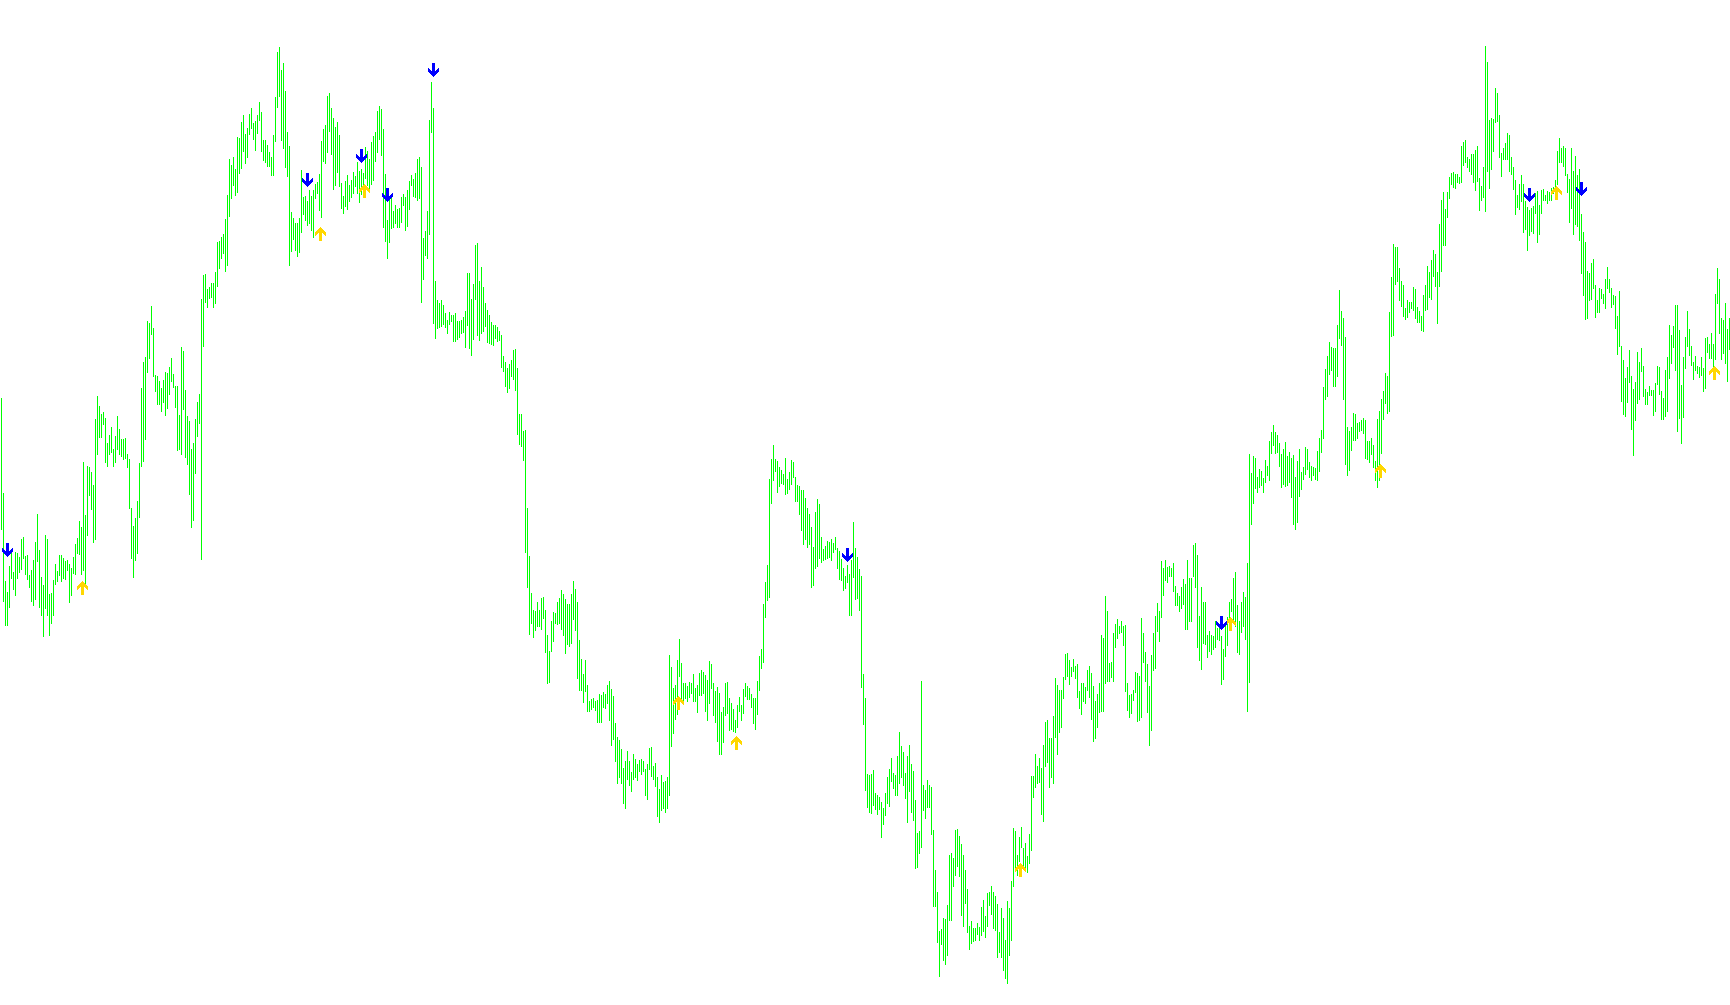
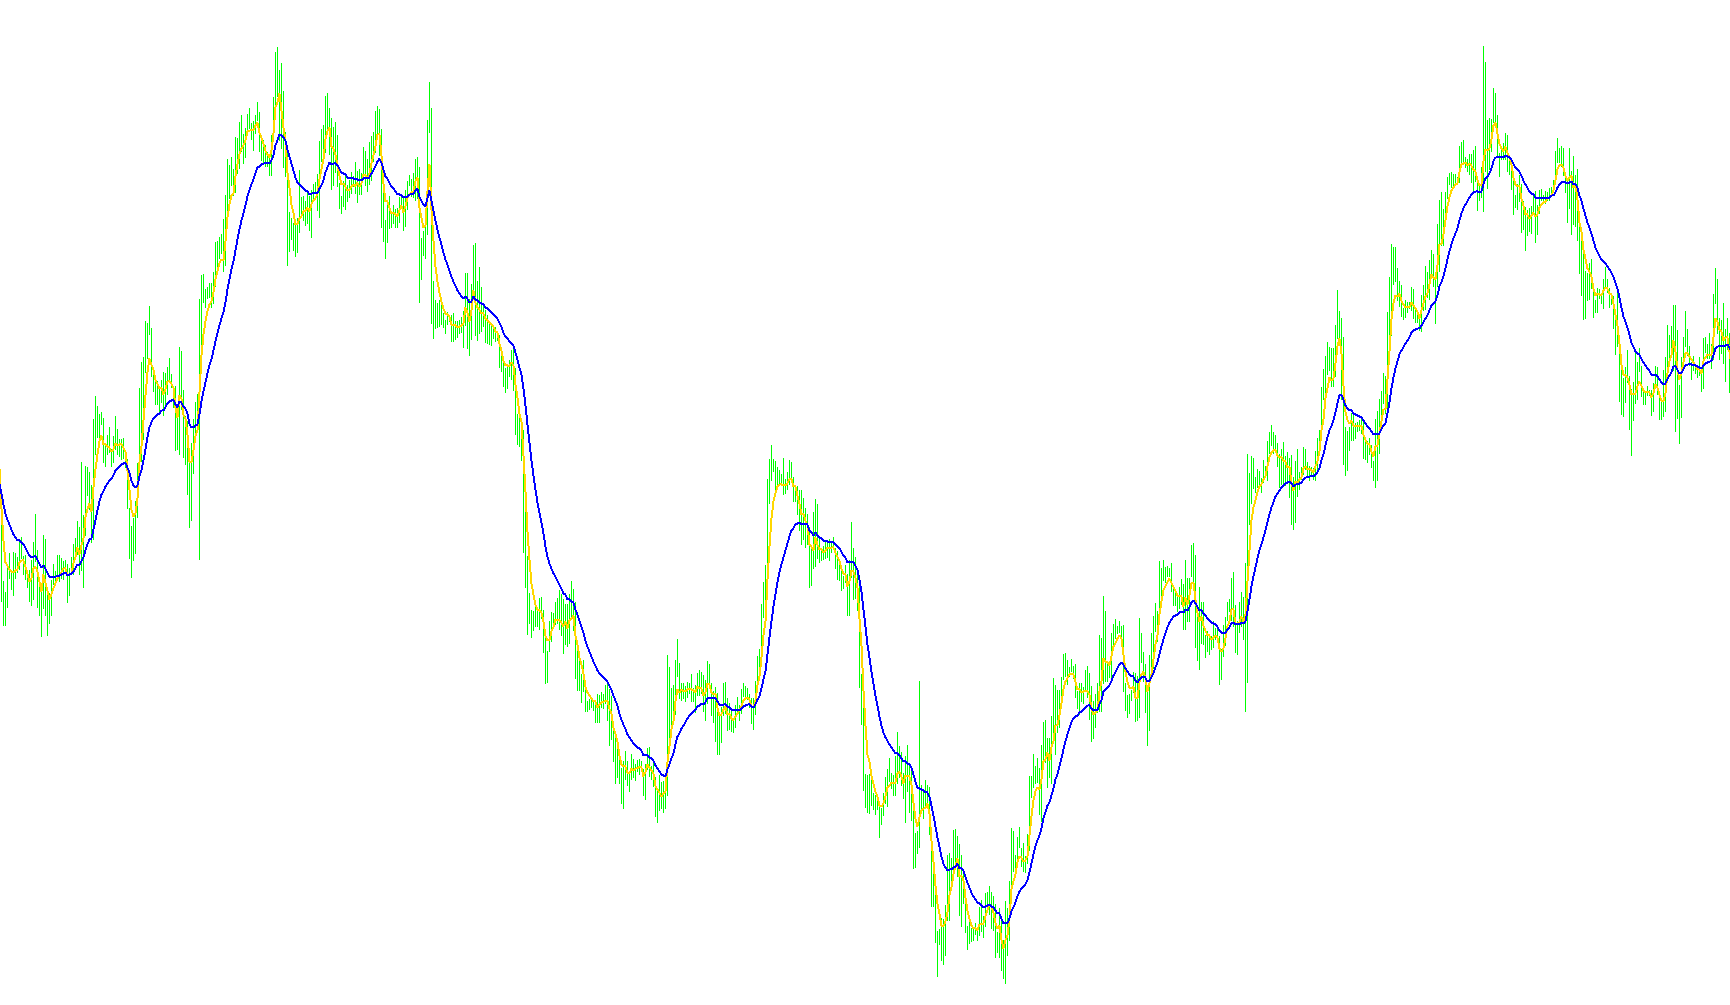
This indicator identifies and visualizes precise crossover points between two customizable moving averages while providing real-time alerts for momentum shifts.

SMA_Angle
Indicator

SMA_Angle

iMA

This indicator quantifies the directional slope of a Simple Moving Average to identify momentum strength or equilibrium states based on specific angular variance.

smC4Scalper_Candles_v3.1_trixBarsCW
Indicator

smC4Scalper_Candles_v3.1_trixBarsCW

iMAiMAOnArray

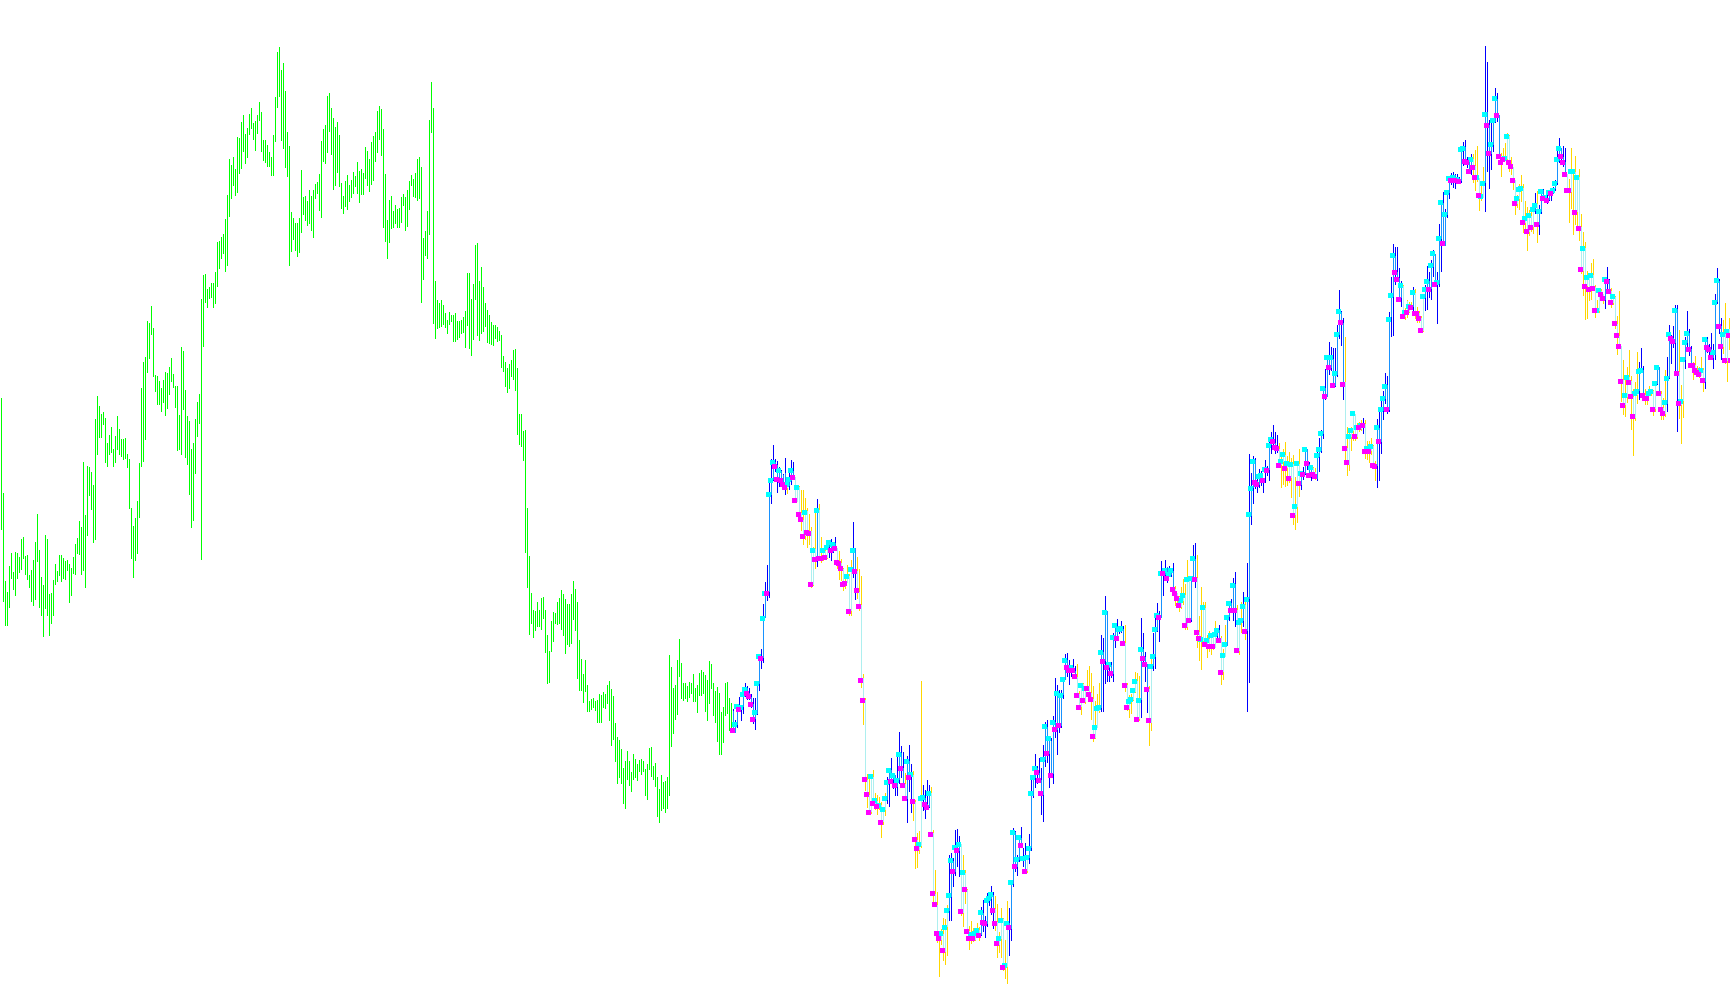
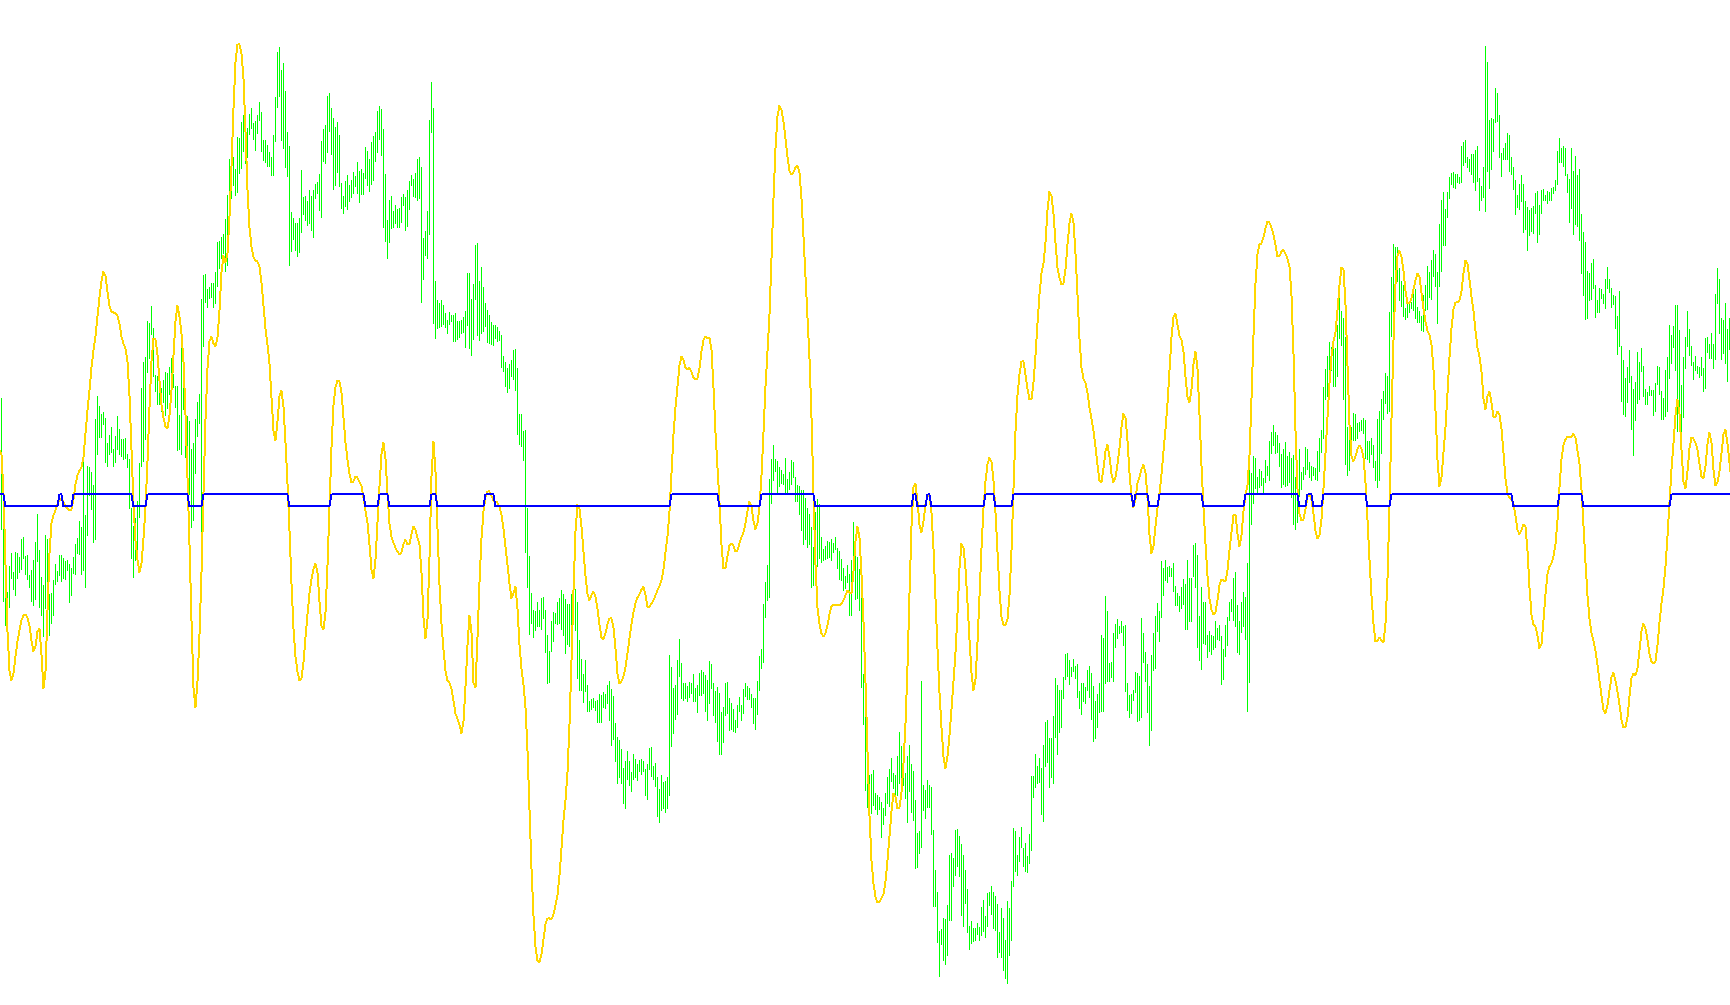
This indicator utilizes a nested Triple Exponential Moving Average (TRIX) architecture to calculate the rate of change and dynamically re-orient candle geometries based on bullish or bearish momentum shifts.

SMMA-Crossover_Signal
Indicator

SMMA-Crossover_Signal

iMA

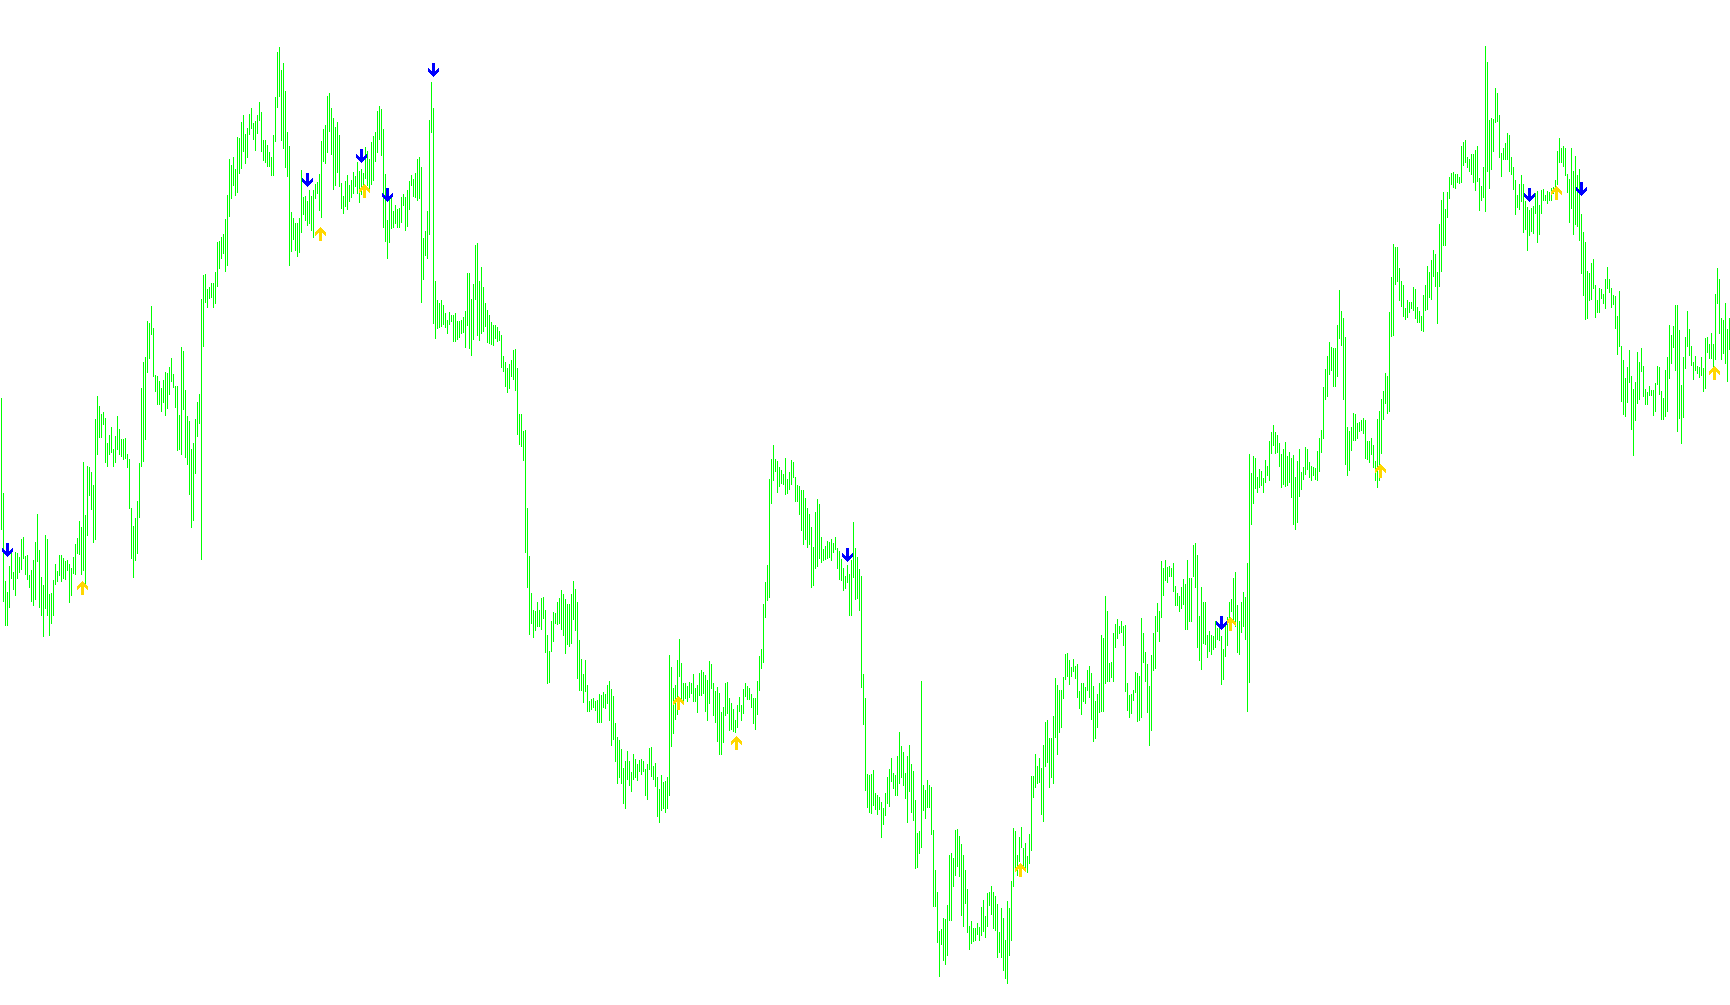
This indicator identifies precise bullish and bearish momentum shifts by plotting visual markers at the intersection points of two smoothed moving average periods.

SMMA-Crossover_Signal_v1
Indicator

SMMA-Crossover_Signal_v1

iMA

This indicator identifies precise price action reversal points by detecting momentum shifts where a fast Smoothed Moving Average intersects a slower baseline.

SMMA-Crossover_Signal_v3
Indicator

SMMA-Crossover_Signal_v3

iMA

This indicator identifies specific bull and bear reversals by plotting visual markers at the precise points where two smoothed moving average lines intersect.
SmoothCandle_Cv1.1
Indicator

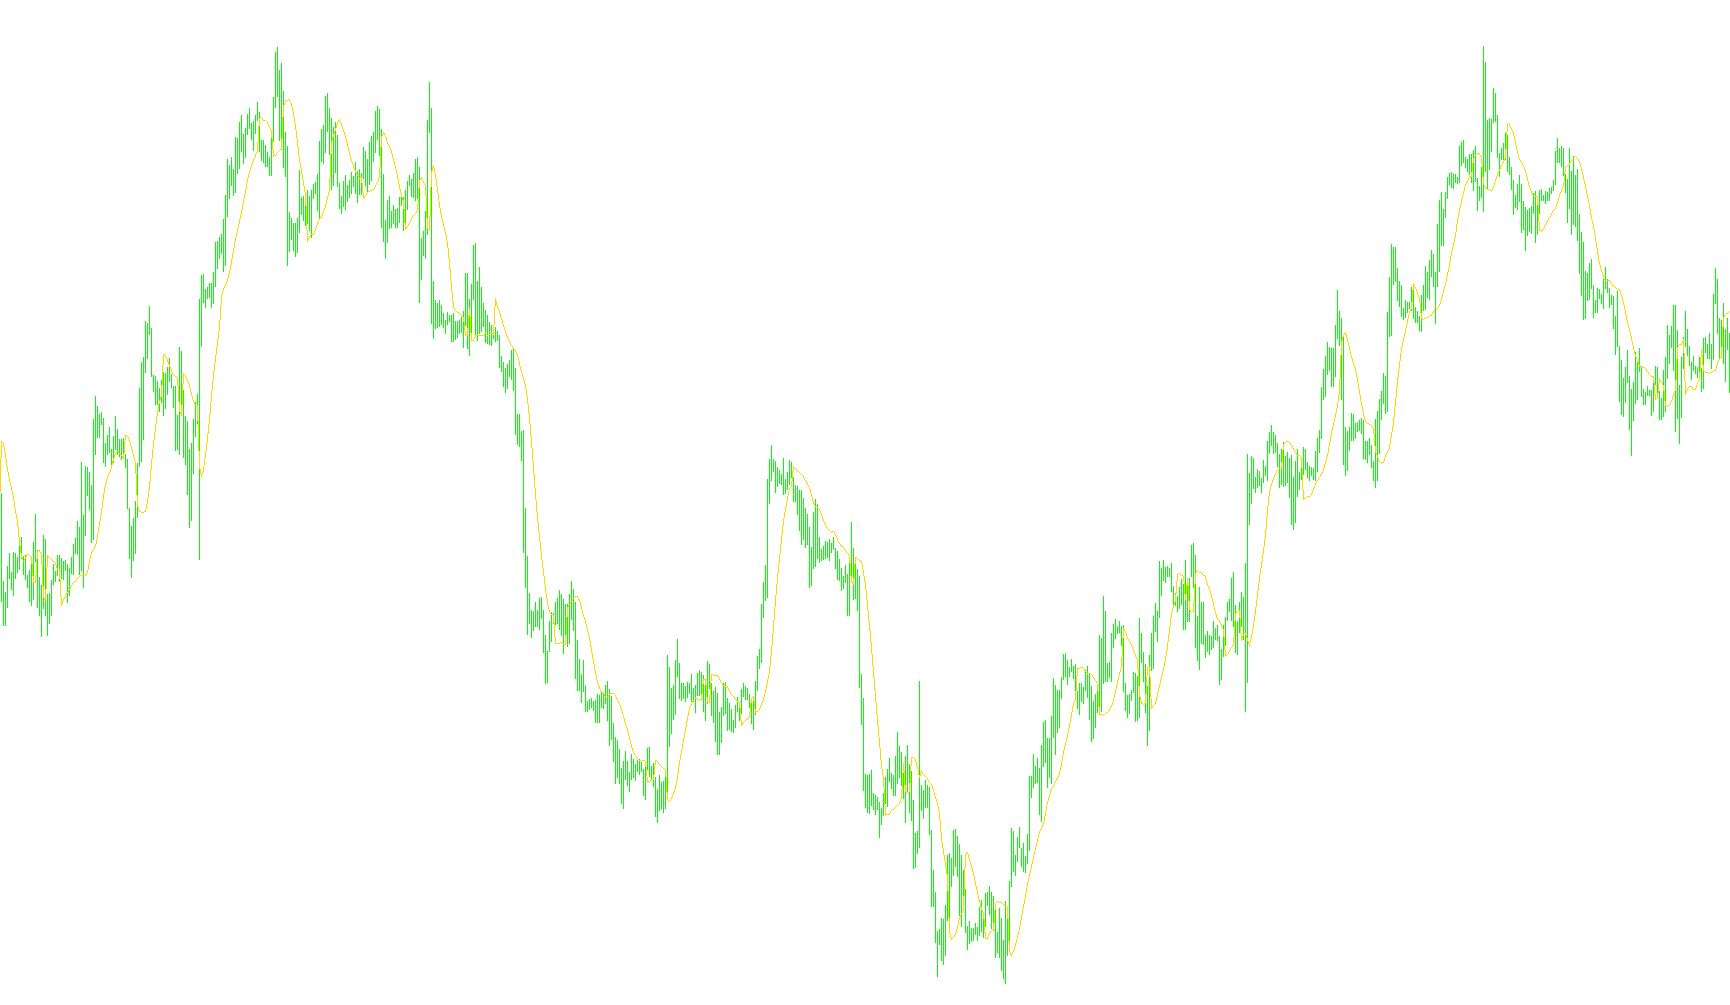
SmoothCandle_Cv1.1

iMA

This indicator calculates independent moving averages for the Open, High, Low, and Close price points to generate a stabilized structural overlay of candle geometry.

SmPriceBend-T01
Indicator

SmPriceBend-T01

iMA

This indicator quantifies price momentum by applying a weighted multi-stage smoothing filter to the directional delta between consecutive moving averages.

smSuperTRIX_PV_v2
Indicator

smSuperTRIX_PV_v2

iMAiMAOnArray

This indicator identifies trend reversals by calculating a triple-smoothed rate of change and generating directional signals based on zero-line crossovers and histogram momentum shifts.

Snake
Indicator

Snake

iMA

This indicator calculates a multi-weighted smoothed axis to determine market sentiment and volatility boundaries based on high/low extremes and weighted price averages.

SnakeBorders
Indicator

SnakeBorders

iMA

This indicator identifies volatility corridors by calculating a weighted moving average of price action and establishing upper and lower boundaries based on local extrema within configurable historical periods.

SnakeForce
Indicator

SnakeForce

iMA

This indicator utilizes a weighted moving average to identify price momentum forces and define relative resistance levels by calculating the delta between current price action and historical extremes.

SnakeForce~
Indicator

SnakeForce~

iMA

This indicator utilizes a recursive moving average calculation to detect trend velocity and identifies momentum shifts by measuring price deviation relative to local extrema.

SnakeInBorders
Indicator

SnakeInBorders

iMA

The algorithm calculates a price corridor and a signaling axis based on weighted moving averages, where the signal line oscillates between boundaries to identify volatility contraction and directional expansion.

SnakeSMA
Indicator

SnakeSMA

iMA

This indicator calculates a balanced moving average by applying weighted coefficients to price data symmetrically around the current period to reduce lag and signal noise.

snake_001
Indicator

snake_001

iMA

The indicator computes a weighted moving average by applying a linear distribution of importance to price points surrounding a central anchor, facilitating smoother trend identification.

Snake_v2
Indicator

Snake_v2

iMA

This indicator calculates a weighted average of price points based on their proximity to the current candle, utilizing a sliding window sum to generate a smoothed trend line.

Sonic_Ind_v1.0
Indicator

Sonic_Ind_v1.0

iACiAOiMAiStochastic

This indicator identifies market momentum by correlating Accelerator Oscillator and Stochastic crossovers with Laguerre-ACS1 thresholds, refined through optional SMA and RSI trend filters.

Sonic_StoIK
Indicator

Sonic_StoIK

iDeMarkeriForceiRSIiStochastic
Spectr
Indicator

Spectr

iMA

This indicator decomposes price action using linear regression and Fourier analysis to project multiple harmonic frequency waves over a moving average base.

Spectrometr_Separate
Indicator

Spectrometr_Separate

iMA

This indicator decomposes price action into fundamental cycles by applying a Fast Fourier Transform (FFT) to linear regression residuals to isolate dominant harmonic frequencies.

Spread_Hi_Lo_v1a
Indicator

Spread_Hi_Lo_v1a

iMA

This indicator provides a comprehensive real-time dashboard featuring dynamic price trends, daily high-low volatility, multi-timeframe analysis, and automated spread monitoring with visual color alerts.

Spyker
Indicator

Spyker

iMAiMAOnArray

Calculates the instantaneous spread between price extremes using a high-sensitivity exponential average paired with a long-term smoothed signal.

Squeeze Straddle
Indicator

Squeeze Straddle

iATRiMAiStdDev

The indicator identifies market equilibrium by calculating the ratio between standard deviation and Average True Range to detect low-volatility squeeze zones.

Squeeze_Break
Indicator

Squeeze_Break

iATRiMACDiADXiRSI

This indicator identifies potential market breakouts by detecting when Bollinger Bands expand beyond Keltner Channels, filtered by Momentum to confirm trend bias.

Squeeze_Break_v1
Indicator

Squeeze_Break_v1

iATRiMACDiADXiRSI

This system identifies trend reversals by detecting periods of low volatility via Bollinger Band and Keltner Channel convergence, triggering alerts when price momentum confirms an expansion into a high-volatility state.

squeeze_ra
Indicator

squeeze_ra

iATRiMAiStdDev

This indicator identifies periods of market contraction using Bollinger and Keltner Band crossovers, while visualizing smoothed momentum shifts through a linear regression-based histogram.

Squize_MA
Indicator

Squize_MA

iMA

This indicator identifies market compression by merging dual moving averages into a singular node whenever their absolute point distance falls below a specific threshold.

Indicator

Squize_MA_mtf

iMA
SSL channel chart
Indicator

SSL channel chart

iATRiMA

This indicator detects trend shifts by monitoring price crossovers against dual Simple Moving Averages of high and low prices, dynamically flipping the upper and lower boundary lines based on the prevailing momentum.

SSL
Indicator

SSL

iMA

The indicator identifies trend persistence by dynamically switching between high and low price moving averages based on whether the current close breaches preceding SMA boundaries.

SSL_channel_chartA
Indicator

SSL_channel_chartA

iMA

This indicator identifies trend shifts by monitoring price breaches of dual Simple Moving Average envelopes based on high and low price extremes.

SSL_channel_chartVar_alert
Indicator

SSL_channel_chartVar_alert

iMA

This indicator identifies directional momentum by comparing price action against high and low moving average boundaries to plot a responsive trend channel.

SSL_channel_chart_alert
Indicator

SSL_channel_chart_alert

iMA

The indicator identifies trend shifts by comparing closing prices against SMA boundaries of historical highs and lows to dynamically swap upper and lower channel limits.

Indicator

SSL_channel_chart_alert_mtf

iMA
SSL_channel_chart_LnSig_alert
Indicator

SSL_channel_chart_LnSig_alert

iATRiMA

This indicator identifies trend reversals by dynamically flipping between high and low Simple Moving Average boundaries based on price breaches to create a reactive volatility channel.

SSL_channel_chart_varBLnSig_alert
Indicator

SSL_channel_chart_varBLnSig_alert

iATRiMA

The algorithm identifies directional shifts by comparing closing prices against high and low moving average boundaries to flip a dual-channel structure based on prevailing momentum.

SSL_channel_chart_varLnSig_alert
Indicator

SSL_channel_chart_varLnSig_alert

iATRiMA

The algorithm identifies trend shifts by monitoring price breakouts against dynamic moving average corridors, flipping boundary orientations based on high/low price breaches.

SSL_fast
Indicator

SSL_fast

iMA

This indicator identifies trend shifts by comparing current closing prices against a rolling simple moving average of the high and low price extremes.

SSL_fastA
Indicator

SSL_fastA

iMA

This indicator identifies trend shifts by comparing closing prices against a dual-mode Simple Moving Average calculated from high and low price extremes.

Indicator

SSL_fast_mtf

iMA
Indicator

SSL_fast_sBar_alert_mtf

iMA
Indicator

SSL_fast_sBar_alert_mtf_v1

iMA
Indicator

SSL_fast_sBar_mtf

iMA
Indicator

SSL_fast_sBar_mtf_v1

iMA
Indicator

SSL_fill_channel_chart_alert_mtf

iMA
Indicator

SSL_KaleOrg_mtf

iMA
Indicator

SSL_sBar_KaleOrg_sw_mtf

iMA
SSL_v2
Indicator

SSL_v2

iMA

The indicator dynamically switches between SMA high and low price averages based on price breakouts to delineate trend-sensitive volatility zones.

SSRC
Indicator

SSRC

iMA

This indicator quantifies monotonic trends by calculating the Spearman Rank Correlation coefficient based on a smoothed Martingale-style price axis.