SSRC_Alert
Indicator

SSRC_Alert

iMA

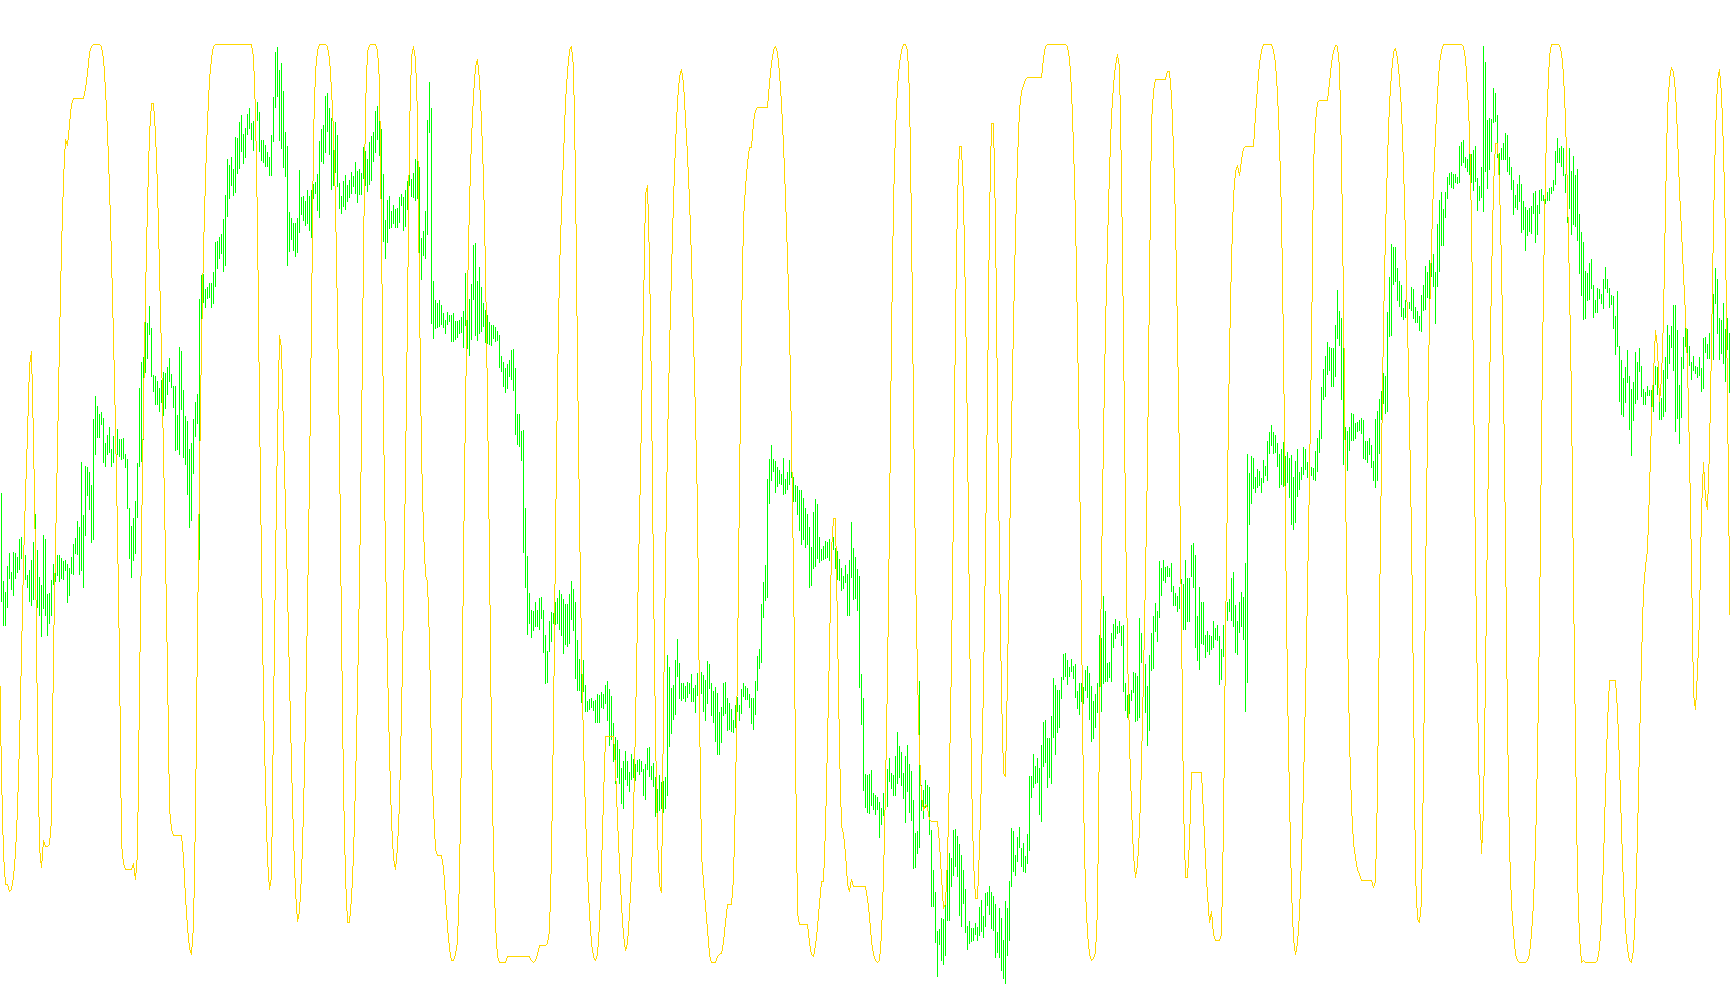
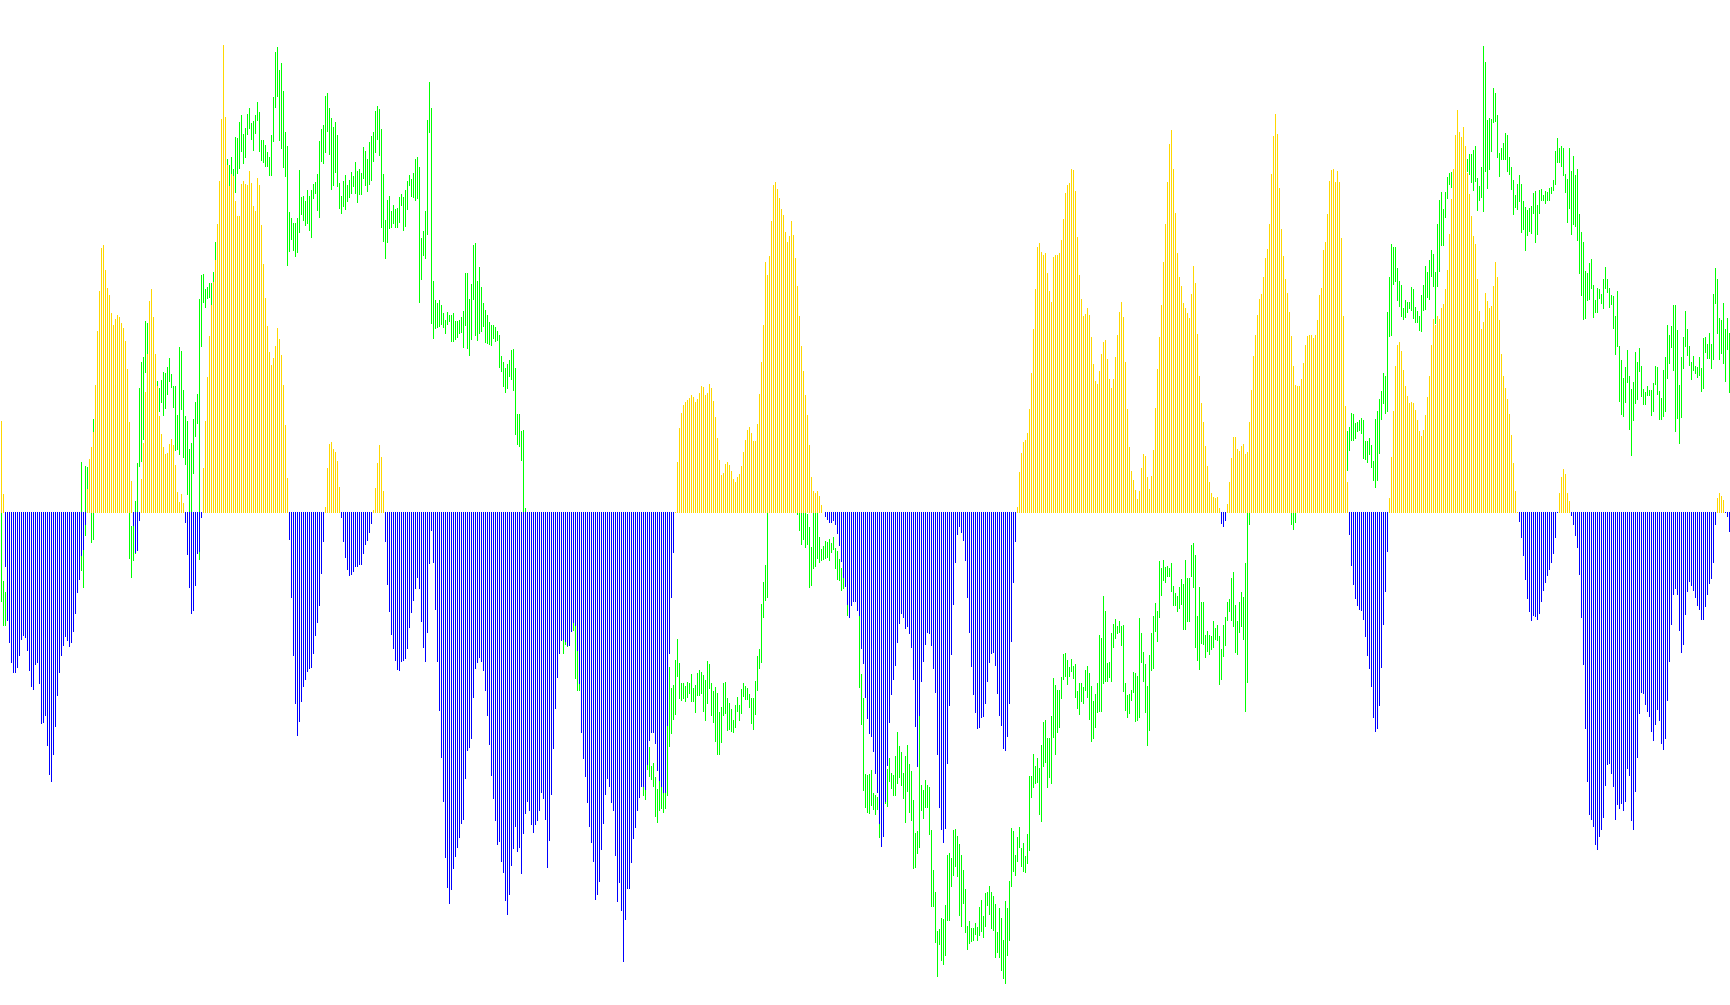
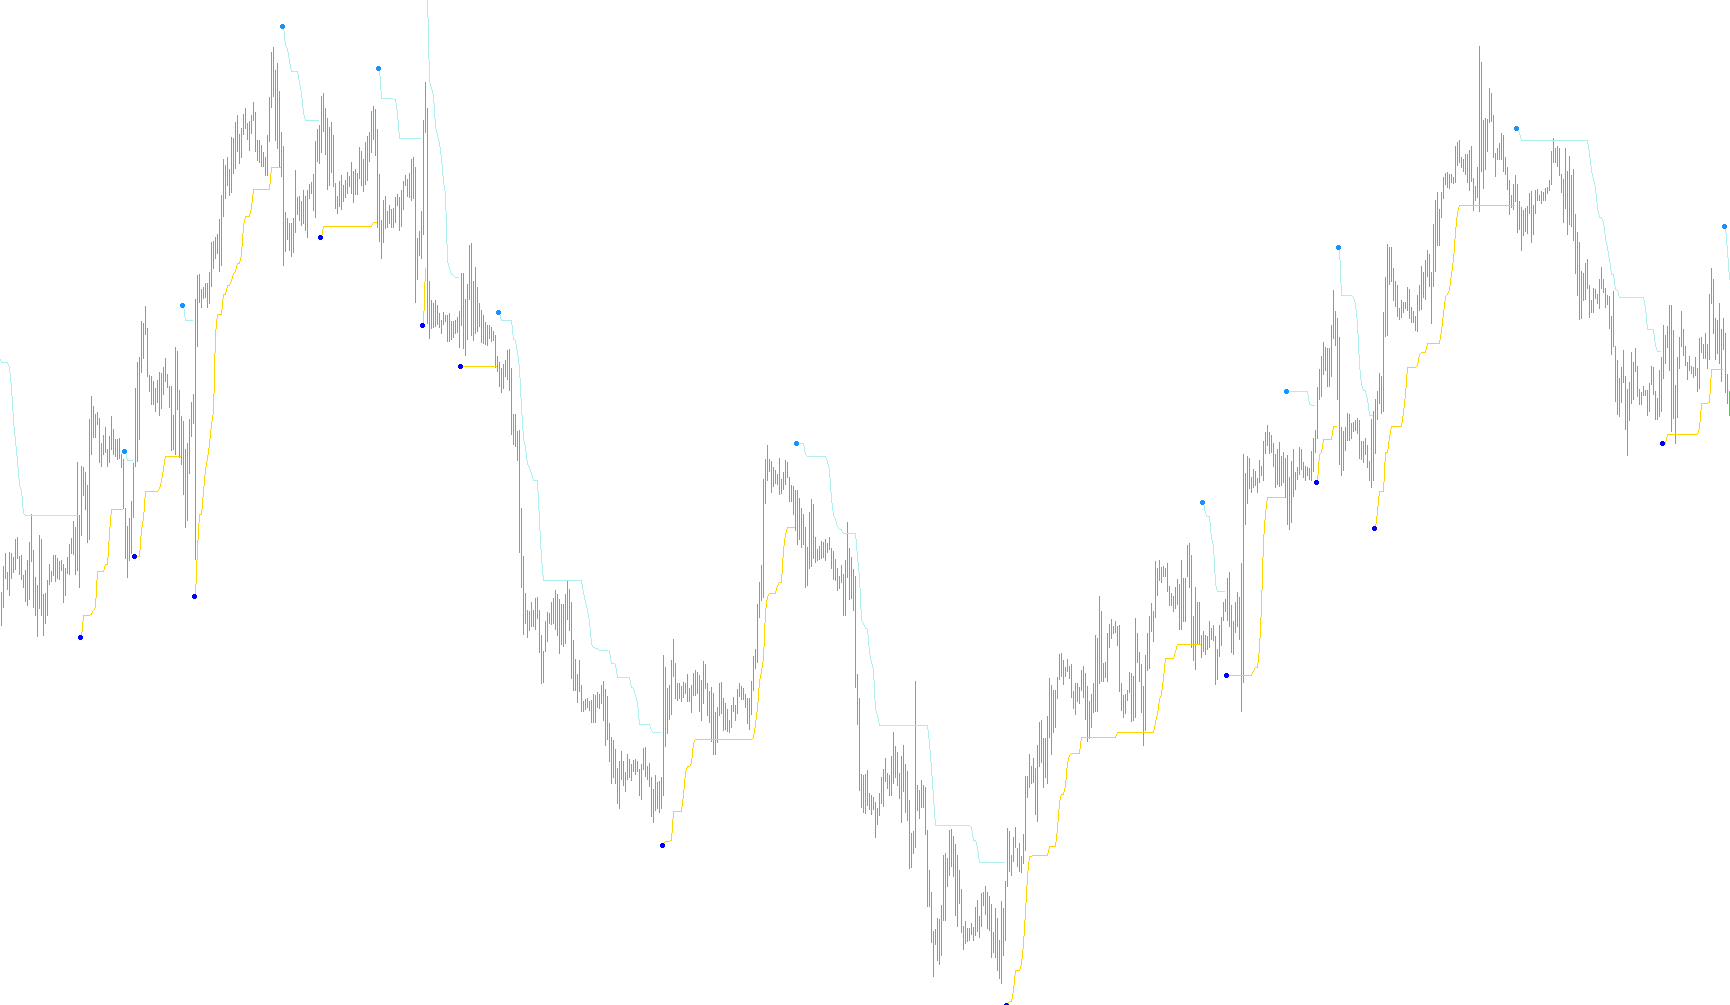
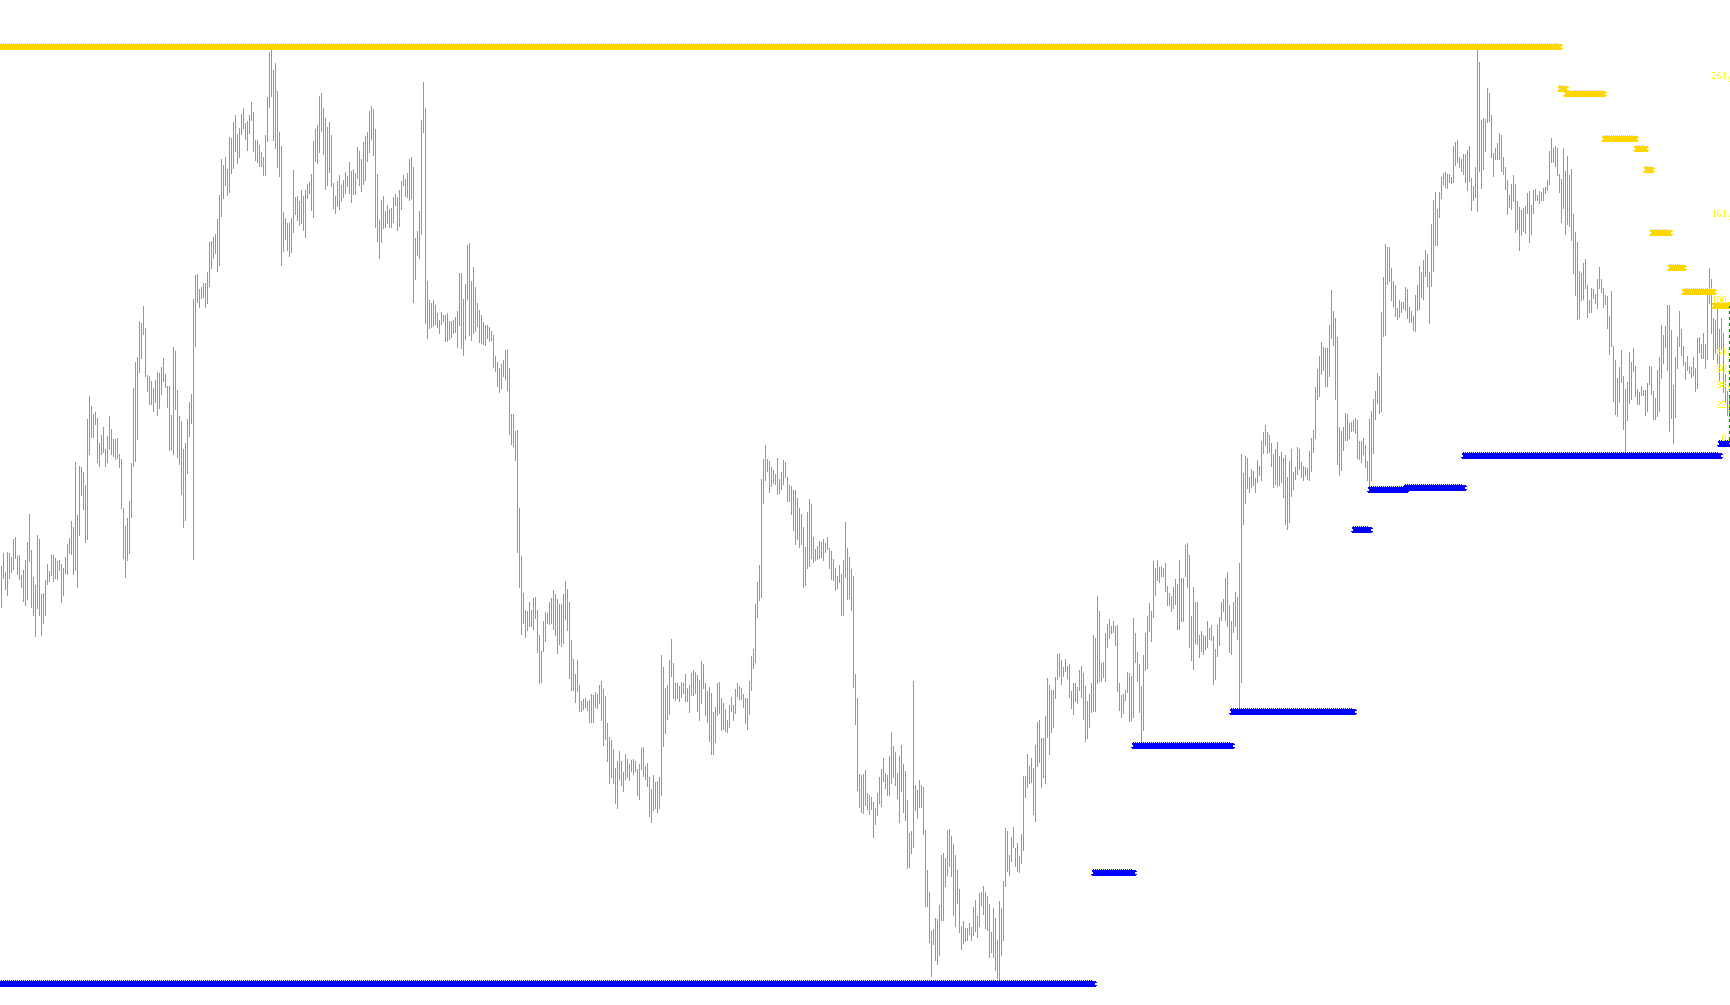
This indicator quantifies the monotonic relationship between price dynamics and adjusted moving averages using Spearman Rank Correlation to identify trend exhaustion and reversal points.

SSRC_Alert_001
Indicator

SSRC_Alert_001

iMA

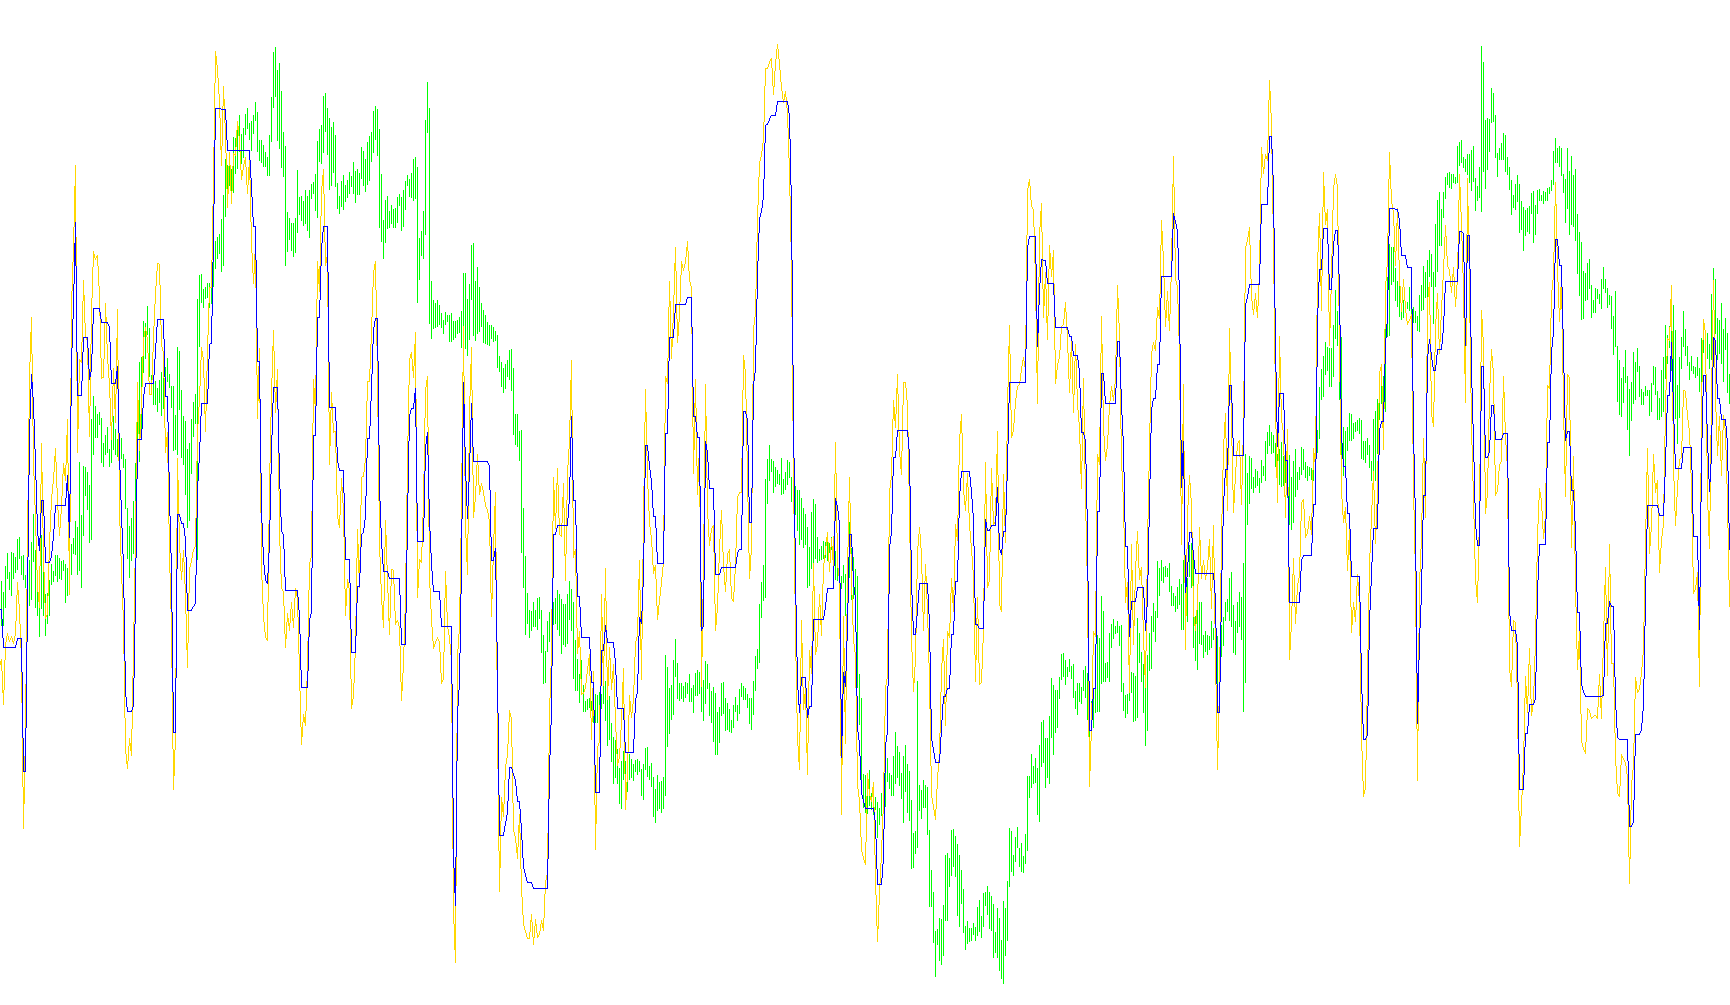
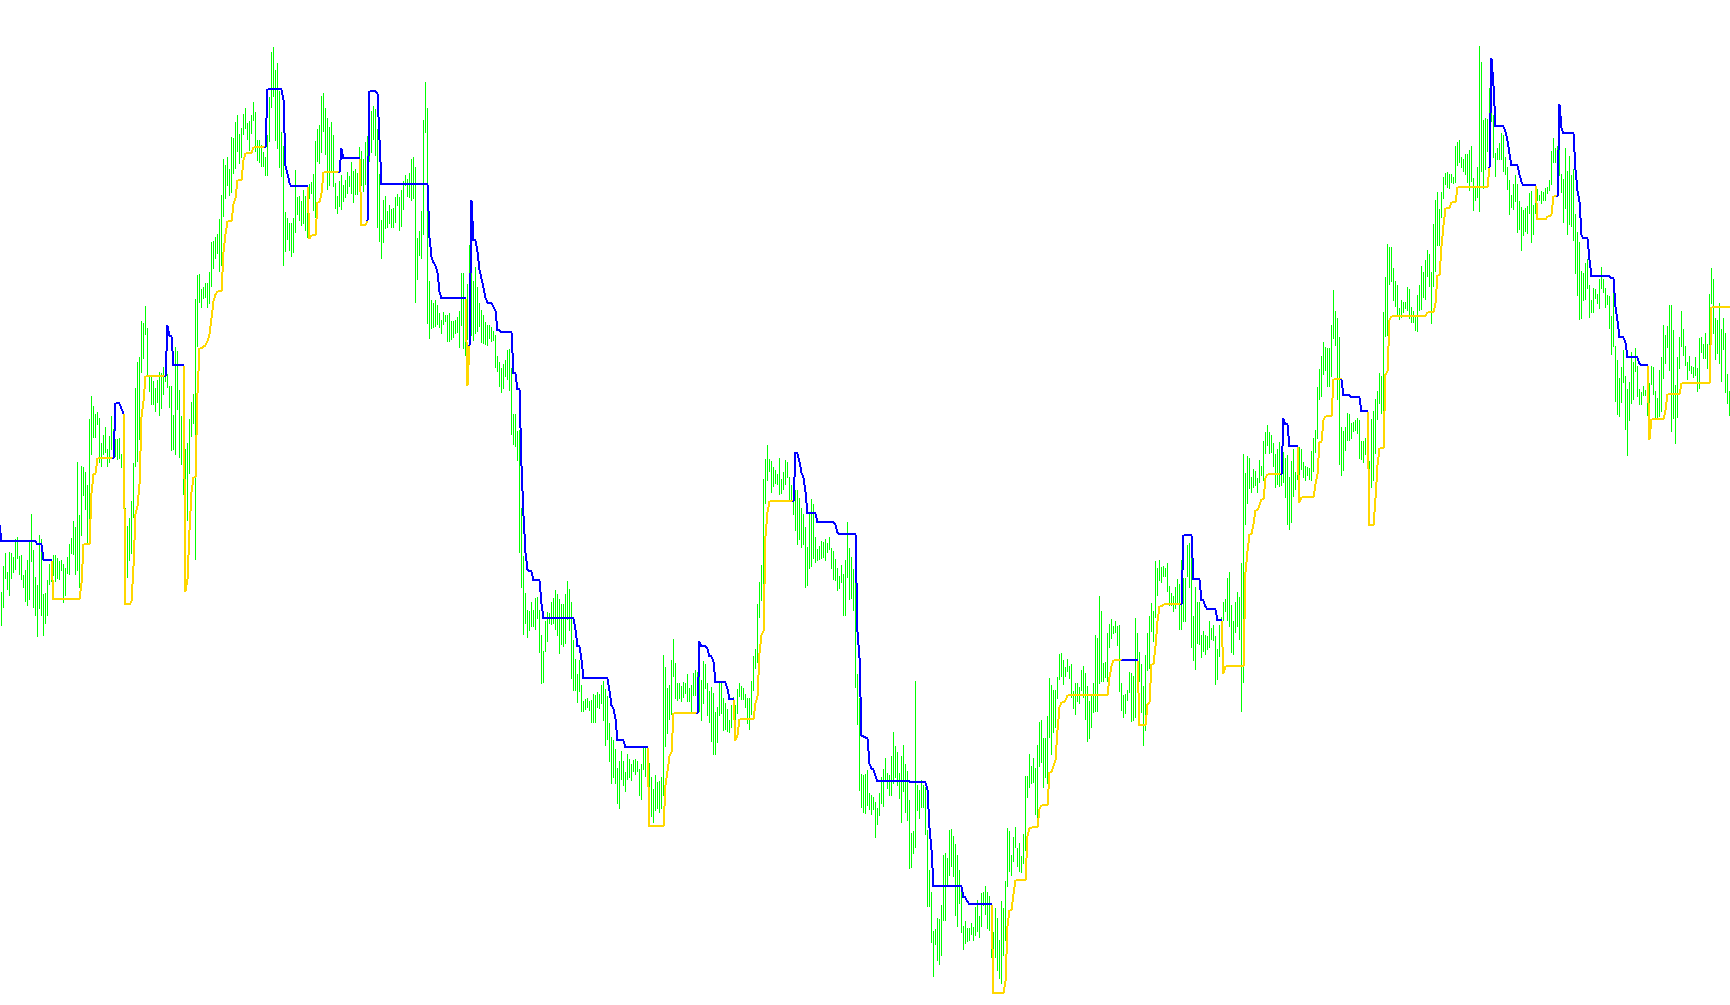
This indicator quantifies non-linear price momentum by calculating the Spearman correlation coefficient between a weighted 'Snake' moving average and a smoothed Martingale axis.

Stalin
Indicator

Stalin

iMAiRSI

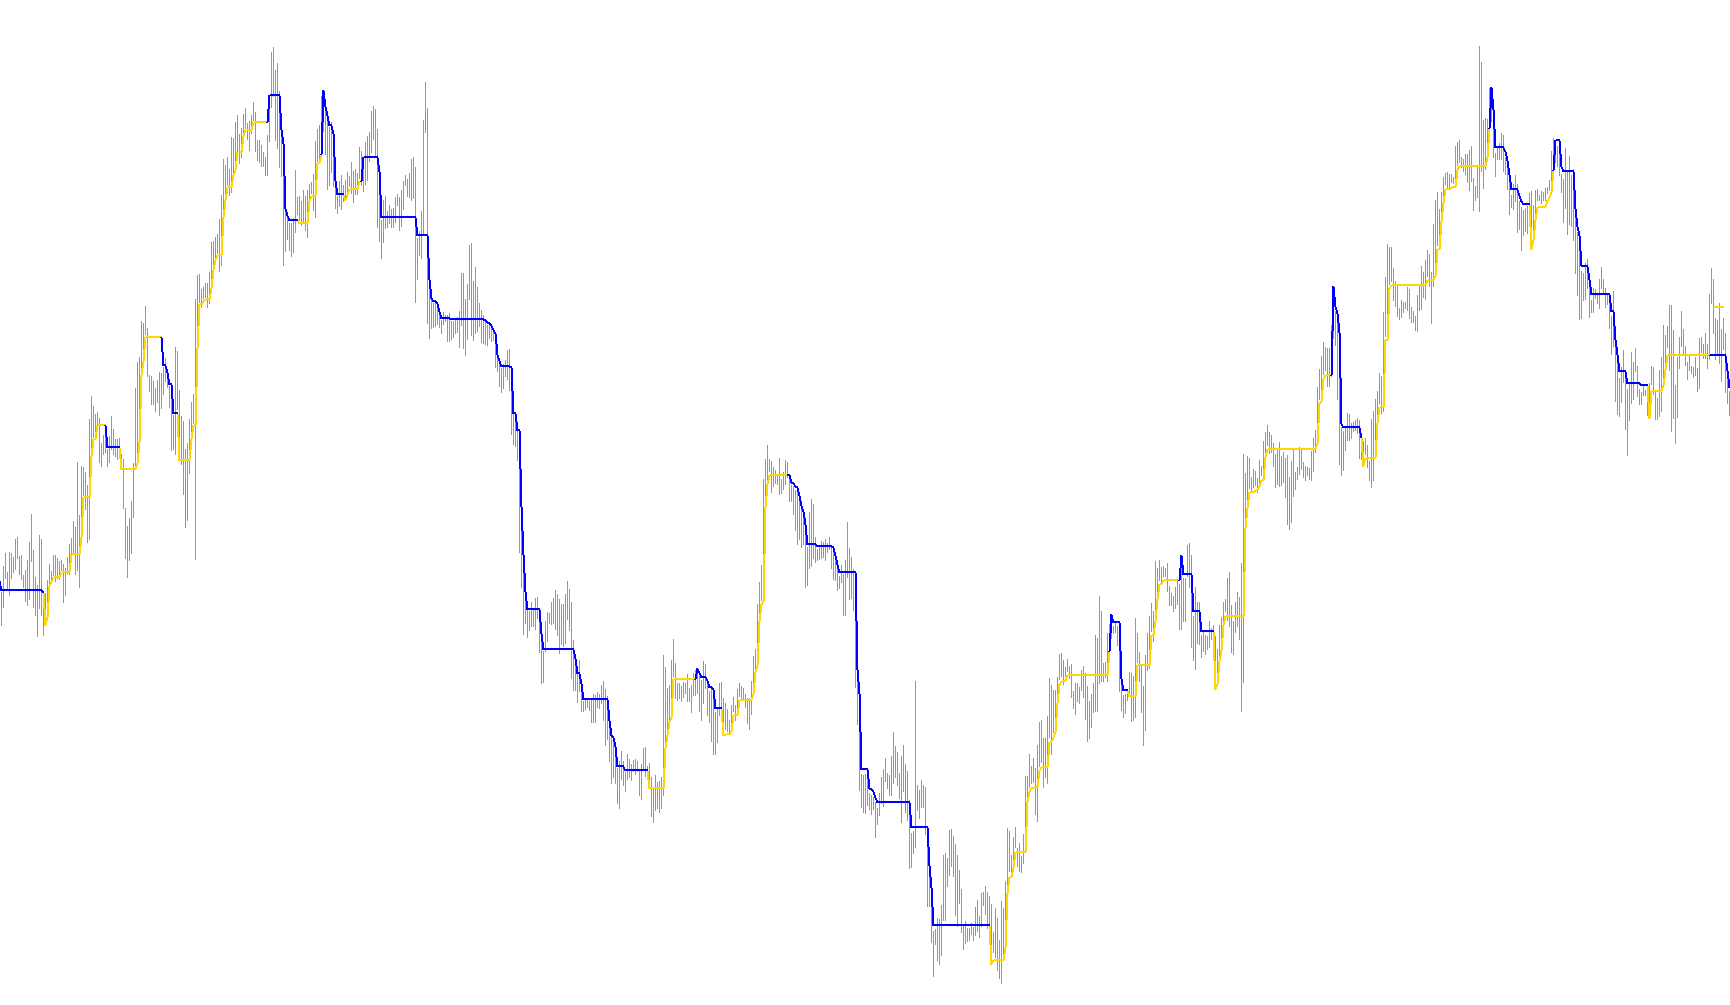
This indicator identifies trend reversals by detecting crossovers between fast and slow moving averages filtered through RSI momentum thresholds and price action confirmation.

STARC Bands
Indicator

STARC Bands

iATRiMA

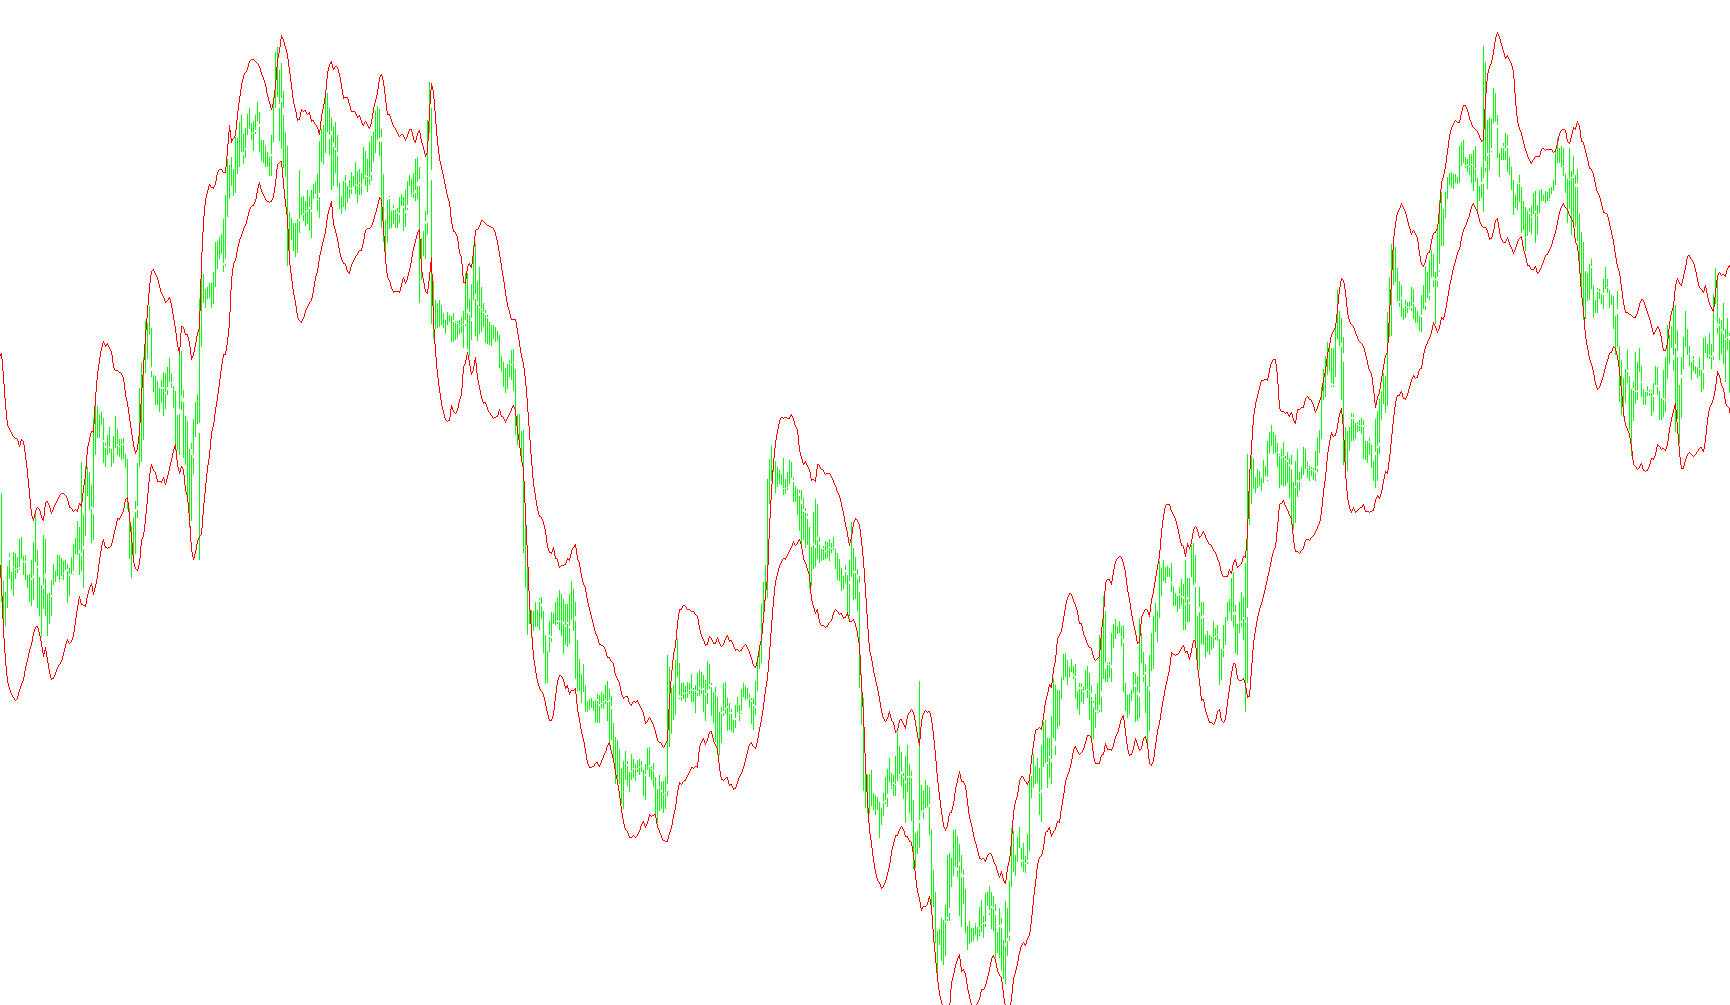
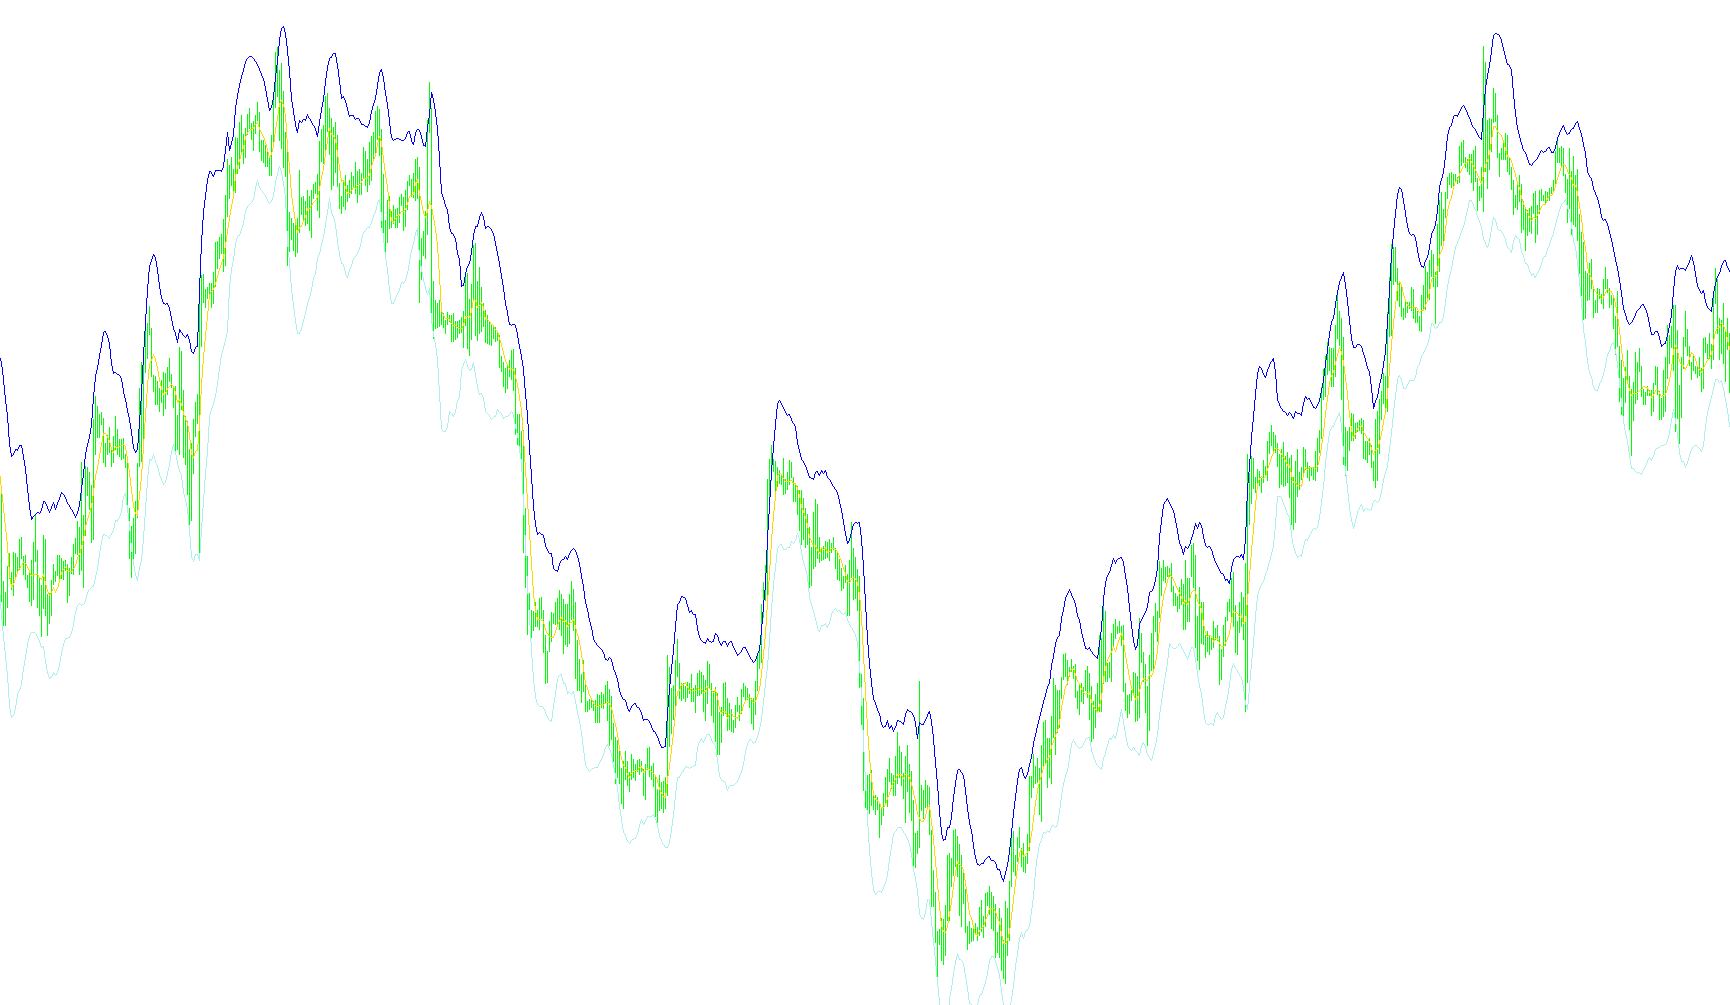
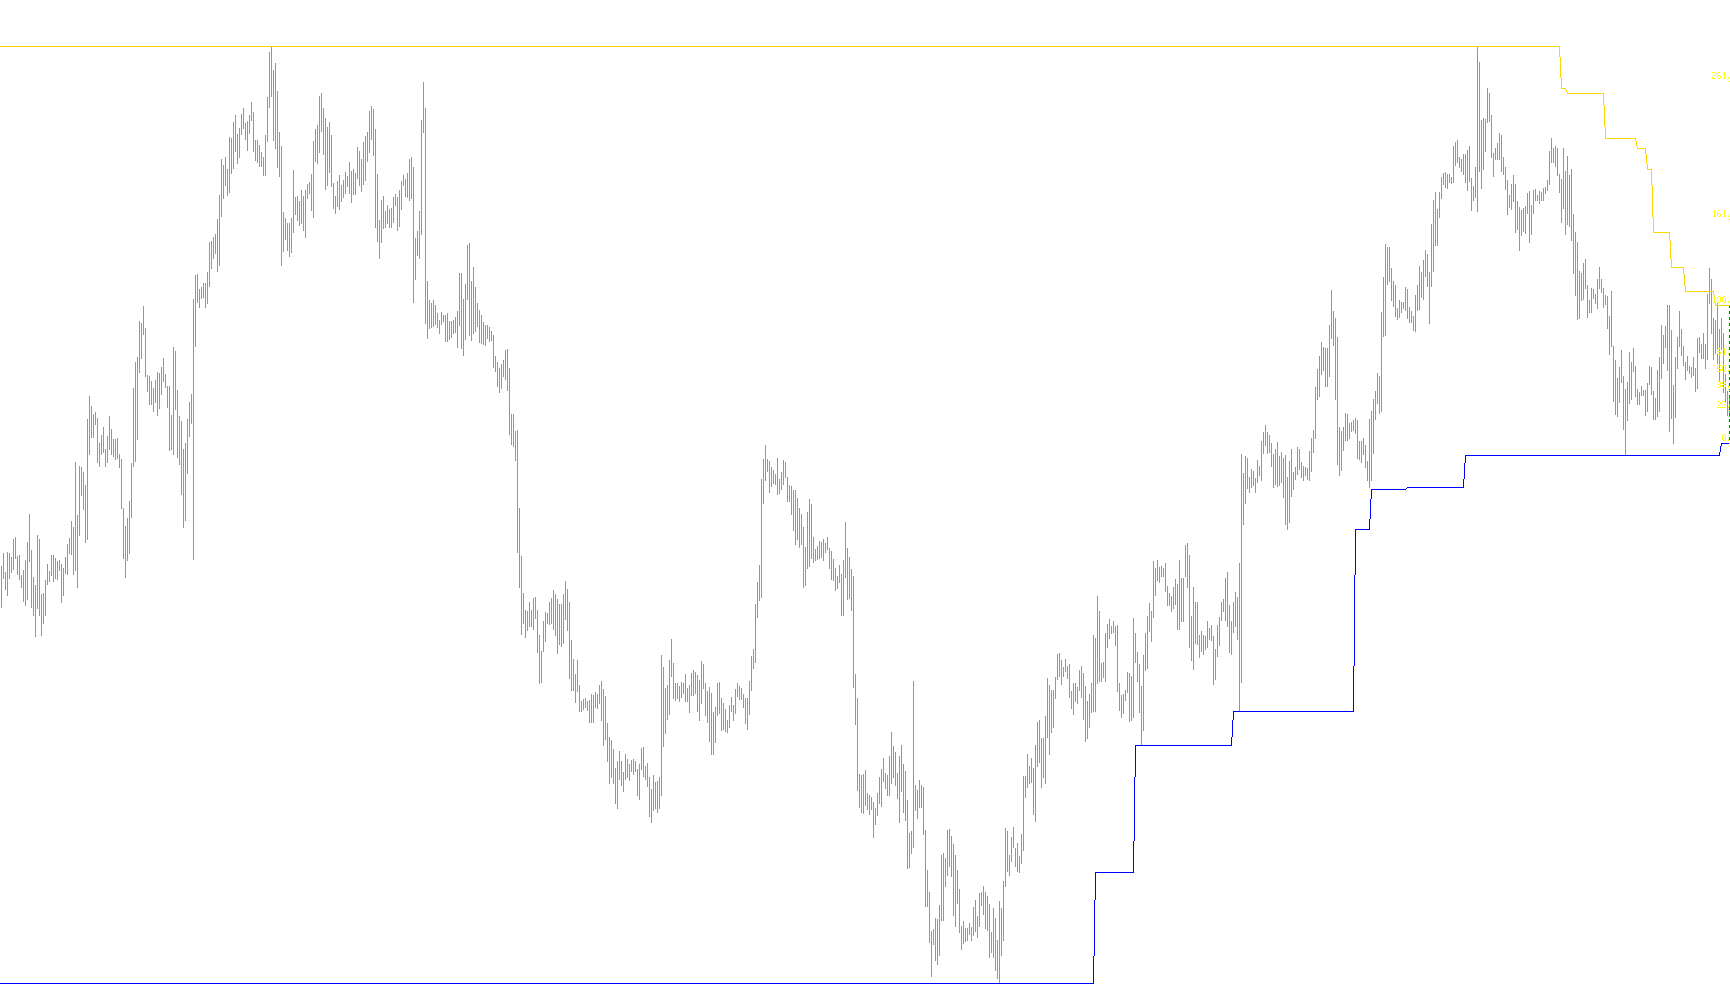
This indicator calculates a central Exponential Moving Average and projects dynamic upper and lower boundaries based on a multiple of the Average True Range.

STARC Bands_v1
Indicator

STARC Bands_v1

iATRiMA

This indicator constructs a dynamic price envelope by superimposing a constant multiplier of the Average True Range onto an Exponential Moving Average baseline.

STARC Bands_v2
Indicator

STARC Bands_v2

iATRiMA

This indicator constructs a dynamic trading channel by overlaying an Exponential Moving Average with upper and lower boundaries derived from a multiple of the Average True Range.

STARC Bands_v3
Indicator

STARC Bands_v3

iATRiMA

This indicator generates a dynamic volatility channel by projecting an exponential moving average through a multiplier of the Average True Range.

StarcBands
Indicator

StarcBands

iATRiMA

This indicator projects dynamic price boundaries by calculating a Simple Moving Average and offsetting it using a multiplier of the Average True Range to measure localized market turbulence.

Indicator

STC_Plot_dcec

iMA
StdDev
Indicator

StdDev

iMA

This indicator quantifies market price variance by calculating the square root of the average squared deviations from a moving mean over a specified timeframe.

StdDivBands
Indicator

StdDivBands

iMA

This indicator projects dynamic price corridors by calculating the mathematical variance from a moving average to identify extreme expansion and contraction zones.

Stealth
Indicator

Stealth

iMA

This indicator identifies trend momentum by mapping price breaches against dynamic Simple Moving Average boundaries and calculated Linear Signal Momentum weights.

StepFisher_v1[1].1
Indicator

StepFisher_v1[1].1

iATRiMA

This indicator synthesizes a dual-layered momentum system by applying a logarithmic Fisher Transform to a normalized stochastic value derived from ATR-based volatility steps and price trend breakouts.

StepFisher_v2
Indicator

StepFisher_v2

iATRiMA

This indicator utilizes an ATR-based step logic to define trend boundaries and applies a logarithmic smoothing transformation to the resulting momentum values.

StepMA_sashken_v2
Indicator

StepMA_sashken_v2

iMA

This indicator identifies trend reversals by monitoring discrete price level breaches between two multi-layered moving average step thresholds.

StepMA_sashken_v4
Indicator

StepMA_sashken_v4

iMAiMAOnArray

This indicator identifies momentum shifts by calculating stepped price envelopes around a moving average to filter out market noise and detect structural trend reversals.

StepMA_v7a
Indicator

StepMA_v7a

iMA

This indicator utilizes Keltner Channel logic and volatility-adjusted step calculations to create a responsive trend-following moving average that identifies structural price shifts.

StepMA_v7a_v1
Indicator

StepMA_v7a_v1

iMA

This indicator calculates a staircase-style moving average by dynamically adjusting step sizes based on Keltner Channel volatility and price position relative to the range.

StepRSI_v5.2
Indicator

StepRSI_v5.2

iMAiRSI

This indicator applies a staircase-style quantization to relative strength values, identifying significant structural shifts in price velocity while filtering out minor volatility noise.

StepRSI_v5.2_v1
Indicator

StepRSI_v5.2_v1

iMAiRSI

This indicator synthesizes Relative Strength Index calculations with a step-based trend filter to identify discrete structural shifts in price momentum.

StepRSI_v5.2_v2
Indicator

StepRSI_v5.2_v2

iMAiRSI

This indicator quantifies momentum relative strength and applies a stepped volatility buffer to isolate significant trend reversals from minor price fluctuations.

stepupdown
Indicator

stepupdown

iMA

This indicator identifies potential reversal points by comparing current price action against the highest high and lowest low within a rolling seven-period window.

StochasticOnChart
Indicator

StochasticOnChart

iMAiStochastic

This indicator projects a momentum-adjusted Stochastic Oscillator onto the price chart by shifting it relative to an Exponential Moving Average (EMA) baseline while identifying trend reversals via visual arrow signals.

StochCandles
Indicator

StochCandles

iMAiStochastic

This indicator dynamically adjusts candlestick colors based on Stochastic Oscillator thresholds and crossover dynamics, incorporating optional Heiken Ashi smoothing.

Stoch_Strike(AM)_SW
Indicator

Stoch_Strike(AM)_SW

iMAiStochastic

This indicator synthesizes a dual-moving average MACD histogram with stochastic oscillator crossovers to identify momentum shifts and trend reversals.

sto_AllStochastics_v2_mtf
Indicator

sto_AllStochastics_v2_mtf

iMA

This indicator calculates a stochastic value based on relative price positioning and applies an extensive suite of eighteen distinct moving average algorithms to smooth the main line and signal.

StrangeIndicator
Indicator

StrangeIndicator

iMA

This indicator normalizes the position of the closing price relative to the spread between the high and low exponential moving averages.

StrangeIndicator_v1
Indicator

StrangeIndicator_v1

iMA

This indicator calculates a percentage-based value representing the distance of the closing price relative to the range between the high and low Exponential Moving Averages.

StrangeIndicator_v2
Indicator

StrangeIndicator_v2

iMA

The logic calculates a normalized percentage representing the distance of the exponential moving average of closing prices relative to the range between the high and low exponential moving averages.

StrategyIndi_1.0
Indicator

StrategyIndi_1.0

iATRiMA

This logic executes trades based on the convergence of three moving averages and price action momentum, utilizing a dynamic ATR-based trailing stop-loss for automated risk management.

st_ind_2
Indicator

st_ind_2

iMA

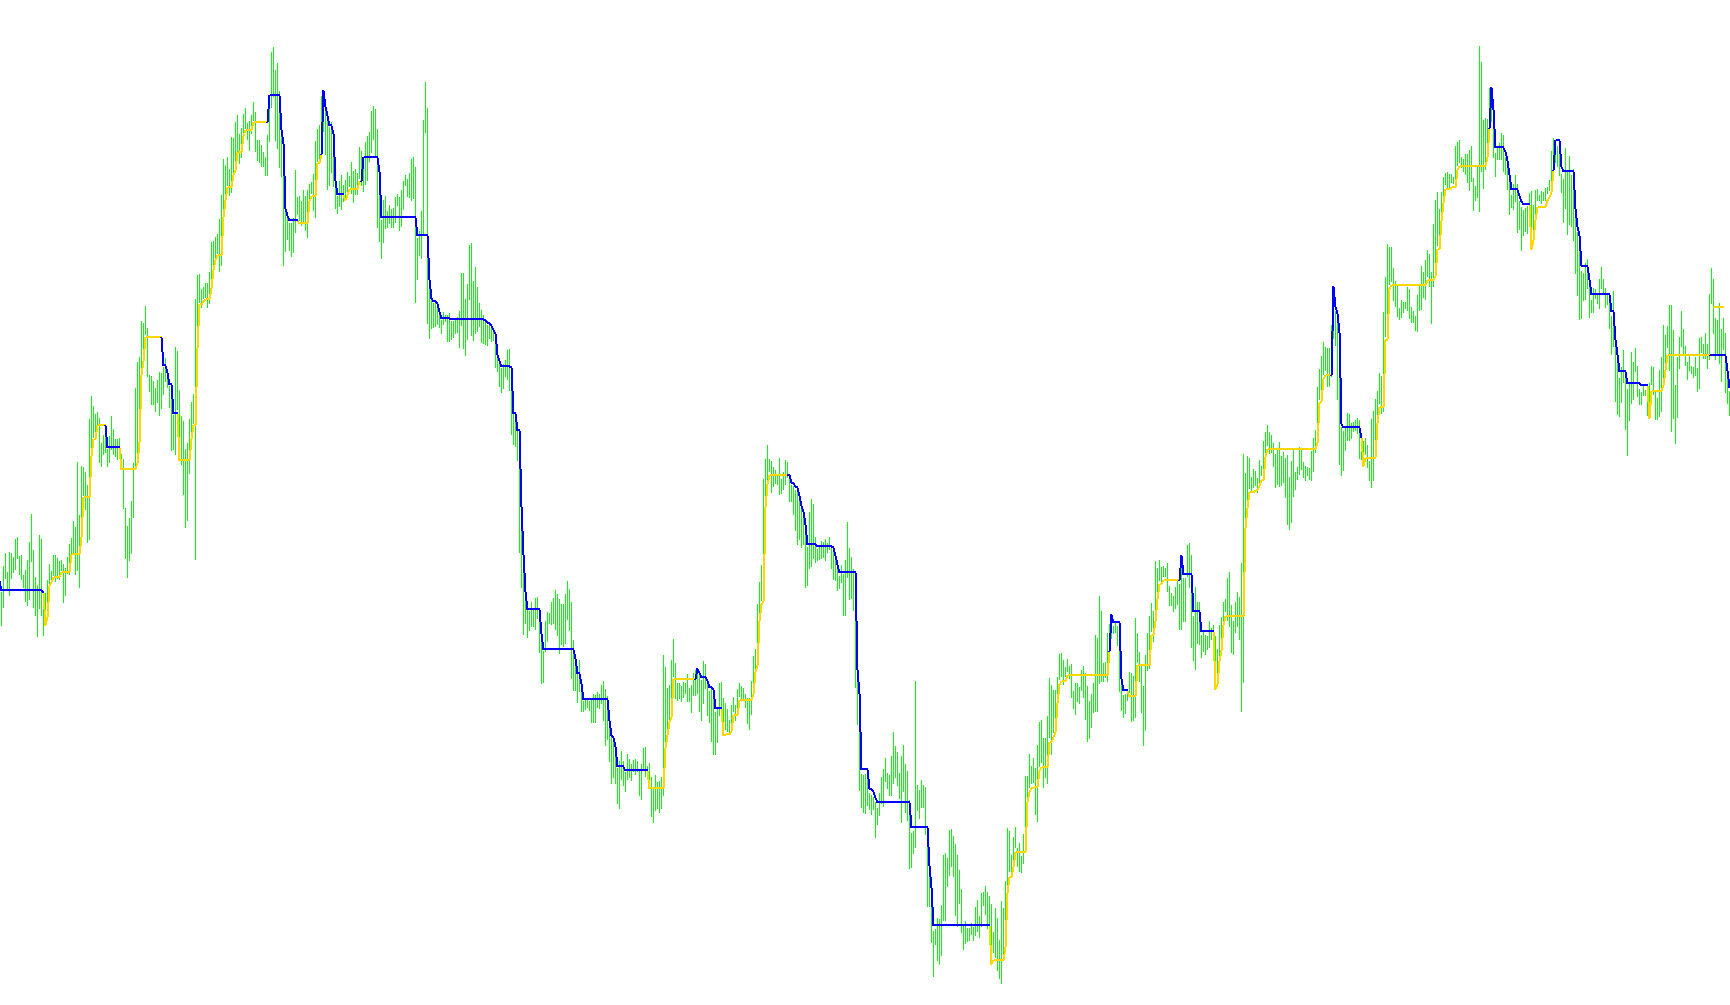
This indicator identifies trend exhaustion by detecting directional shifts in a Linear Weighted Moving Average and visualizes active trade states with dynamic arrow markers.
st_ind_2x
Indicator

st_ind_2x

iMA

This indicator identifies potential trend shifts by detecting directional changes in the slope of a Linear Weighted Moving Average.

st_ind_2x_v1
Indicator

st_ind_2x_v1

iMA

This indicator identifies trend exhaustion and reversal points by detecting instantaneous shifts in the slope of a Linear Weighted Moving Average.

st_ind_2_v1
Indicator

st_ind_2_v1

iMA

This indicator identifies trend exhaustion by detecting divergences between the current price action and the Linear Weighted Moving Average while overlaying visual markers for active trade monitoring.

subway
Indicator

subway

iMA

This indicator projects symmetrical Fibonacci extension levels based on multi-period Exponential Moving Averages to identify potential price reversal zones.

SuperTrend nrp new MTF
Indicator

SuperTrend nrp new MTF

iATRiMA

This indicator identifies structural market direction by calculating a trailing volatility band based on the product of Average True Range and a user-defined multiplier applied to the median price.

SuperTrend nrp new
Indicator

SuperTrend nrp new

iATRiMA

This indicator identifies prevailing market momentum by calculating a trailing boundary based on the product of price midpoint and Average True Range, while filtering out false breakouts through recursive directionality checks.

SuperTrend volty like
Indicator

SuperTrend volty like

iATRiMA

This indicator identifies market bias by dynamically adjusting trailing support and resistance levels based on ATR-weighted price volatility.

SuperTrend_3
Indicator

SuperTrend_3

iATRiMA

This indicator identifies market direction by comparing smoothed Simple Moving Averages and projects volatility-adjusted support and resistance bands using Average True Range.

SuperTrend_32
Indicator

SuperTrend_32

iATRiMA

This indicator identifies market direction by comparing dual Exponential Moving Averages and establishing dynamic support/resistance levels based on Average True Range volatility.

SuperTrend_32_001
Indicator

SuperTrend_32_001

iATRiMA

This indicator identifies directional shifts by comparing two exponentially smoothed moving averages and projects a trailing boundary based on average true range volatility.

Support and Resistance WITH FIBONACCI  LA
Indicator

Support and Resistance WITH FIBONACCI LA

iMA

This indicator identifies structural price extremes by detecting momentum shifts relative to a Simple Moving Average and dynamically projecting Fibonacci-style zones between local highs and lows.

Support and Resistance WITH FIBONACCI  LA    _001
Indicator

Support and Resistance WITH FIBONACCI LA _001

iMA

This indicator identifies structural price levels by detecting Moving Average crossovers and dynamically projects Fibonacci retracement zones based on historical high and low extremes.

Support and Resistance_v1
Indicator

Support and Resistance_v1

iMA

Identifies historical price extremes by detecting SMA crossover events and projects Fibonacci-based zones between detected support and resistance levels.

SVE_RSI_I-Fish
Indicator

SVE_RSI_I-Fish

iMAiMAOnArrayiRSIOnArray

This indicator applies a multi-layered weighted moving average to price data before calculating a smoothed Relative Strength Index and converting it via an exponential transformation to identify non-linear momentum shifts.

SVM_train_v01
Indicator

SVM_train_v01

iMA

This indicator utilizes a Support Vector Machine (SVM) machine learning model to process historical price action data and generate predictive output signals based on pre-defined risk parameters.

SVM_train_v02
Indicator

SVM_train_v02

iMA

This indicator leverages a Support Vector Machine (SVM) architecture to train on historical price action data and project future movement probabilities based on predefined risk parameters.

SVS_Oscillator
Indicator

SVS_Oscillator

iMA

This indicator utilizes weighted moving averages across stratified periods to calculate differential momentum values, identifying trend divergences and structural shifts via multi-buffer histogram visualization.

svs_trend
Indicator

svs_trend

iMA

The algorithm calculates and visualizes the divergence between dual-period weighted moving averages through recursive summation and variance offsets.

syminfo
Indicator

syminfo

iMA

This indicator visualizes real-time bullish or bearish sentiment for a 5x5 matrix of currency pairs by comparing three distinct moving average alignments.