ShortTermMomentumTrading
Indicator

ShortTermMomentumTrading

iCCIiADXiMA

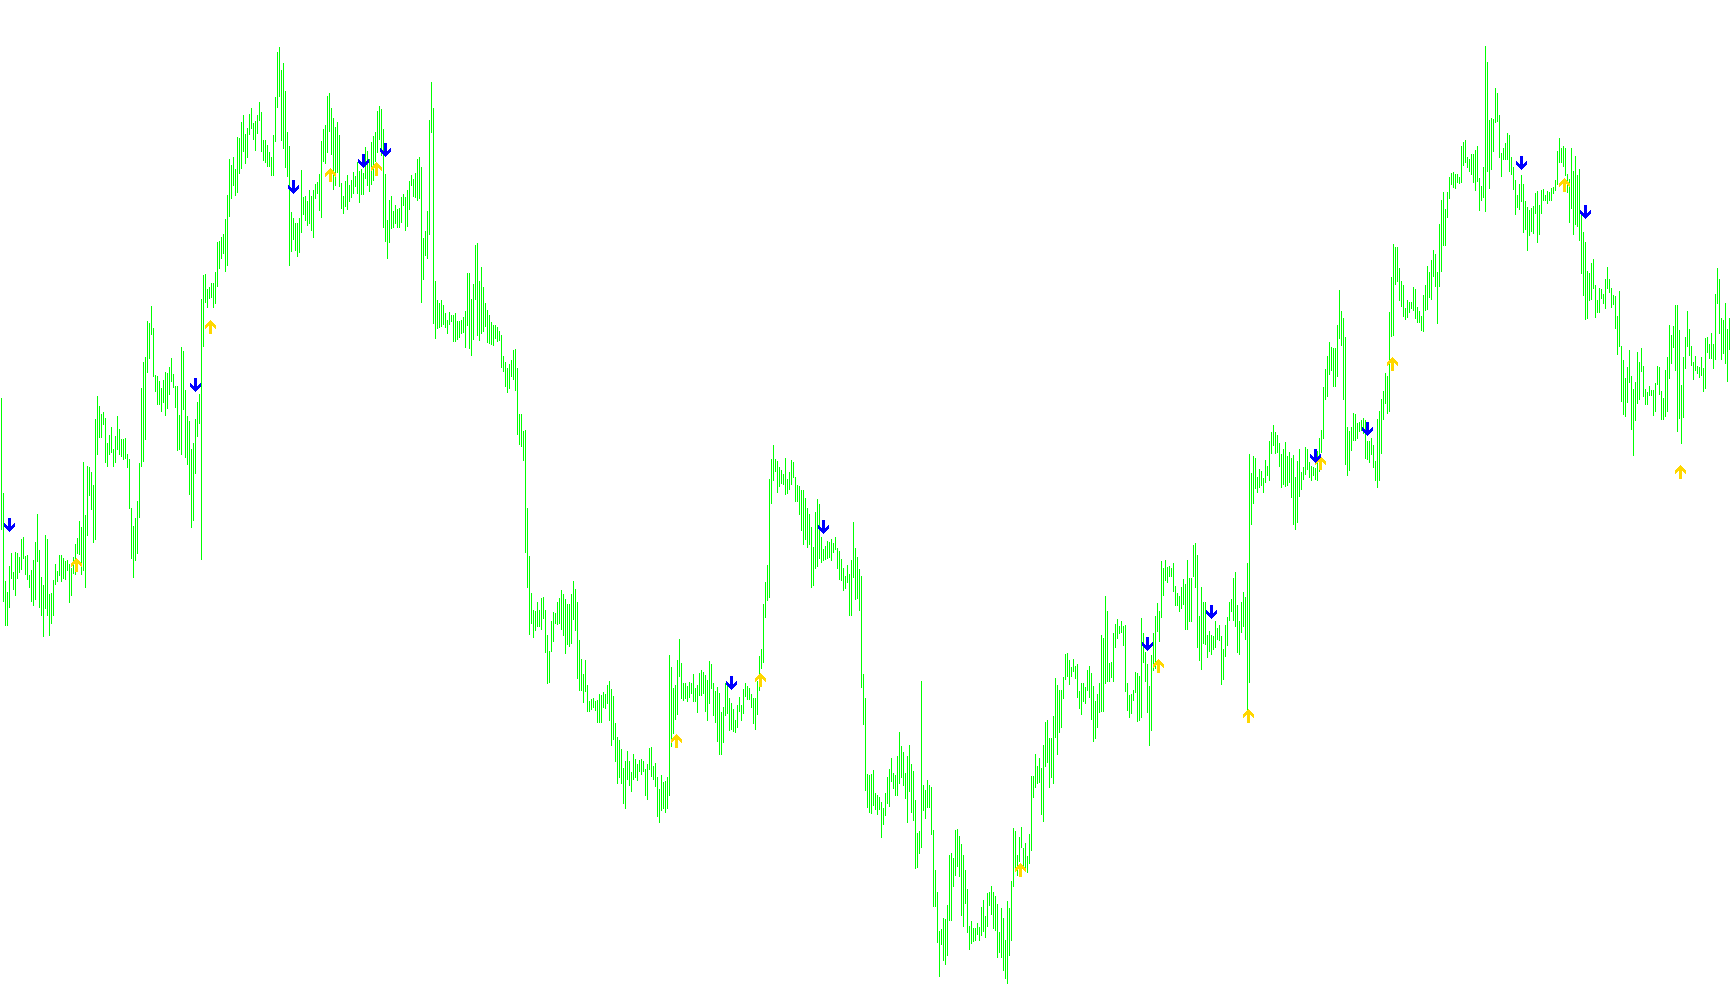
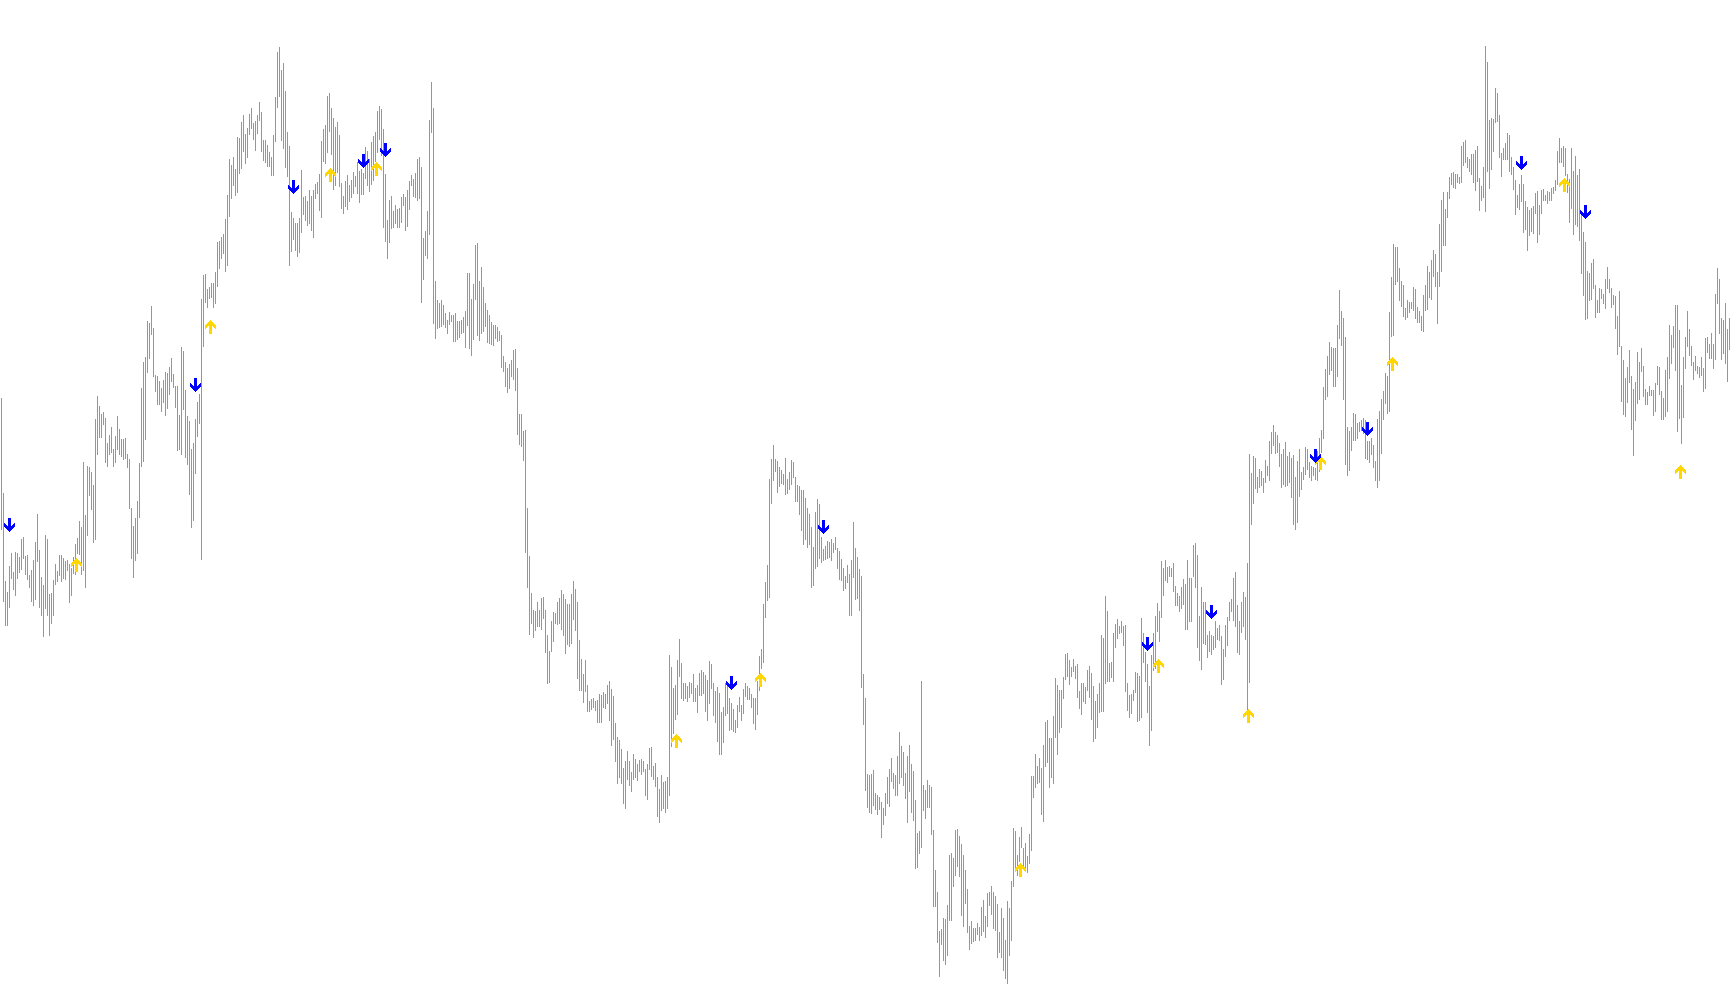
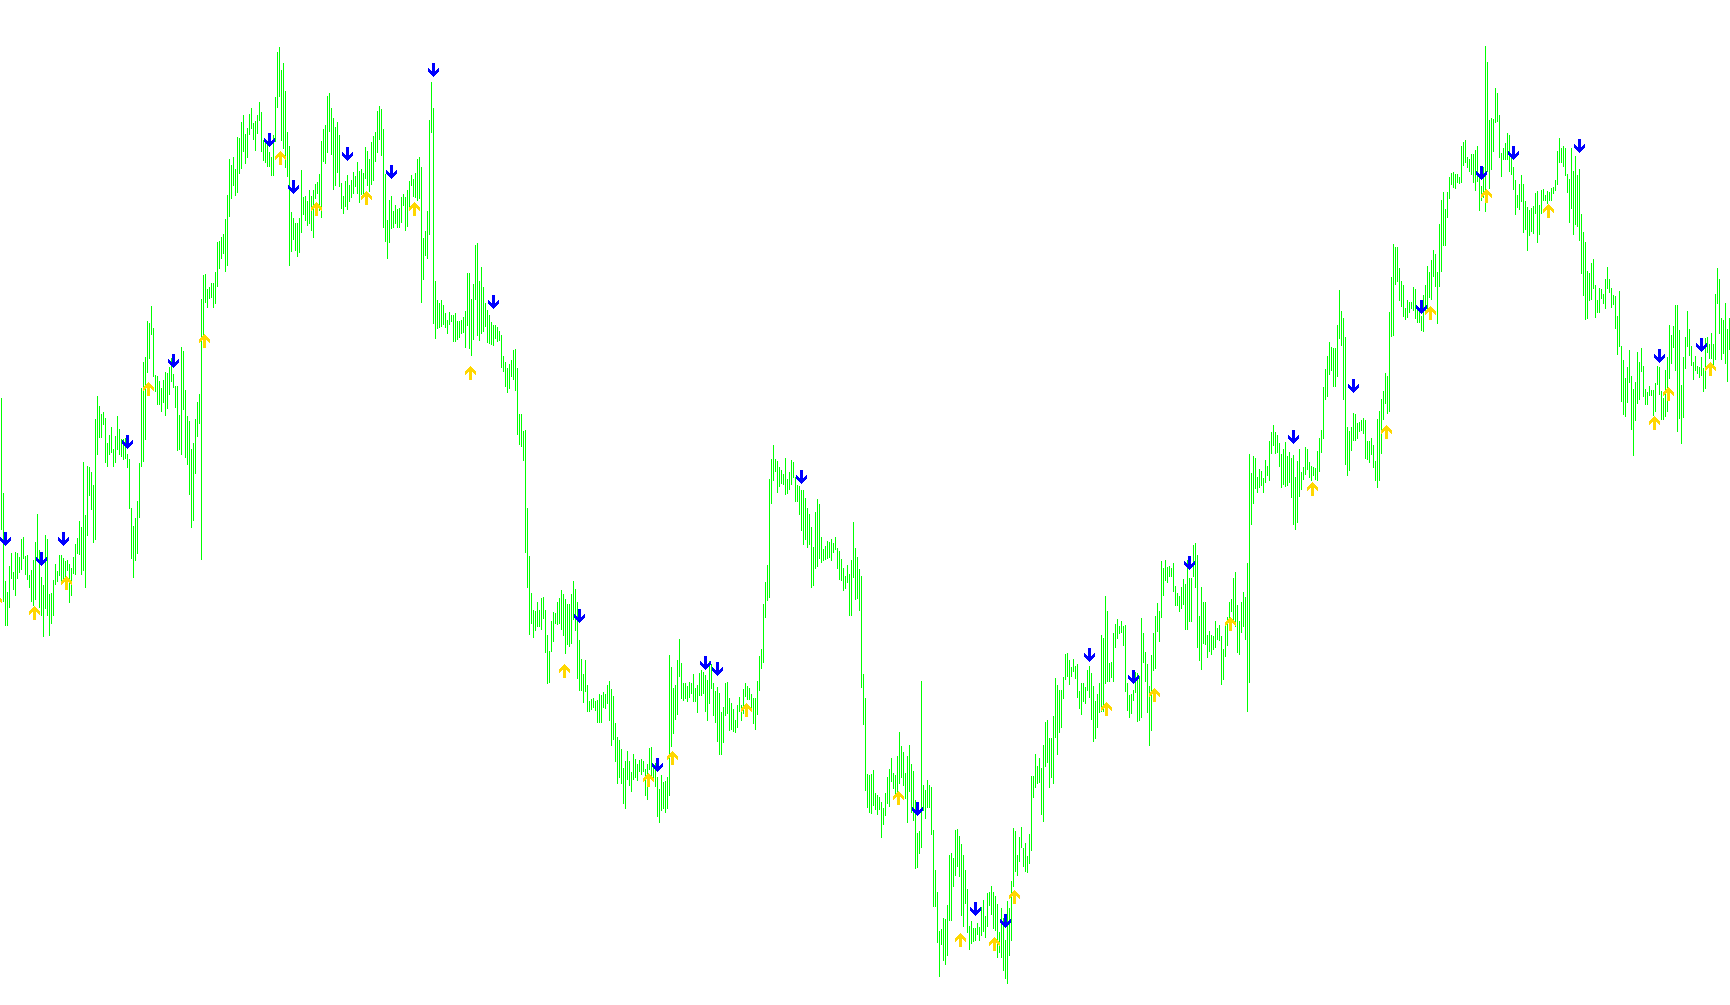
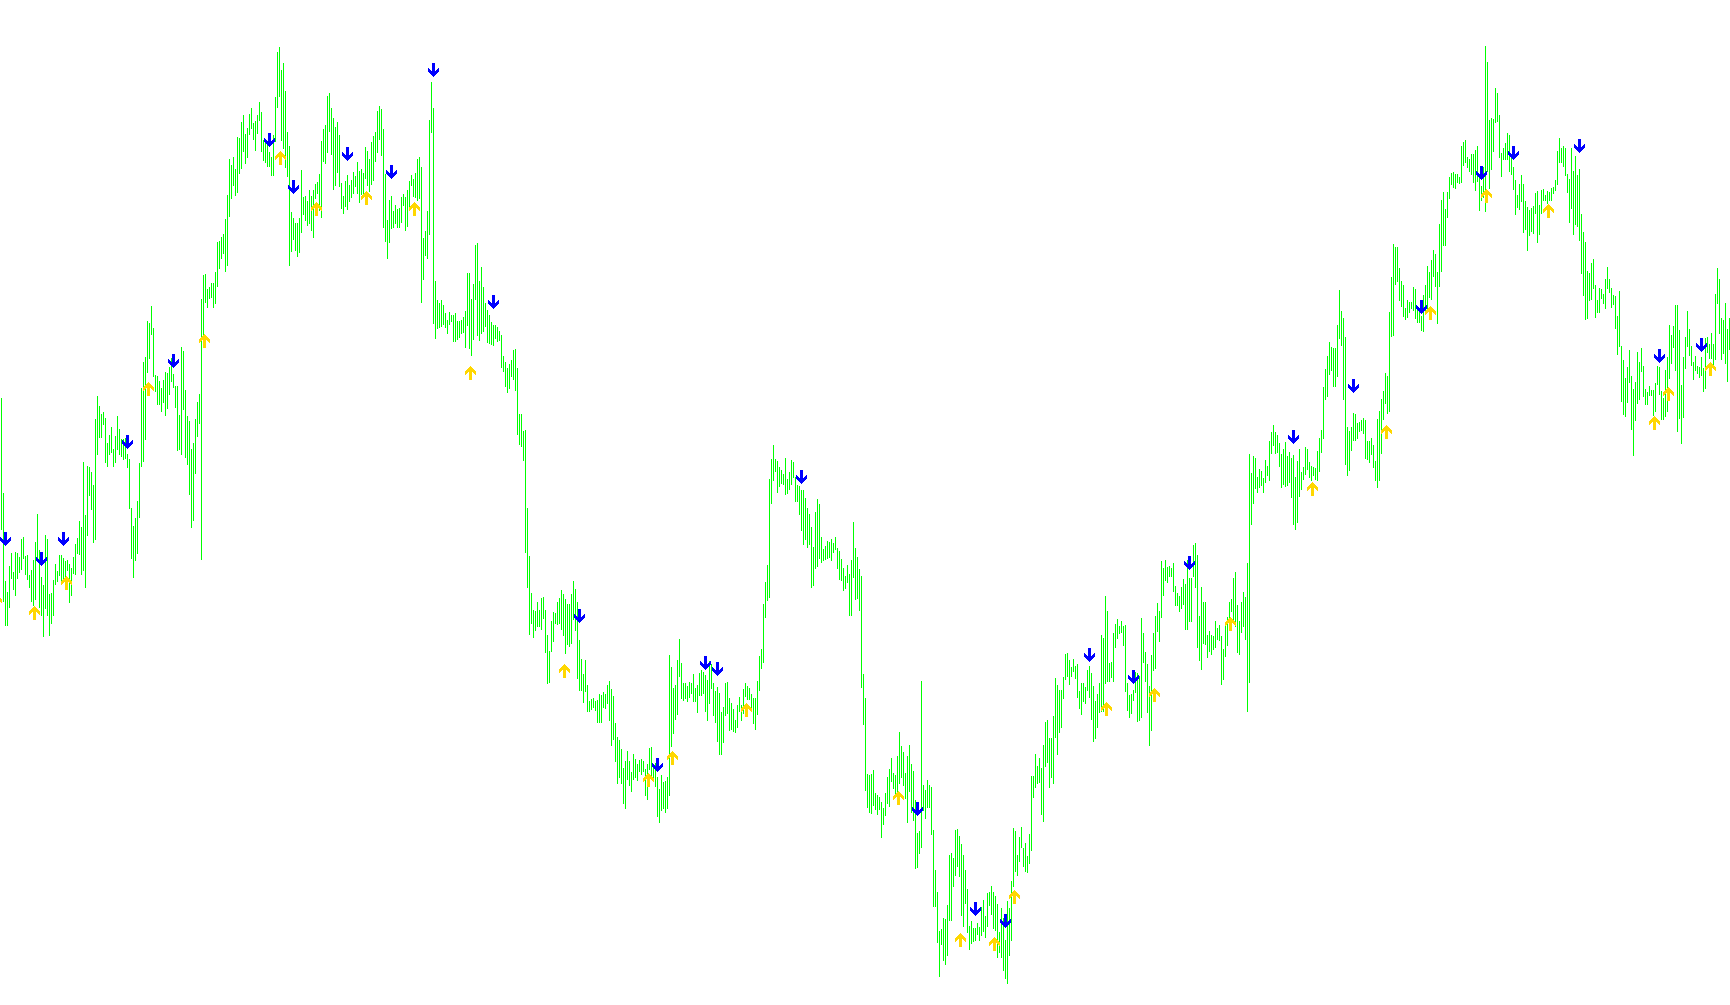
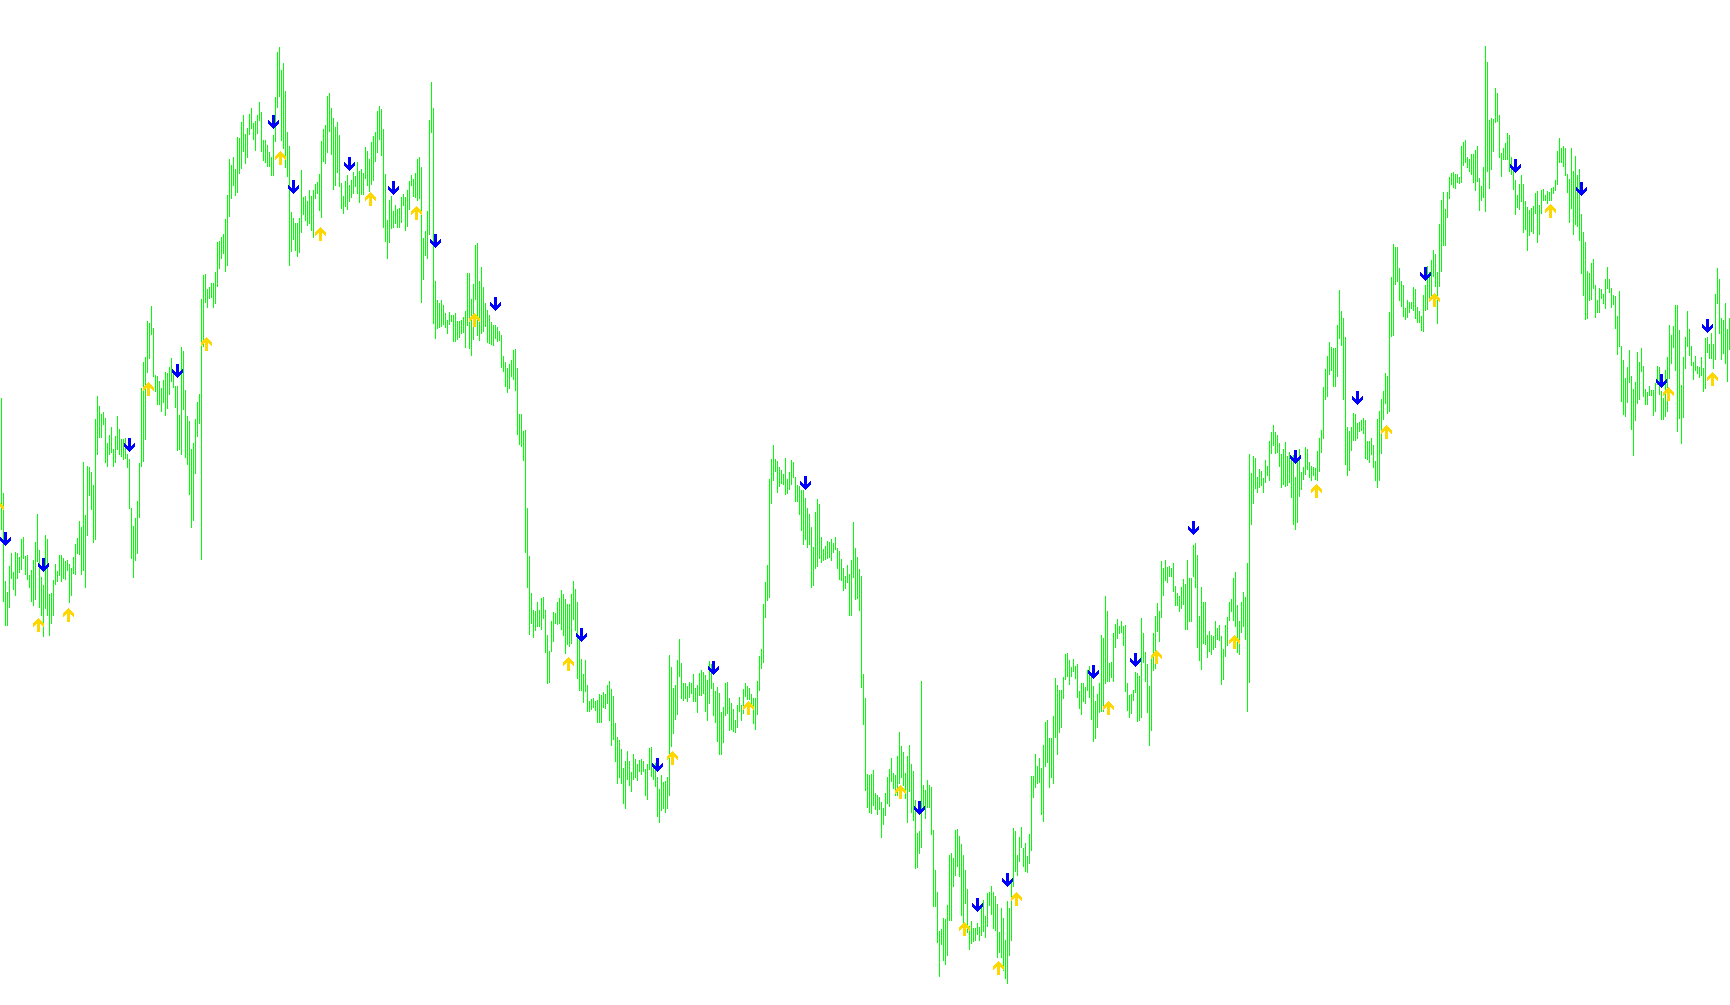
This algorithm executes high-probability entries by synchronizing momentum shifts via Laguerre Filters, ADX trend strength, CCI overbought/oversold thresholds, and a dual-moving average crossover sequence.

sidus v.2
Indicator

sidus v.2

iMAiRSI

This indicator identifies trend reversals by detecting simultaneous price crossover and relative strength shifts between Fast EMA, Slow EMA, and RSI thresholds.

sidus-backup
Indicator

sidus-backup

iCCIiMAiRSI

Identifies bullish and bearish trend shifts by validating triple EMA crossovers against RSI momentum thresholds and CCI directional strength.

Sidus-Crossover_Signal
Indicator

Sidus-Crossover_Signal

iCCIiMAiRSI

This indicator identifies high-probability momentum shifts by synchronizing Sidus EMA tunnel crossovers with LWMA dynamic price actions and multi-oscillator filtering.

Sidus-EMA RSI+CCI Filter
Indicator

Sidus-EMA RSI+CCI Filter

iCCIiMAiRSI

This indicator identifies trend reversals by synchronizing EMA crossover dynamics with RSI momentum thresholds and CCI oscillator polarity to confirm Sidus tunnel breakouts.

Sidus
Indicator

Sidus

iMAiRSI

This indicator identifies trend reversals by detecting the intersection of dual EMA momentum shifts and RSI centerline crossovers.

SiDuS_Base
Indicator

SiDuS_Base

iMA

This indicator identifies bullish and bearish shifts by detecting when short-term linear weighted moving averages consistently cross above or below long-term exponential averages.

Sidus_v1
Indicator

Sidus_v1

iMA

A momentum-based signal indicator that identifies potential trend reversals by detecting specific crossover intersections between weighted moving averages and exponential trend tunnels.

Sidus_v2
Indicator

Sidus_v2

iMA

This indicator identifies trend reversals by monitoring dual moving average crossovers and the breach of specific exponential moving average boundaries.

Sidus_v3
Indicator

Sidus_v3

iMA

This indicator identifies bullish and bearish momentum shifts by detecting crossovers between weighted moving averages and exponential trend tunnels.

Sigma_Bands
Indicator

Sigma_Bands

iMA

This indicator computes moving average deviation levels by calculating standard deviation and dispersion over a rolling historical window to define multi-layered volatility boundaries.

Signal Line(Test)
Indicator

Signal Line(Test)

iMAiMAOnArray

This indicator calculates a smoothed moving average of weighted velocity vectors to identify and plot distinct bullish and bearish trend transitions.

signaliticstrendassistantv1.0
Indicator

signaliticstrendassistantv1.0

iMA

This indicator synchronizes price action across nine distinct timeframes by identifying bullish or bearish momentum via moving average slope transitions.

SignalLine
Indicator

SignalLine

iMAiMAOnArray

This indicator identifies directional shifts by calculating a smoothed Hull Moving Average and mapping its instantaneous gradient to toggle between bullish and bearish trend states.

Signals_Enter
Indicator

Signals_Enter

iMA

This indicator identifies trend reversal points by detecting precise price action cross-overs between a fast and slow moving average period.

signalTable candle
Indicator

signalTable candle

iWPRiMAiSAR

This indicator visualizes real-time trend alignment by comparing Moving Average slopes, Williams Percent Range boundaries, and Parabolic SAR positions across nine distinct temporal scales.

signalTable
Indicator

signalTable

iWPRiMAiSAR

This indicator displays a visual grid of trend confirmation icons by simultaneously evaluating Moving Average crossovers, Williams Percent Range thresholds, and Parabolic SAR values across nine distinct timeframes.

Indicator

signalTable_v1

iWPRiMAiSAR
Signal_Bars_Muk
Indicator

Signal_Bars_Muk

iCCIiMACDiRSIiStochastic

This indicator aggregates synchronized trend signals from MACD, RSI, Stochastic, CCI, and EMA across multiple timeframes into a single visual dashboard for real-time market sentiment analysis.

Indicator

Signal_Bars_v3_Daily

iCCIiMACDiRSIiStochastic
Signal_Bars_v8
Indicator

Signal_Bars_v8

iCCIiMACDiRSIiStochastic

This indicator aggregates real-time momentum, trend, and volatility data across multiple timeframes to provide a unified visual dashboard of market direction.

signal_trend_dan_op
Indicator

signal_trend_dan_op

iADXiMAiStochastic

Identifies market reversals by detecting stochastic line crossovers while filtering for price position relative to a moving average.

sila
Indicator

sila

iMA

This indicator identifies trend strength and dynamic stop-loss levels by calculating the extreme boundaries of multiple Simple Moving Averages weighted by a user-defined period step.

Silence2_02
Indicator

Silence2_02

iMA

The indicator quantifies market state by normalizing aggressive price velocity and standard deviation volatility into a dual-layered percentage scale with a centralized mean.

Silence2_02_v1
Indicator

Silence2_02_v1

iMA

This indicator quantifies market activity by normalizing price velocity and standard deviation into a dual-layered percentage scale to visualize aggressive momentum against current volatility.

Silver-MACD
Indicator

Silver-MACD

iMA

This indicator visualizes price momentum by calculating the differential between a fast and slow exponential moving average, dynamically switching histogram colors to highlight directional shifts.

SilverMACD+
Indicator

SilverMACD+

iMAiMAOnArray

This indicator visualizes momentum by bifurcating the MACD line into two distinct histograms based on its position relative to the signal average.

SilverMACD+_v1
Indicator

SilverMACD+_v1

iMAiMAOnArray

This indicator identifies bullish and bearish momentum by bifurcating a weighted MACD line into a dual-color histogram based on its position relative to a smoothed signal average.

SimpleMAKairi
Indicator

SimpleMAKairi

iMA

This indicator quantifies the relative percentage distance between multiple moving averages (SMA and SMMA) against a primary long-term baseline to identify overextended market conditions.

Indicator

SixMA_allignment

iMA
Slope Direction Line Alert
Indicator

Slope Direction Line Alert

iMAiMAOnArray

This indicator calculates a Hull Moving Average derivative to identify momentum shifts and visualizes trend direction through slope-based polarity changes.

Slope Direction Line Alert_001
Indicator

Slope Direction Line Alert_001

iMAiMAOnArray

This indicator identifies directional shifts by calculating the derivative of a Hull Moving Average to detect structural trend transitions and provide real-time price alerts.

Slope Direction Line Alert_002
Indicator

Slope Direction Line Alert_002

iMAiMAOnArray

This indicator calculates the directional velocity of a Hull Moving Average by processing a smoothed vector of weighted price differences to identify trend reversals.

Slope Direction Line
Indicator

Slope Direction Line

iMAiMAOnArray

This indicator identifies trend reversals by calculating the derivative of a dual-weighted moving average to map directional momentum changes.

Slope Direction Line_001
Indicator

Slope Direction Line_001

iMAiMAOnArray

This indicator calculates a smoothed trend momentum by applying an iterative moving average to the difference between dual Hull Moving Average components.

Slope Direction Line_002
Indicator

Slope Direction Line_002

iMAiMAOnArray

This indicator calculates the momentum of price movement by determining the direction of the Hull Moving Average slope to identify distinct trend shifts.

Slope Direction Line_004
Indicator

Slope Direction Line_004

iMAiMAOnArray

This indicator identifies market trajectory by calculating the differential between two moving averages and applying a secondary smoothing pass to isolate directional trend shifts.

Slope Direction Line_005
Indicator

Slope Direction Line_005

iMAiMAOnArray

This indicator calculates a Hull Moving Average derivative to isolate directional momentum and visually bifurcate bullish and bearish trend trajectories.

Slope Direction Line_v2
Indicator

Slope Direction Line_v2

iMAiMAOnArray

This indicator calculates a weighted moving average to determine price velocity and filters directional shifts into distinct bullish and bearish trend components.

slopedirection
Indicator

slopedirection

iMAiMAOnArray

This indicator calculates real-time price momentum by applying a square-root derived smoothing algorithm to weighted moving average derivatives across nine concurrent timeframes.

SlopeDirectionLine
Indicator

SlopeDirectionLine

iMAiMAOnArray

This indicator identifies directional bias by calculating the derivative of a Hull Moving Average to isolate underlying momentum shifts.

Slope_Direction_Line
Indicator

Slope_Direction_Line

iMAiMAOnArray

This indicator calculates a smoothed trend trajectory by applying a moving average to the weighted difference between dual-period WMA calculations to identify directional momentum shifts.

Slope_Line
Indicator

Slope_Line

iMAiMAOnArray

This indicator utilizes a double-smoothed moving average calculation to filter market noise and identify the underlying directional momentum of price action.

SMA C
Indicator

SMA C

iMAiMAOnArray

The algorithm calculates a smoothed directional trajectory by applying a weighted moving average to the differential velocity between two nested moving averages.

SMA Cross Over Arrow
Indicator

SMA Cross Over Arrow

iMA

This indicator identifies and plots discrete geometric markers at the exact coordinates where a fast Simple Moving Average pierces through a slow SMA to highlight trend shifts.

SMA Cross Over ArrowAlert
Indicator

SMA Cross Over ArrowAlert

iMA

This indicator detects precise momentum shifts by identifying the instantaneous crossover points between a fast and slow simple moving average, visually marking trends and triggering real-time notifications.

SMA-Crossover_Signal
Indicator

SMA-Crossover_Signal

iMA

This indicator identifies specific price action pivot points by detecting momentum shifts where a fast simple moving average pierces a slower timeframe baseline.

SMA-Crossover_Signal_v1
Indicator

SMA-Crossover_Signal_v1

iMA

This indicator identifies precise bullish and bearish momentum shifts by detecting the exact intersection points of two distinct simple moving average periods.

sMACD
Indicator

sMACD

iMAiMAOnArray

This indicator identifies trend reversals by detecting precise crossover points between an exponential moving average difference histogram and its simple moving average signal line.

SMA_ CROSSOVER SIGNAL
Indicator

SMA_ CROSSOVER SIGNAL

iMA

Identifies and visualizes exact crossover points between two simple moving averages using dynamic price range offsets for enhanced visibility.