Three_Color_ma
Indicator

Three_Color_ma

iMA

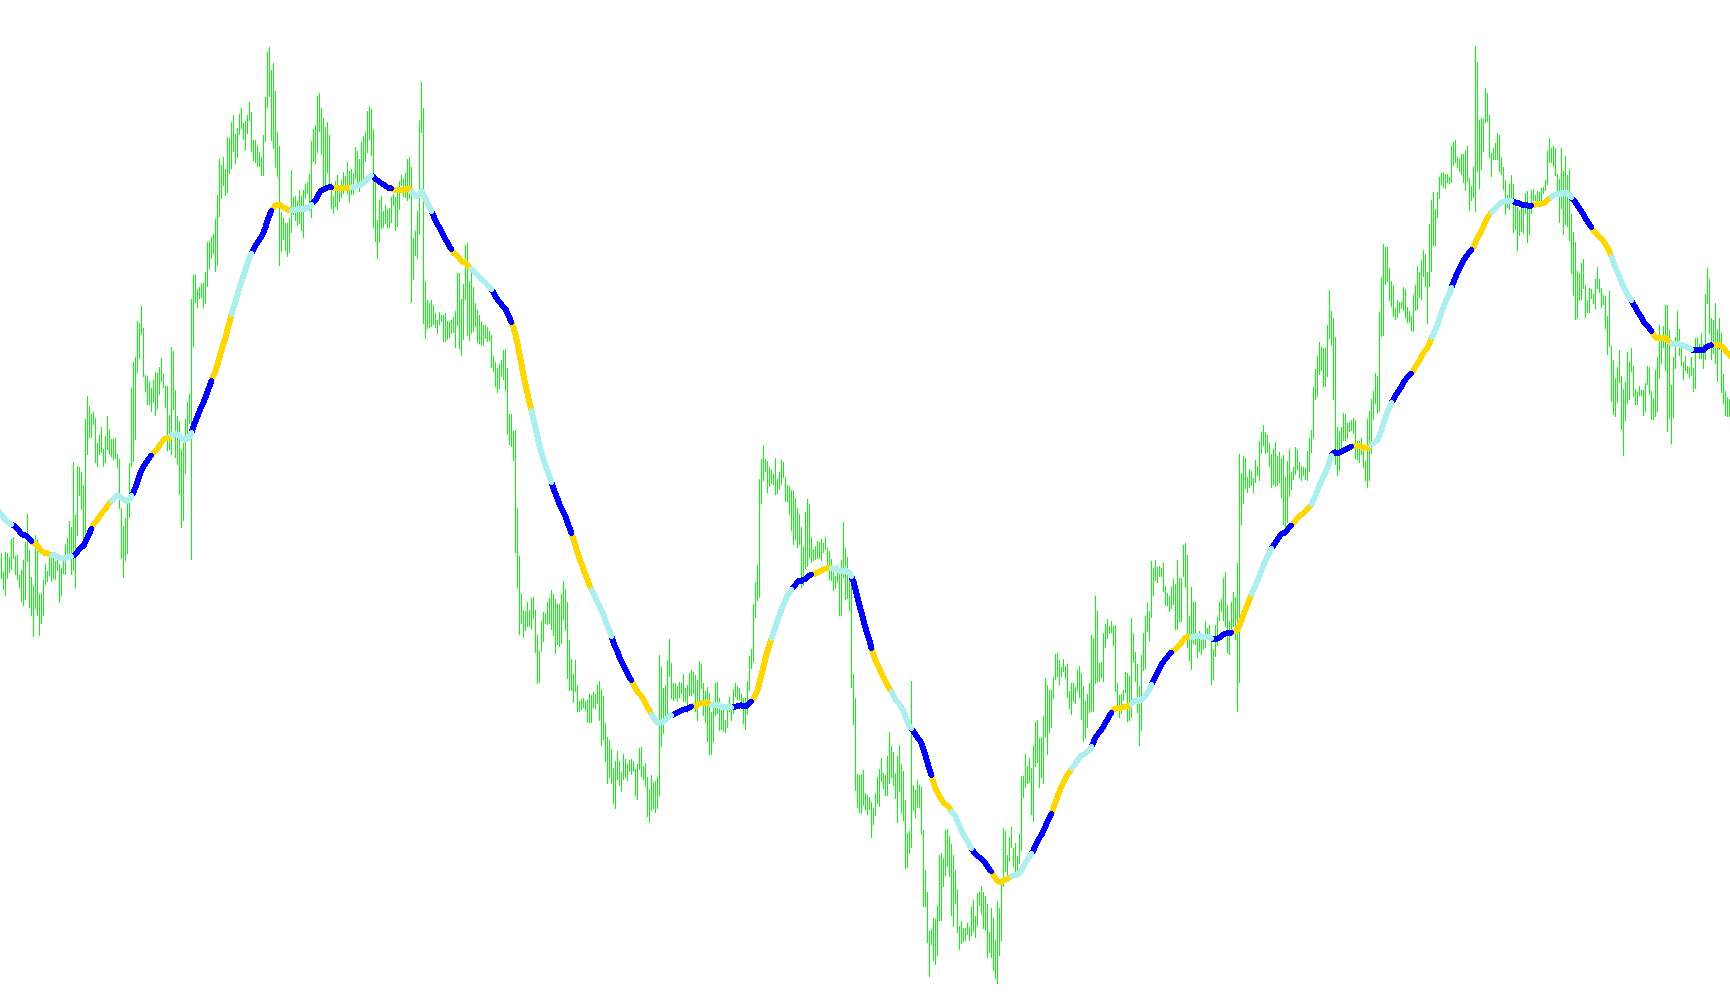
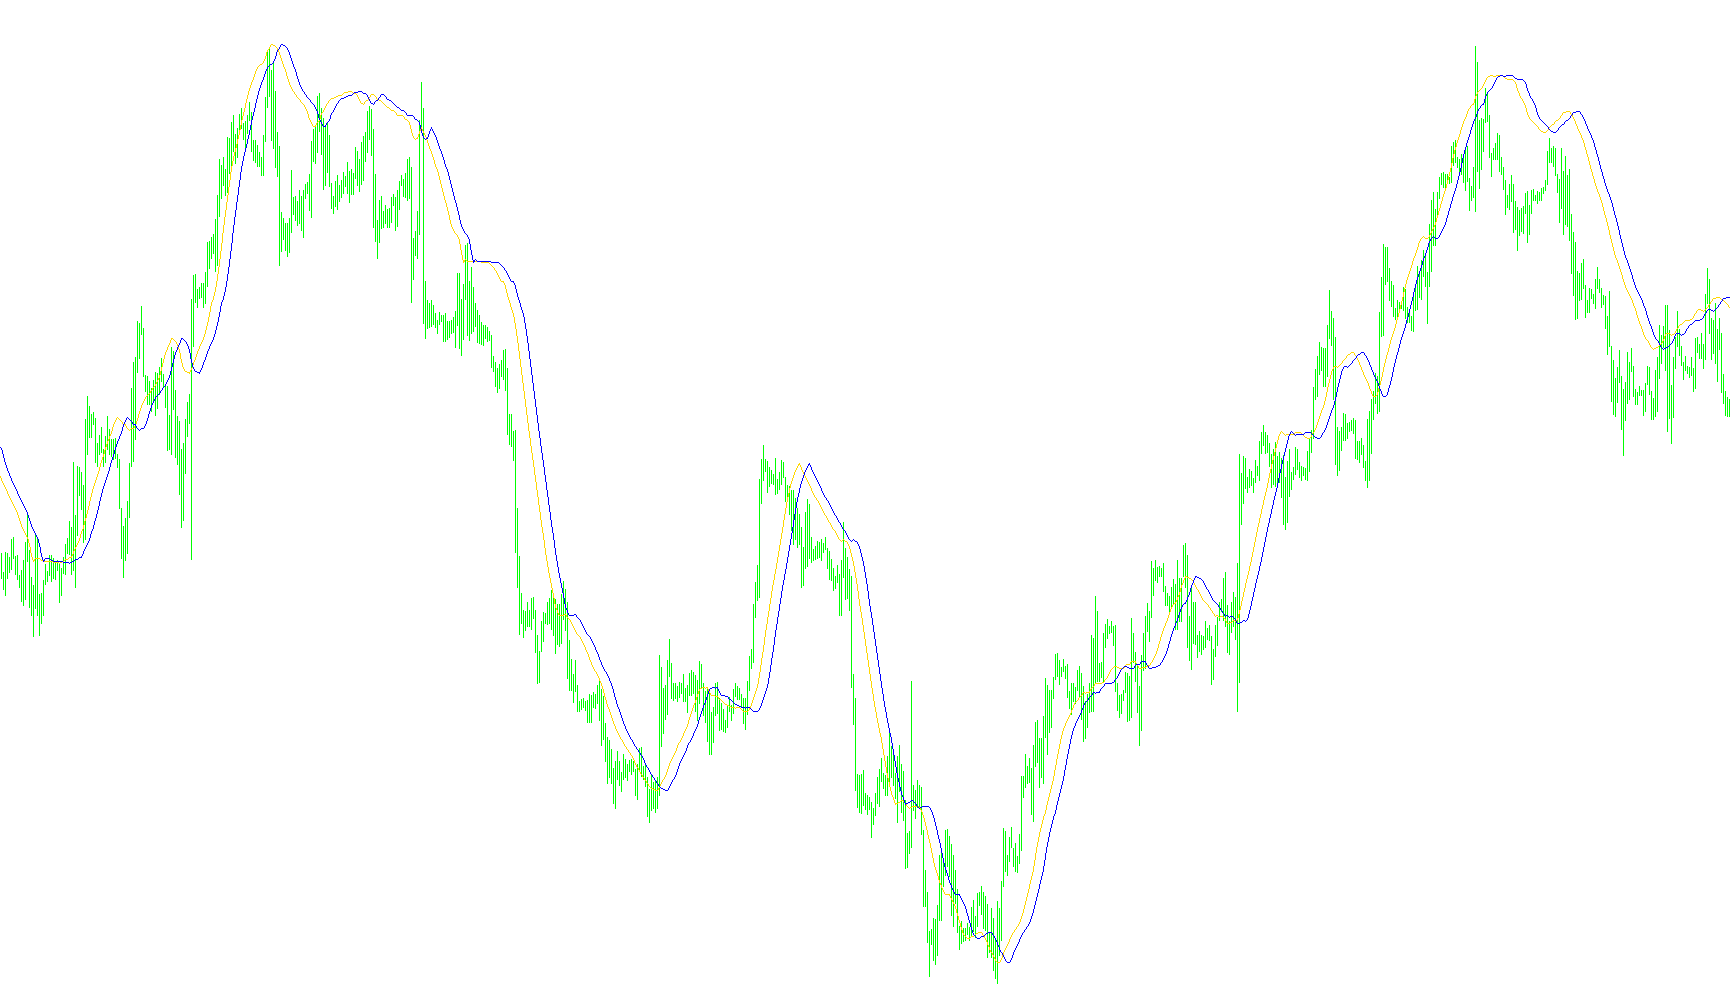
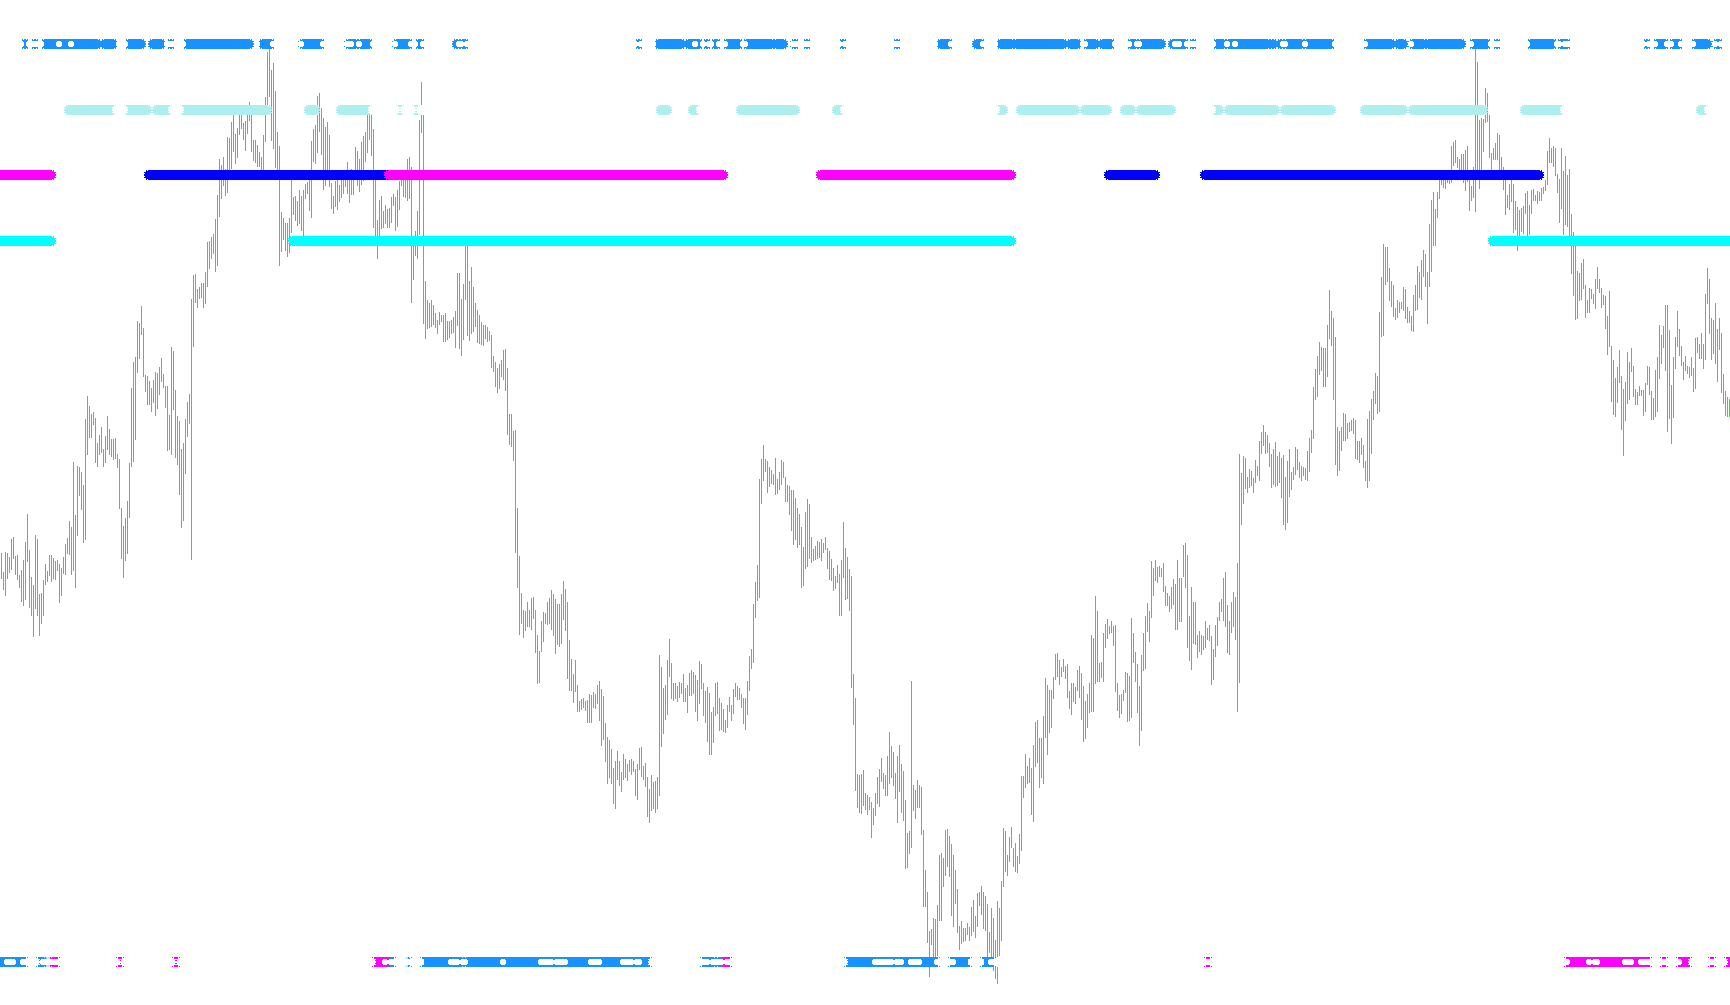
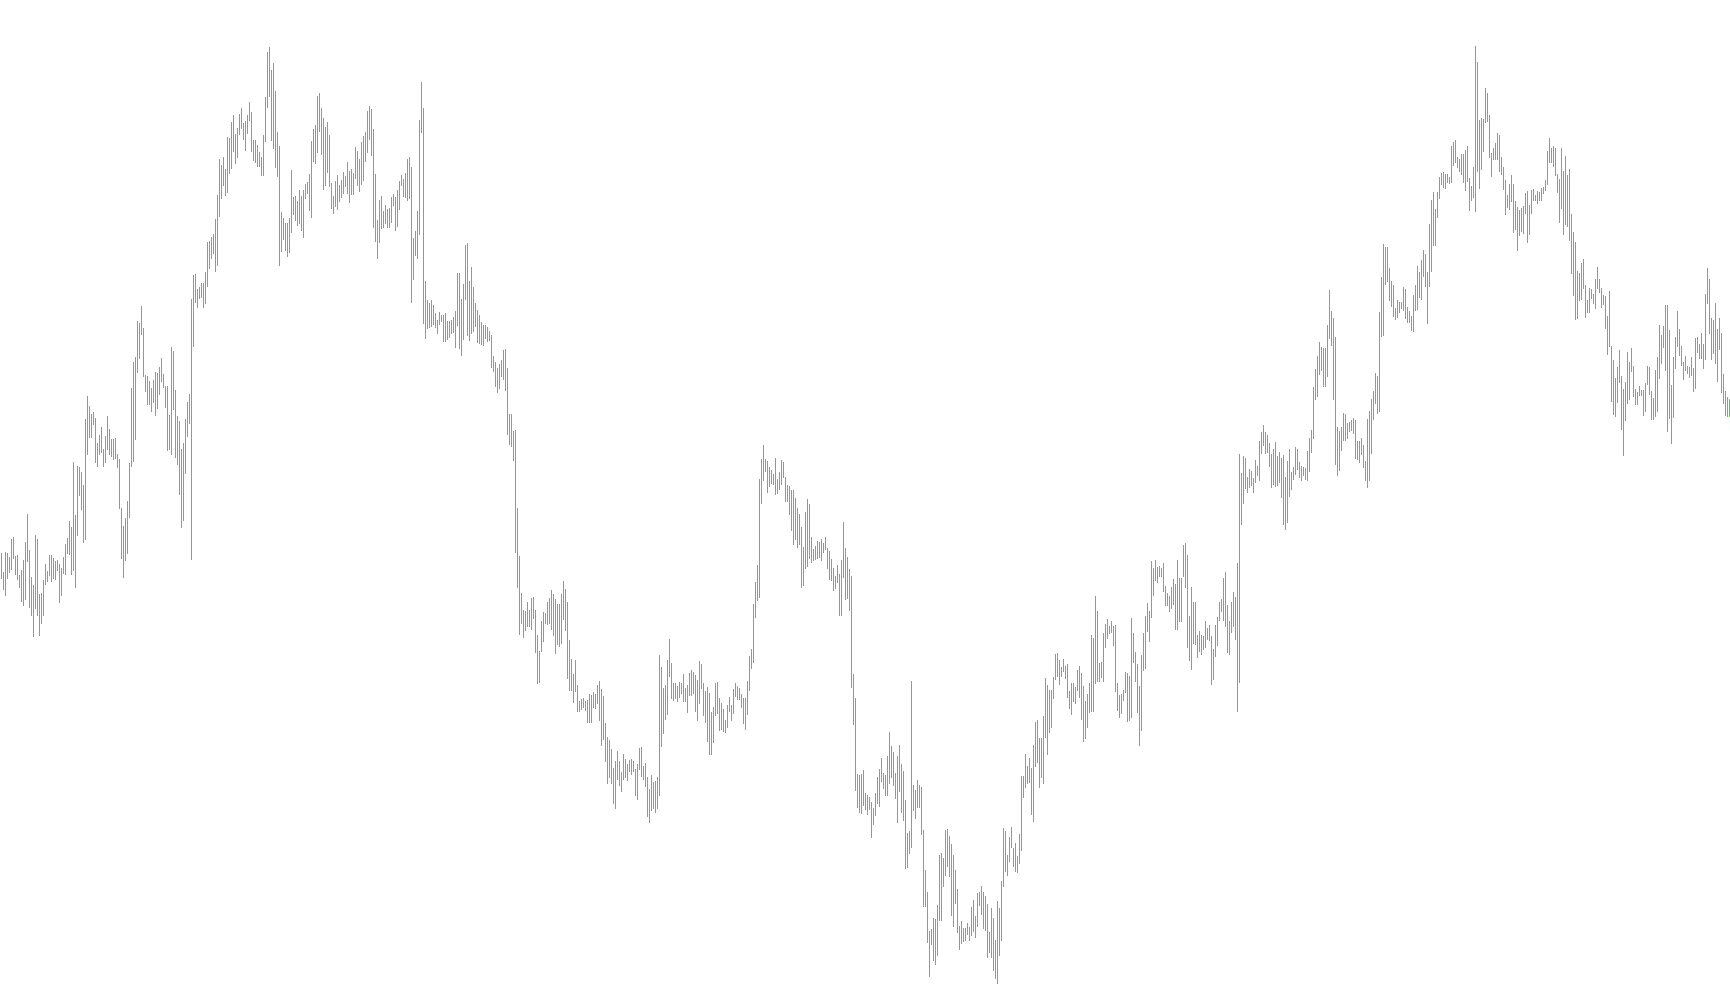
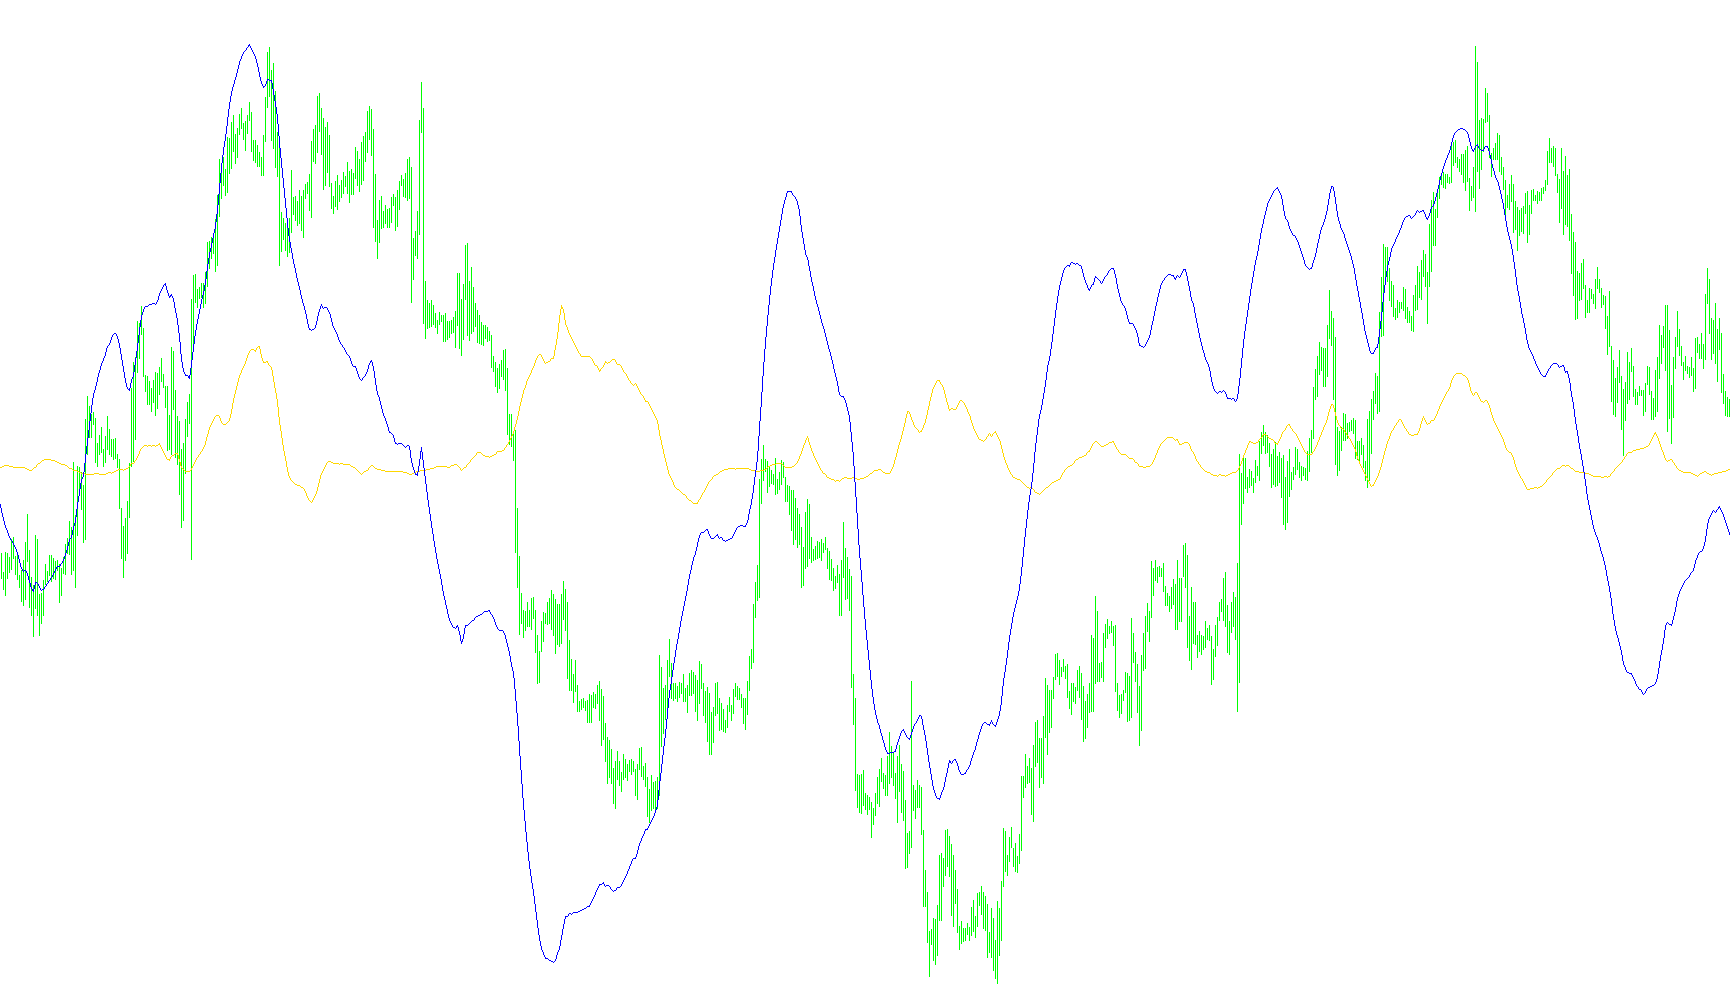
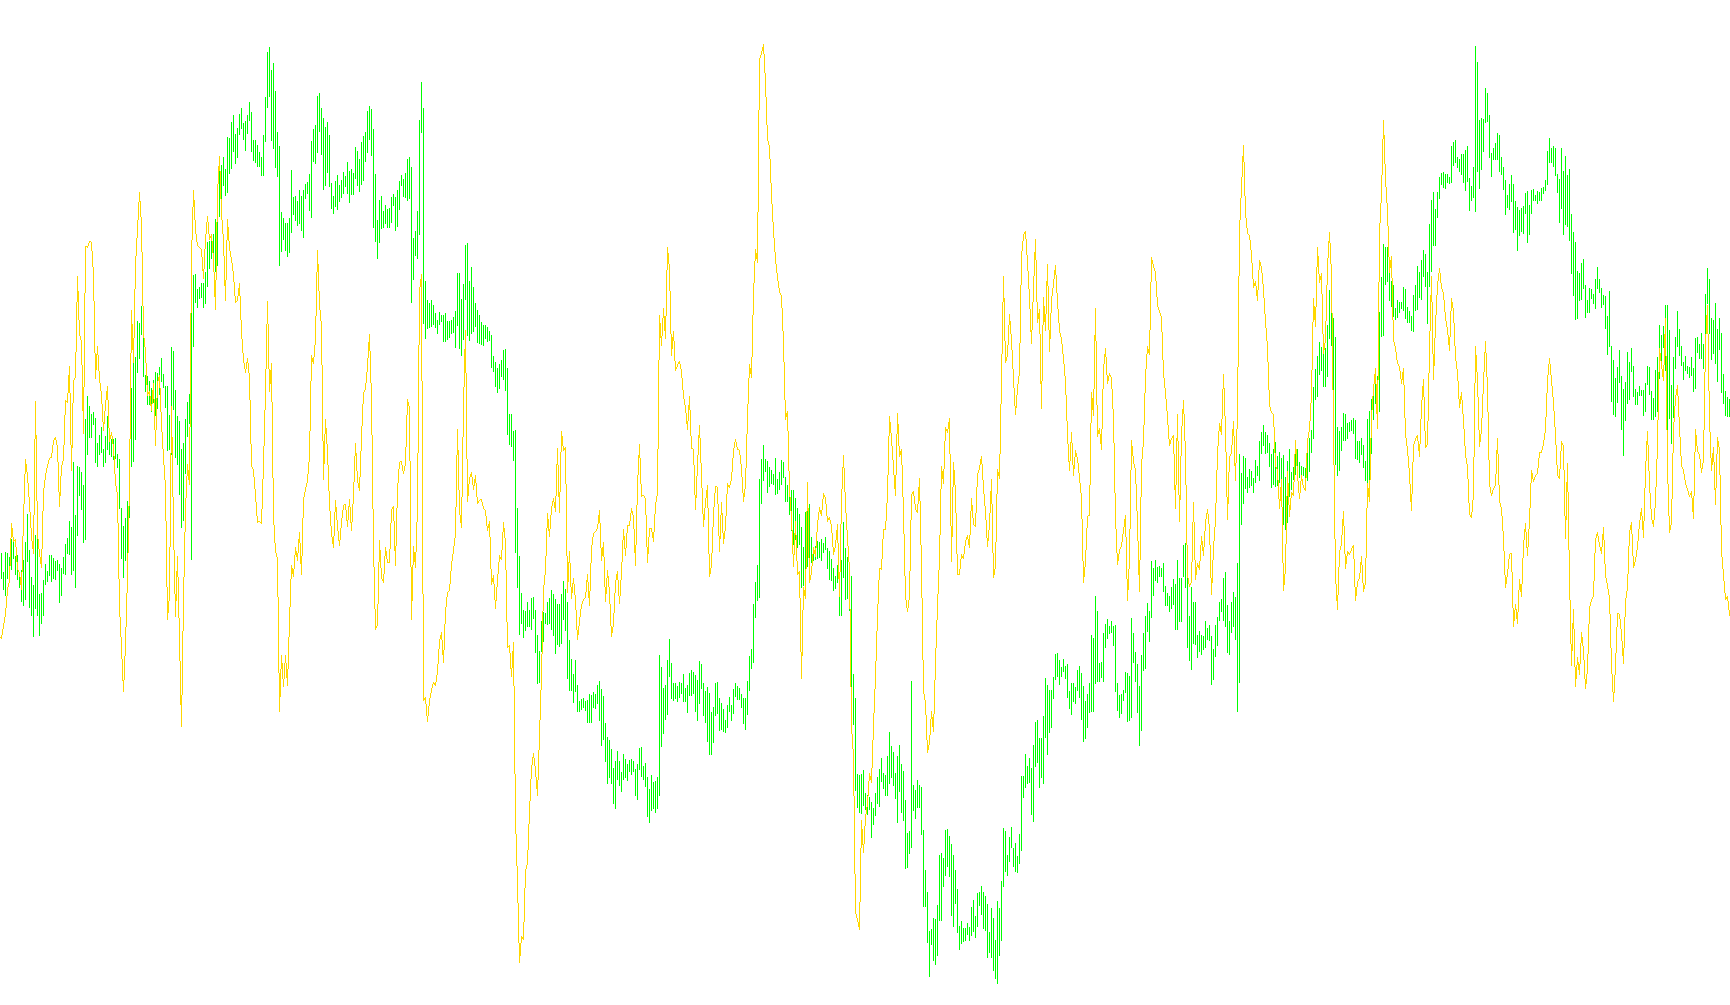
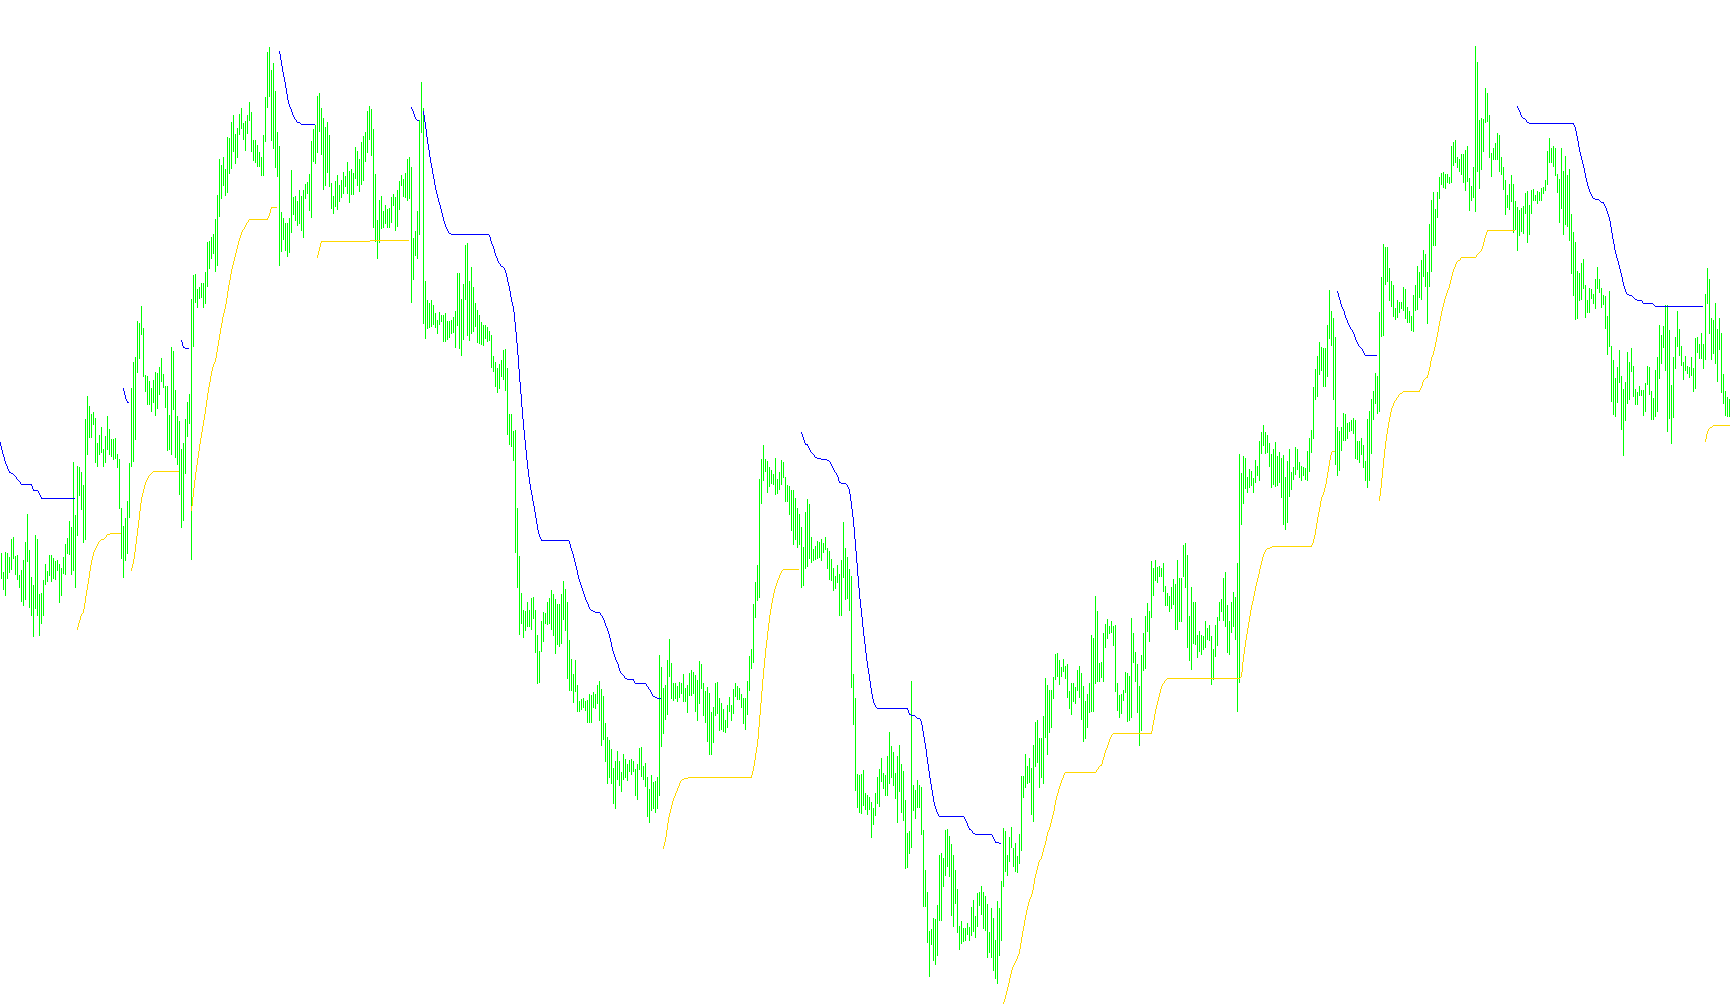
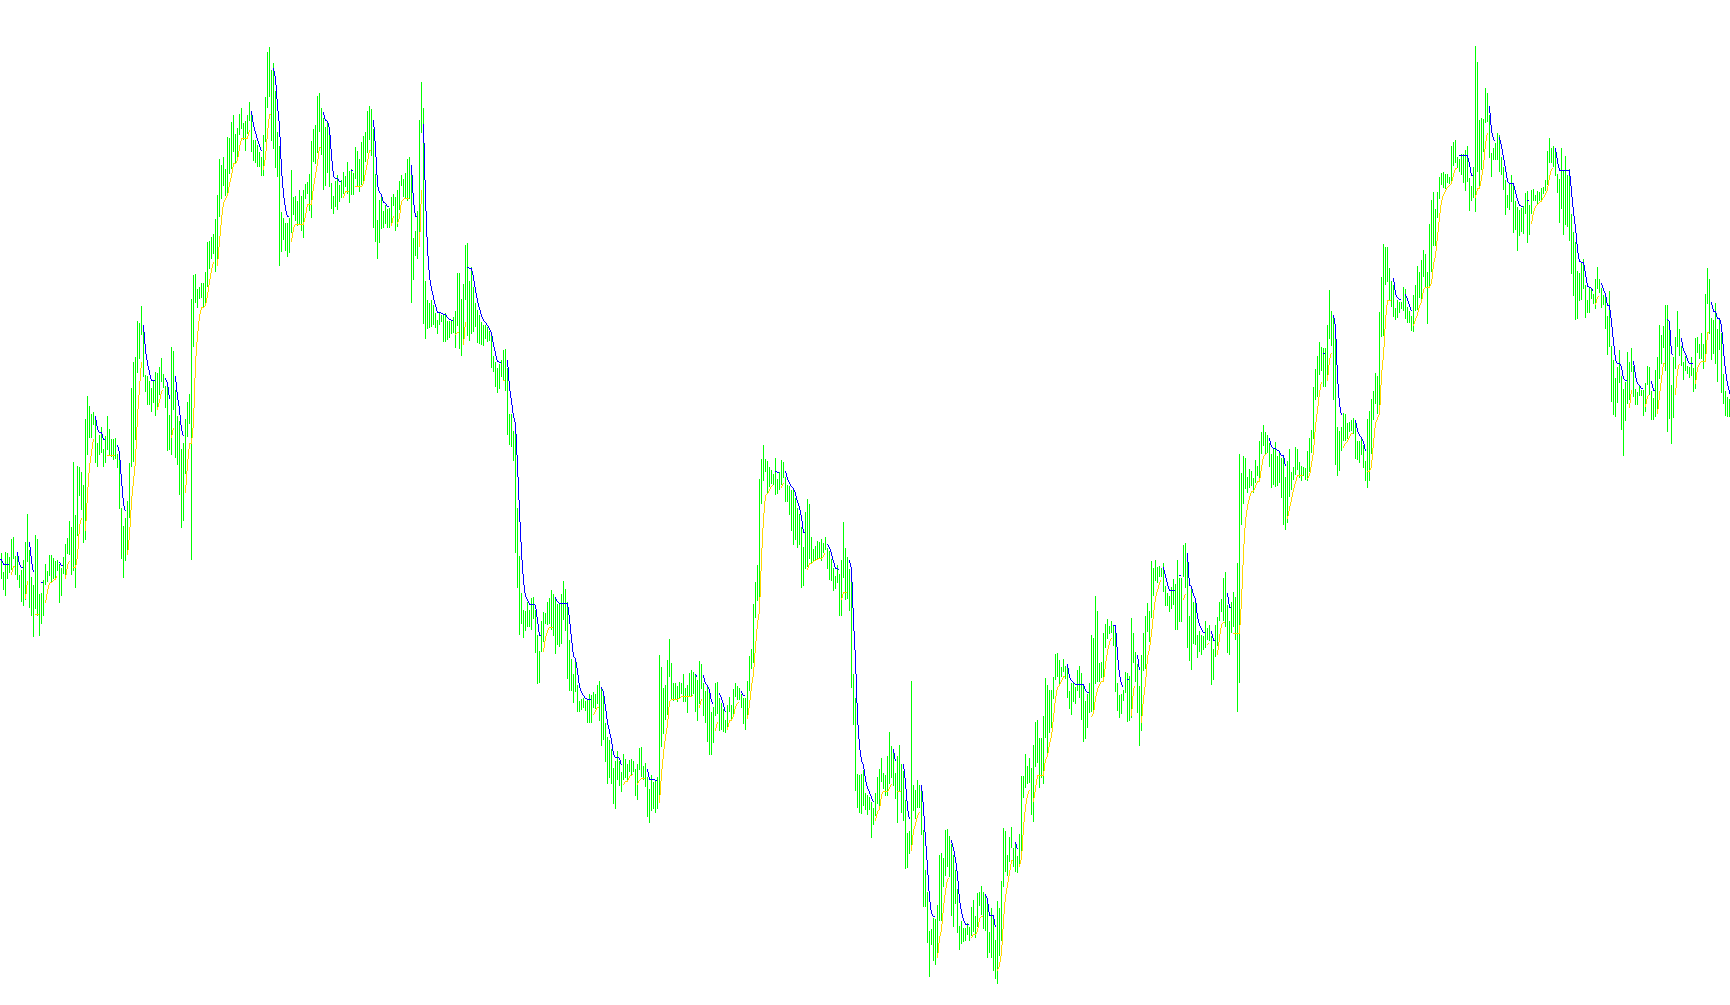
This indicator segments historical price data into three distinct chronological phases, visually separating the moving average values into independent color-coded clusters.

Three_Color_ma_strict
Indicator

Three_Color_ma_strict

iMA

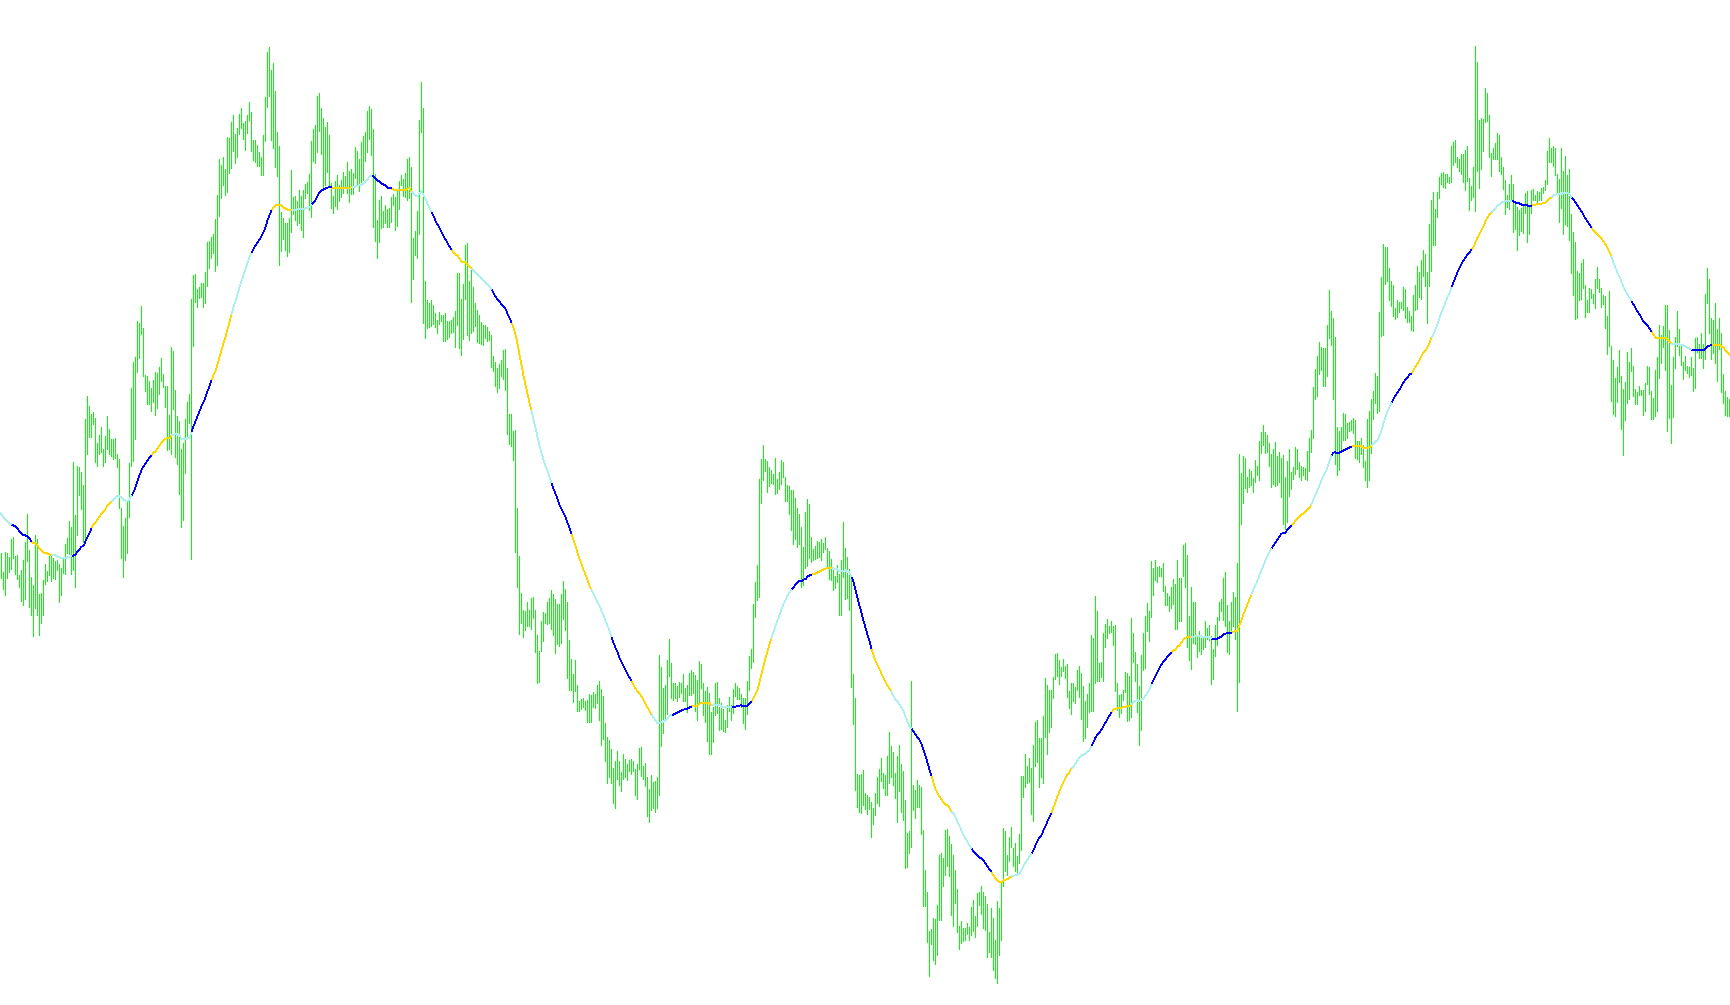
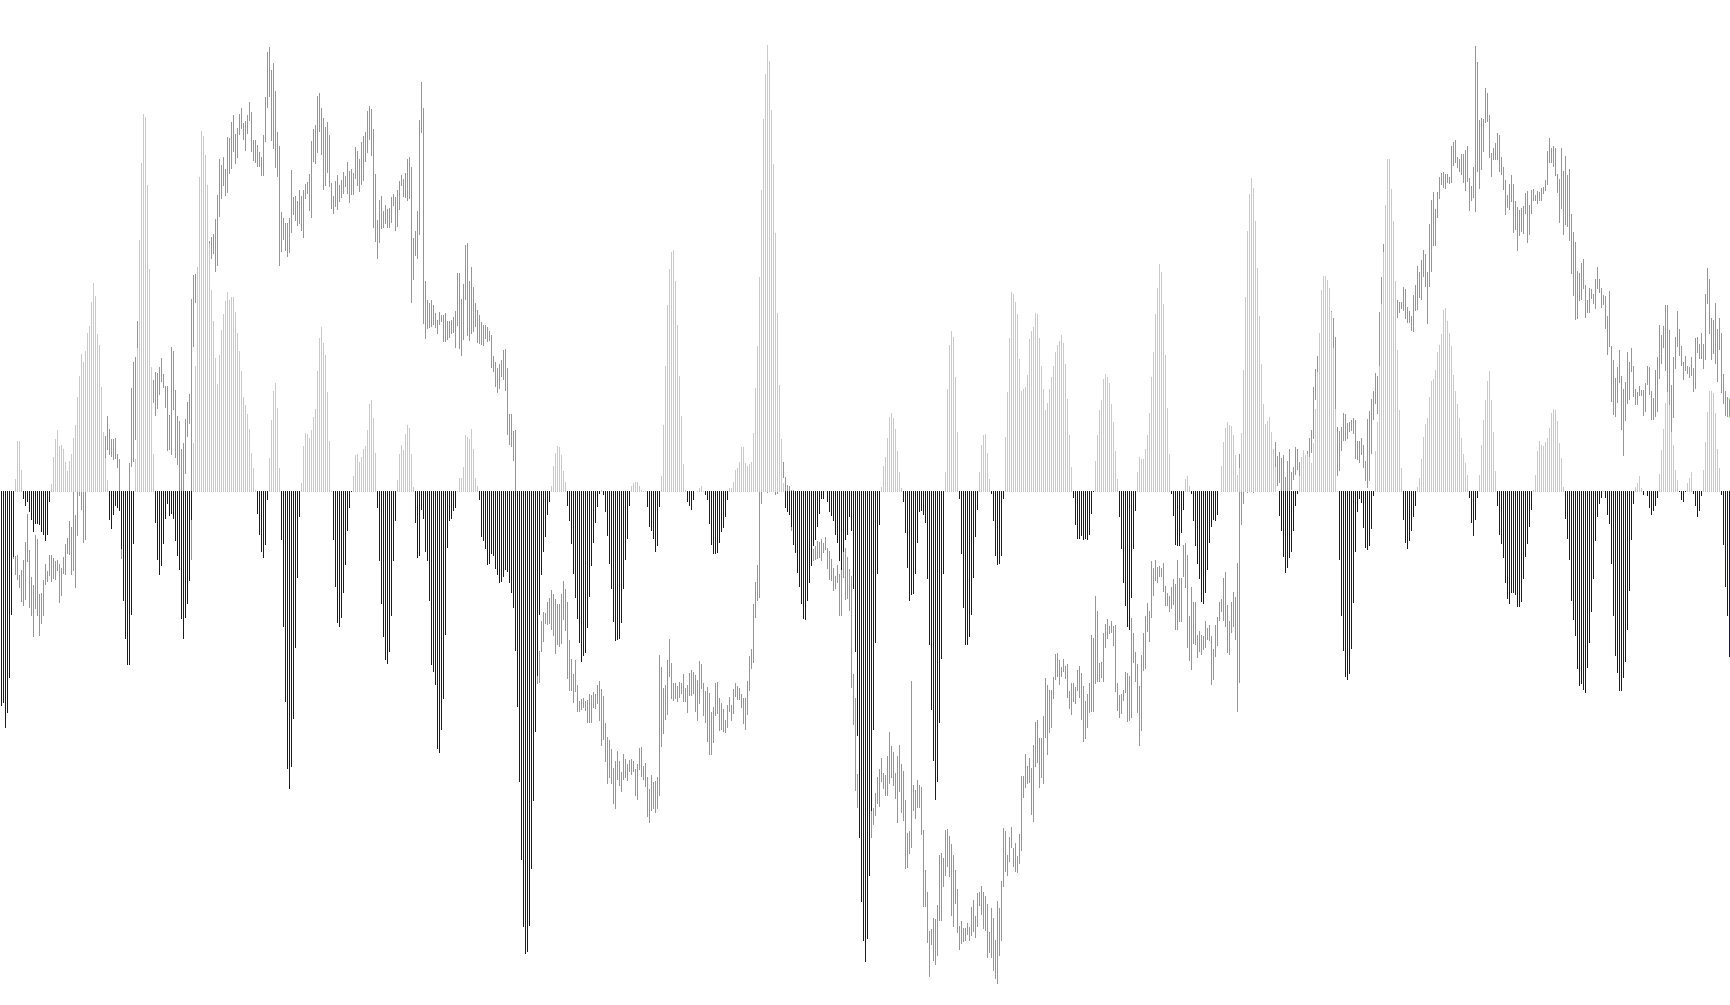
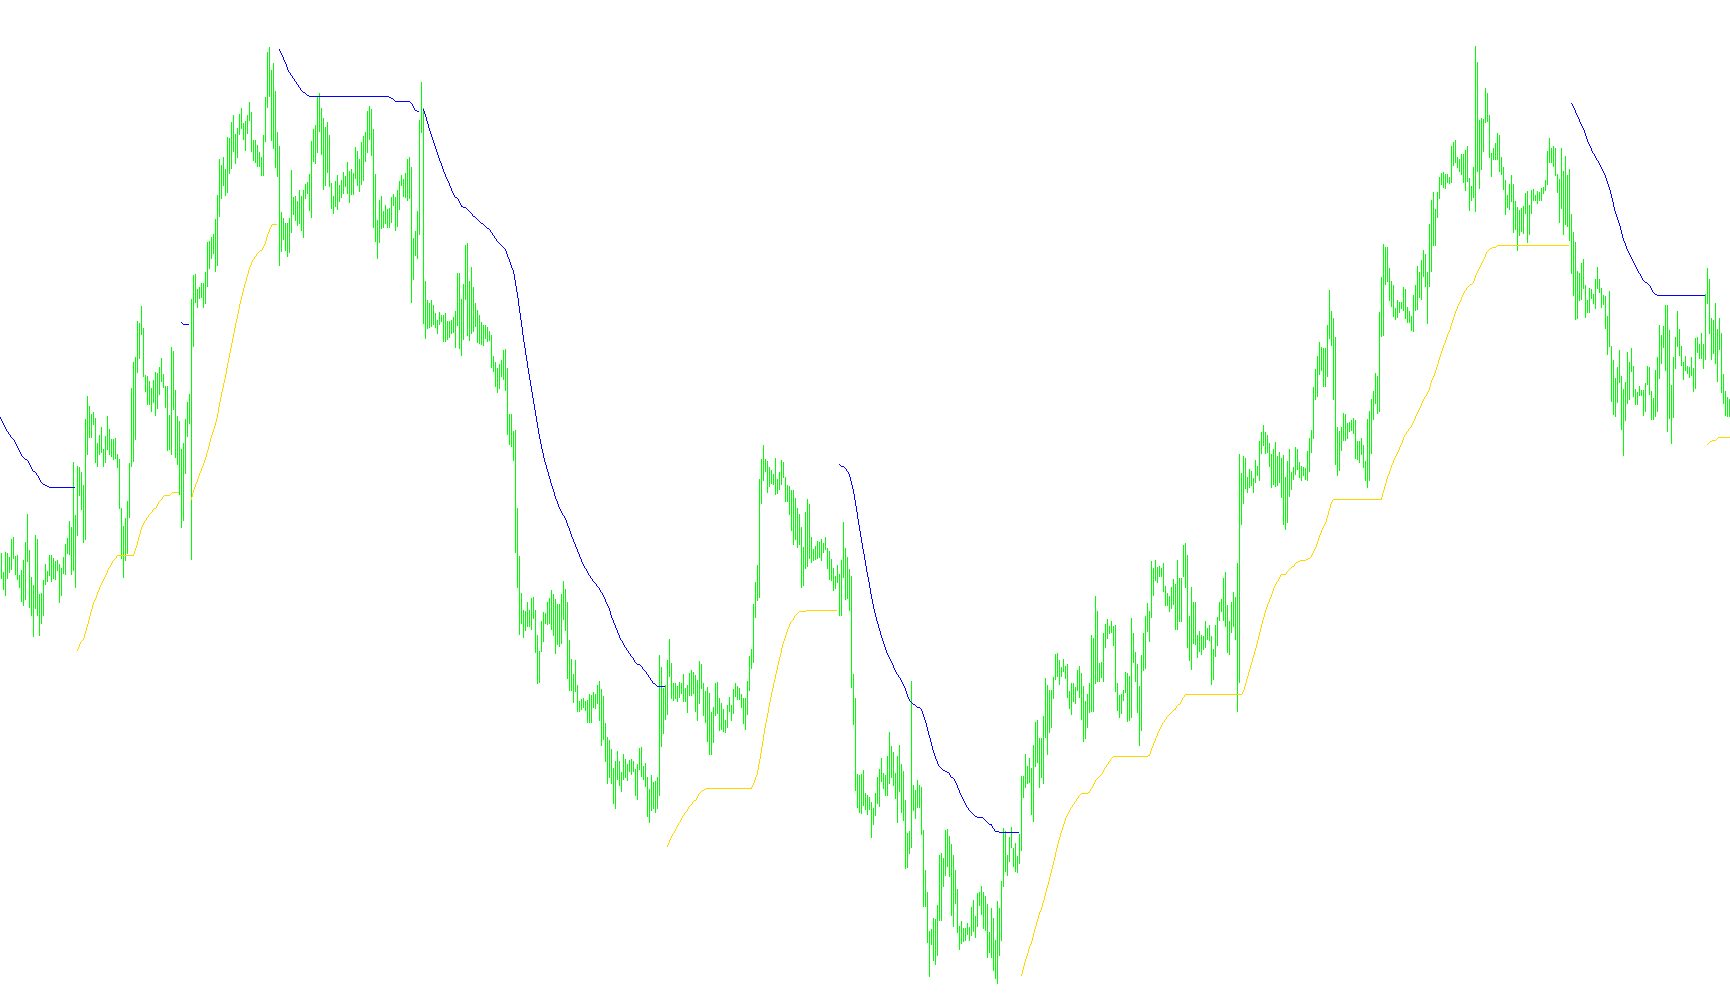
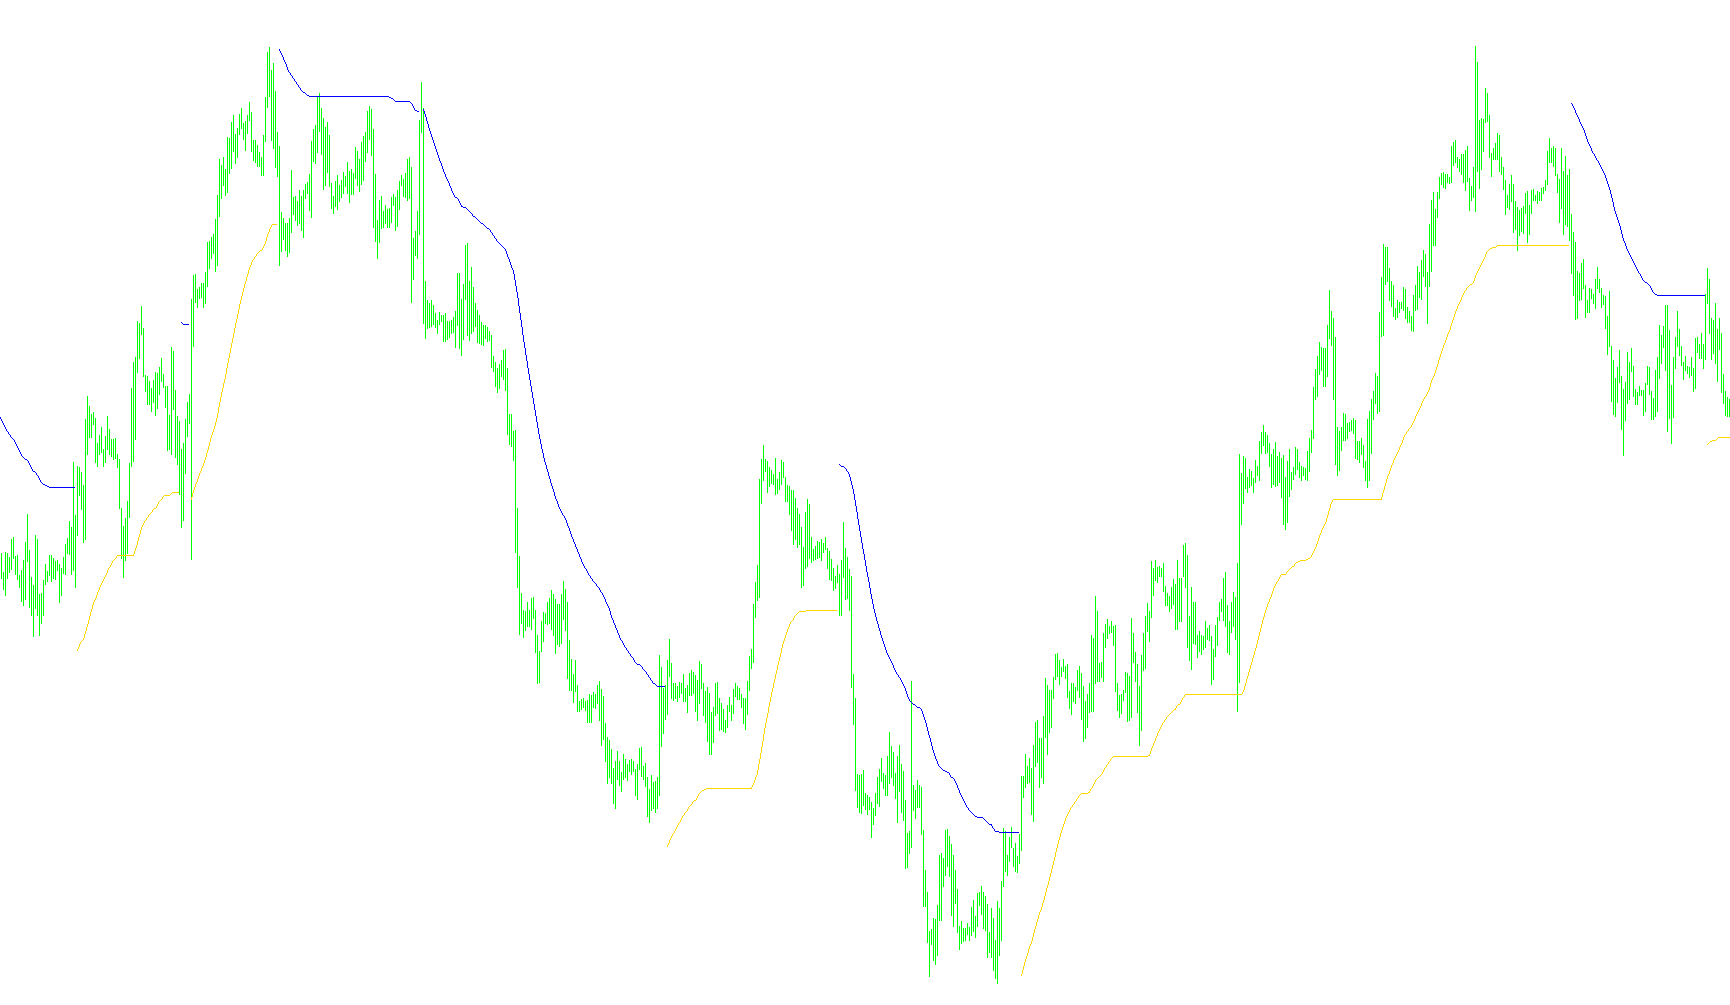
This indicator renders three distinct moving average segments on the chart by cycling active buffers across specific price intervals to visualize rhythmic trend shifts.

Three_Color_v1
Indicator

Three_Color_v1

iMA

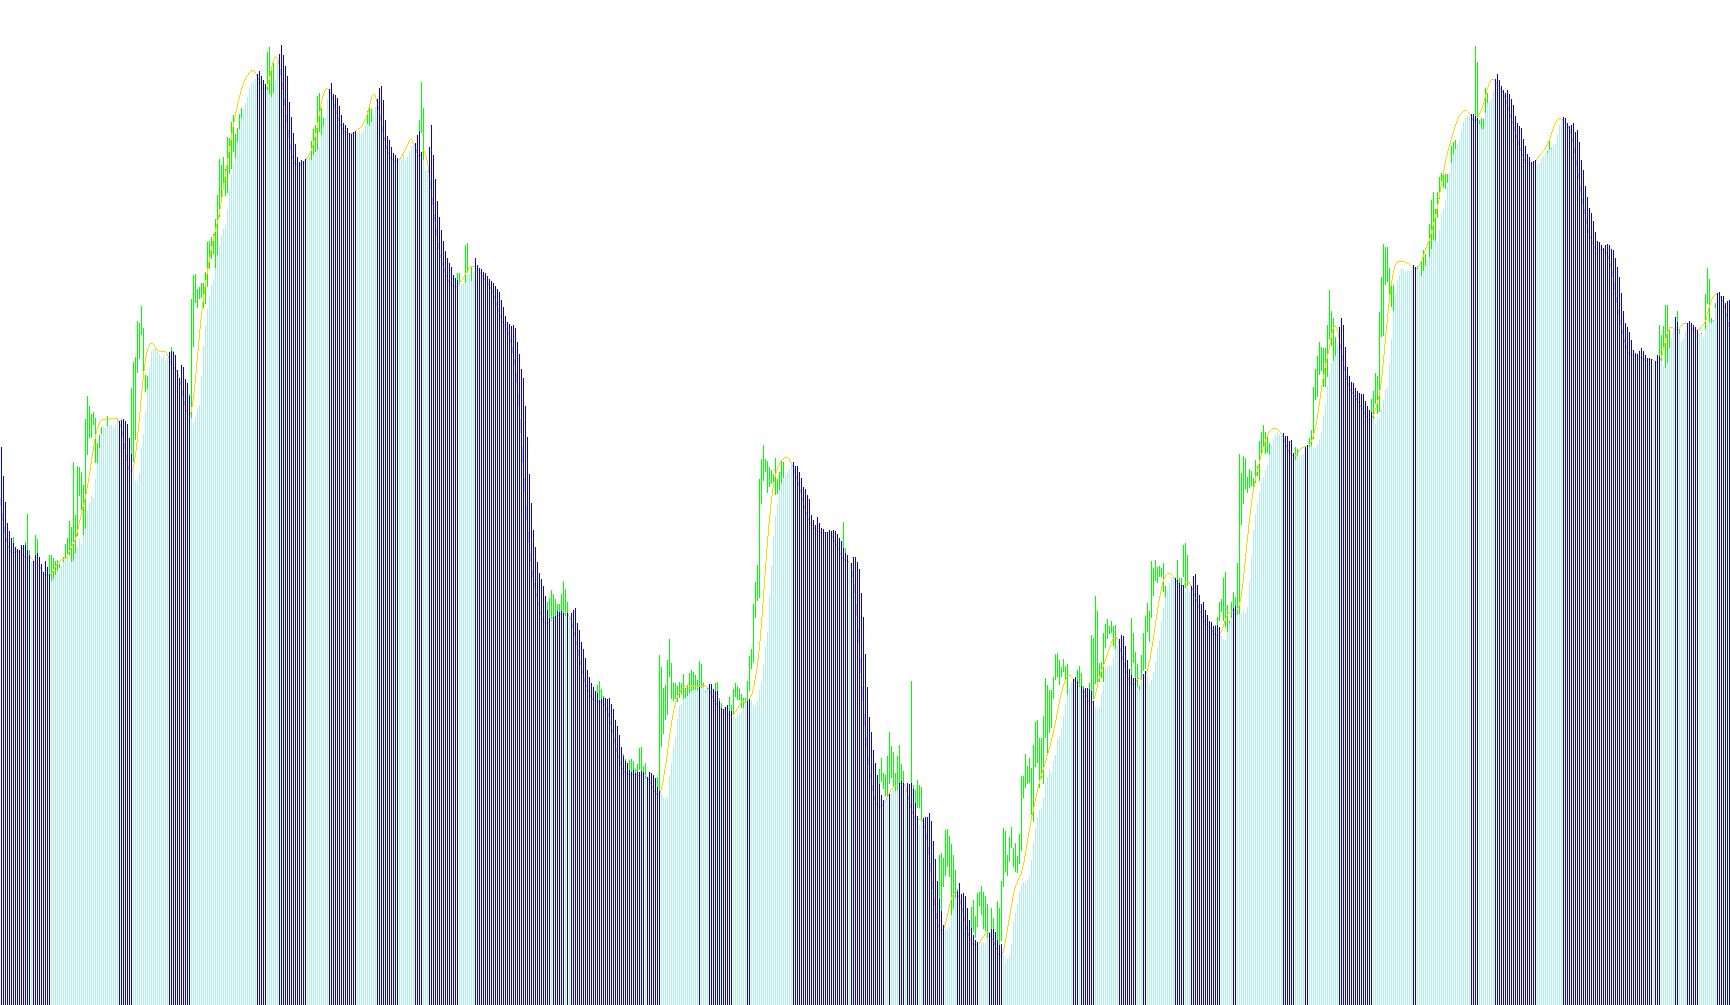
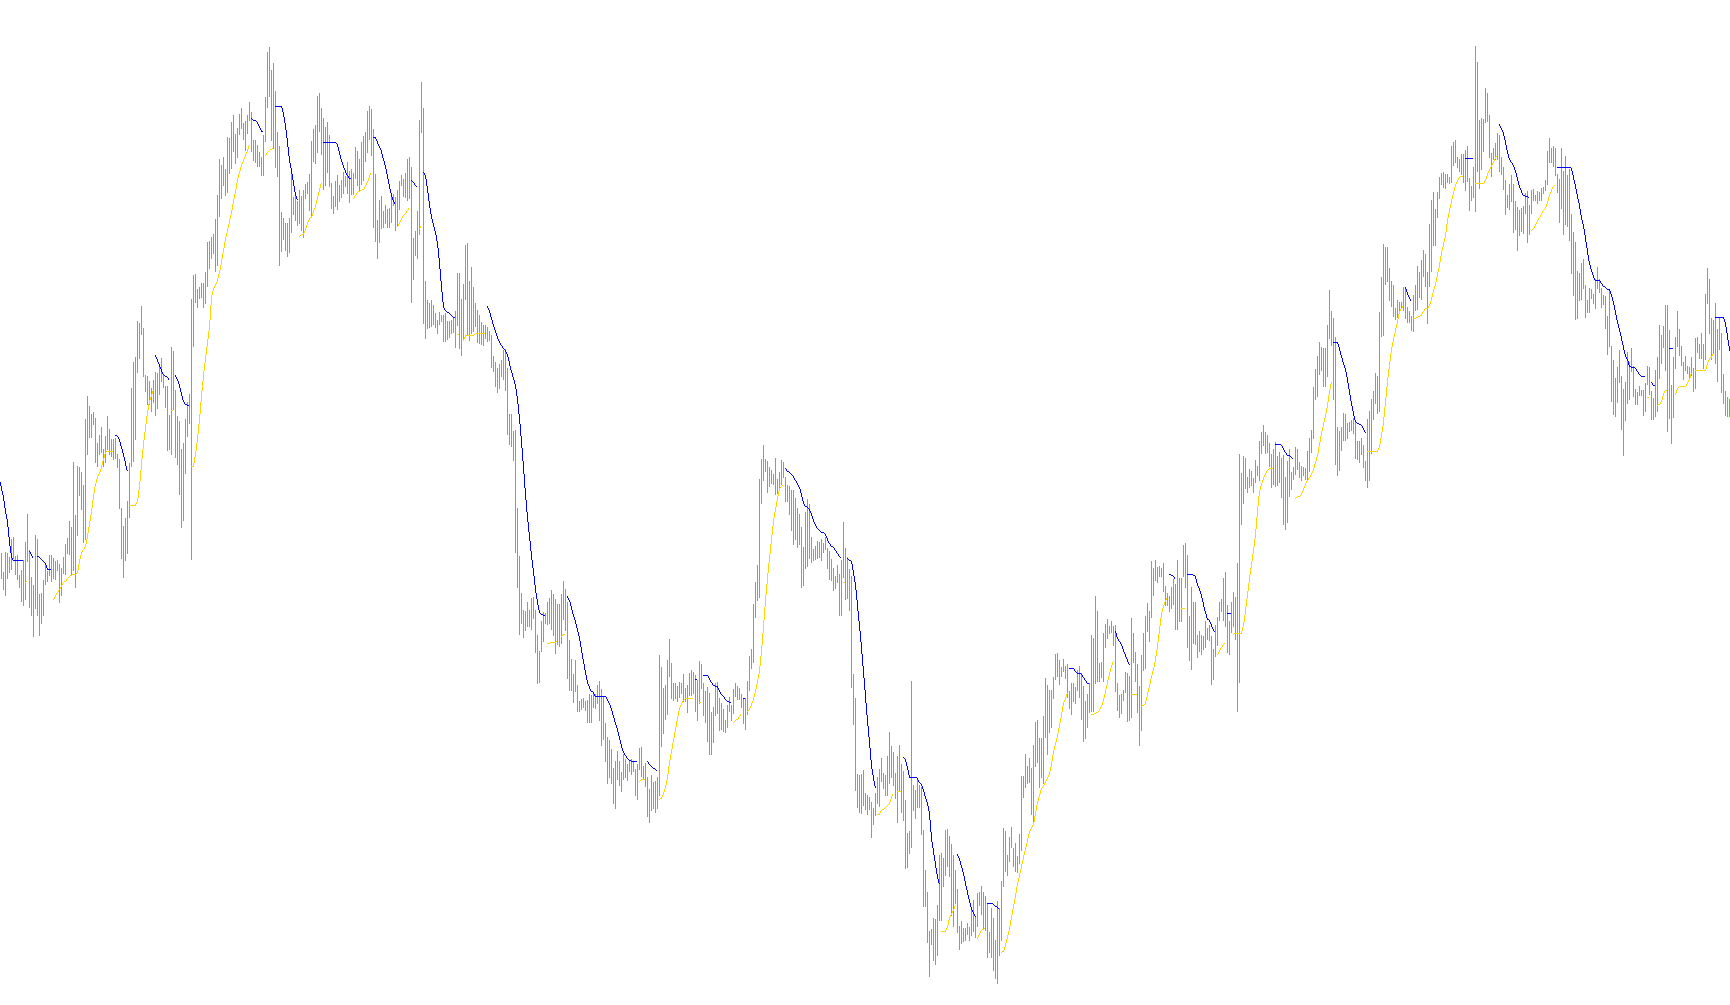
This indicator segments the price action into three distinct chronological phases by plotting synchronized Simple Moving Averages in a rotating sequential buffer.

thz42avc_5fbpbzqw9re2_dso3765ry_7wfccwand
Indicator

thz42avc_5fbpbzqw9re2_dso3765ry_7wfccwand

iMA

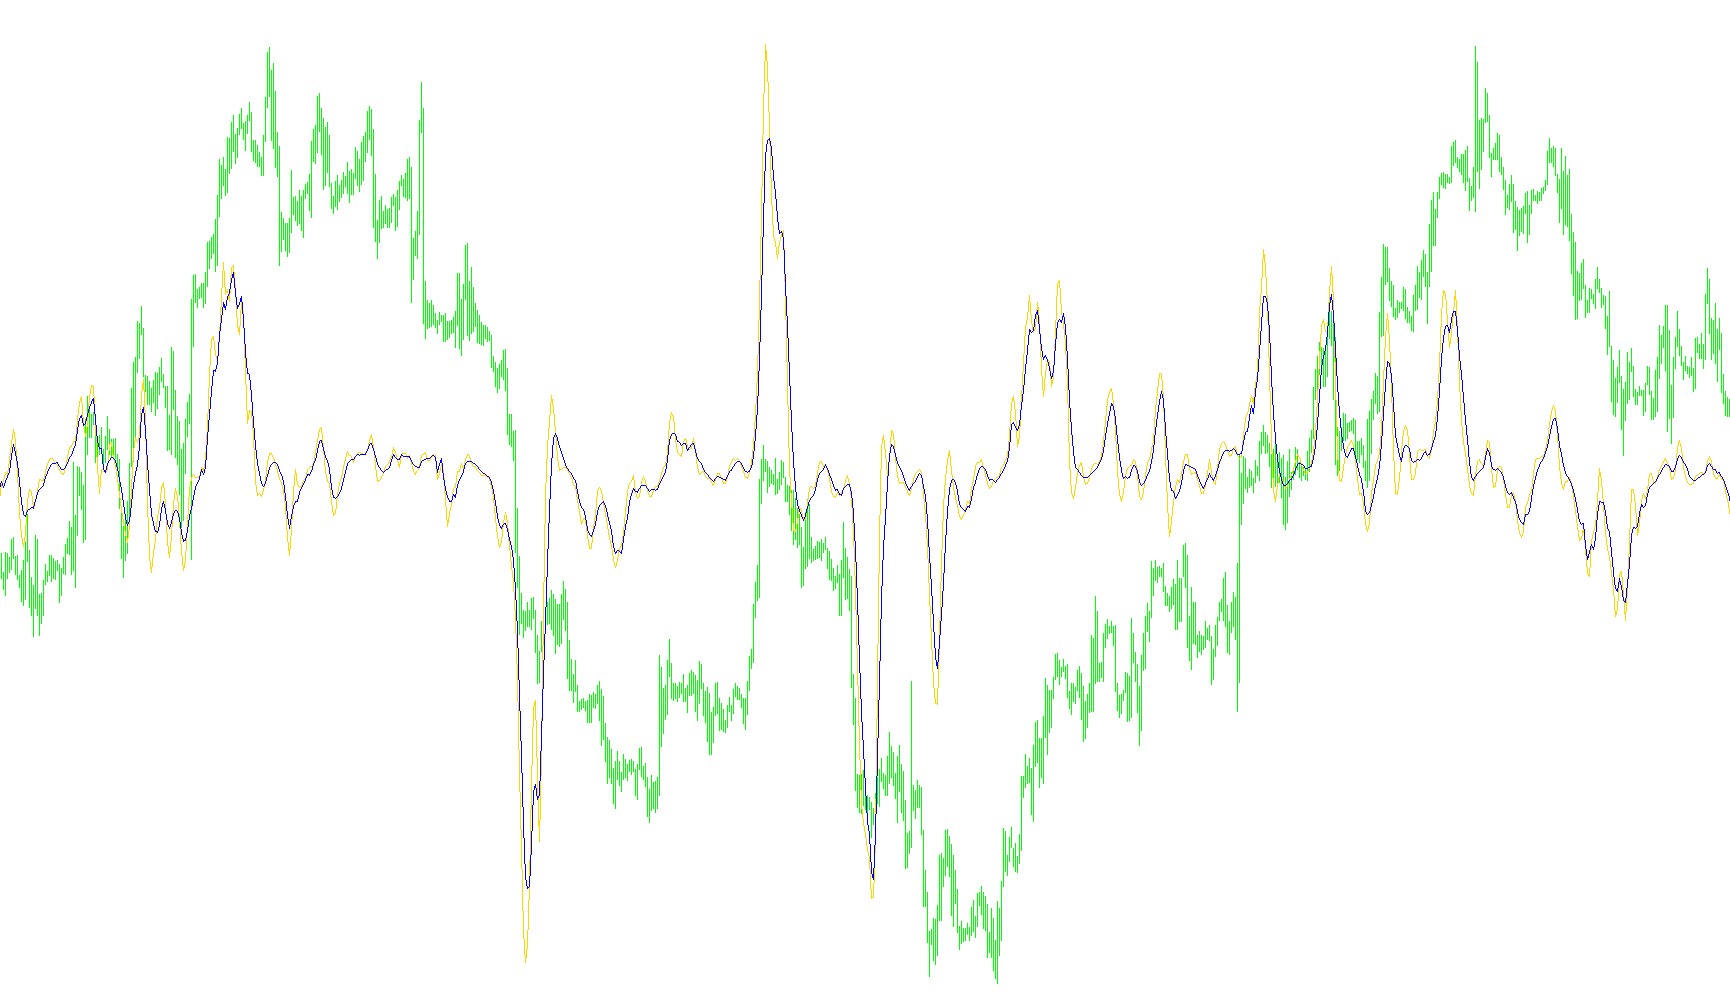
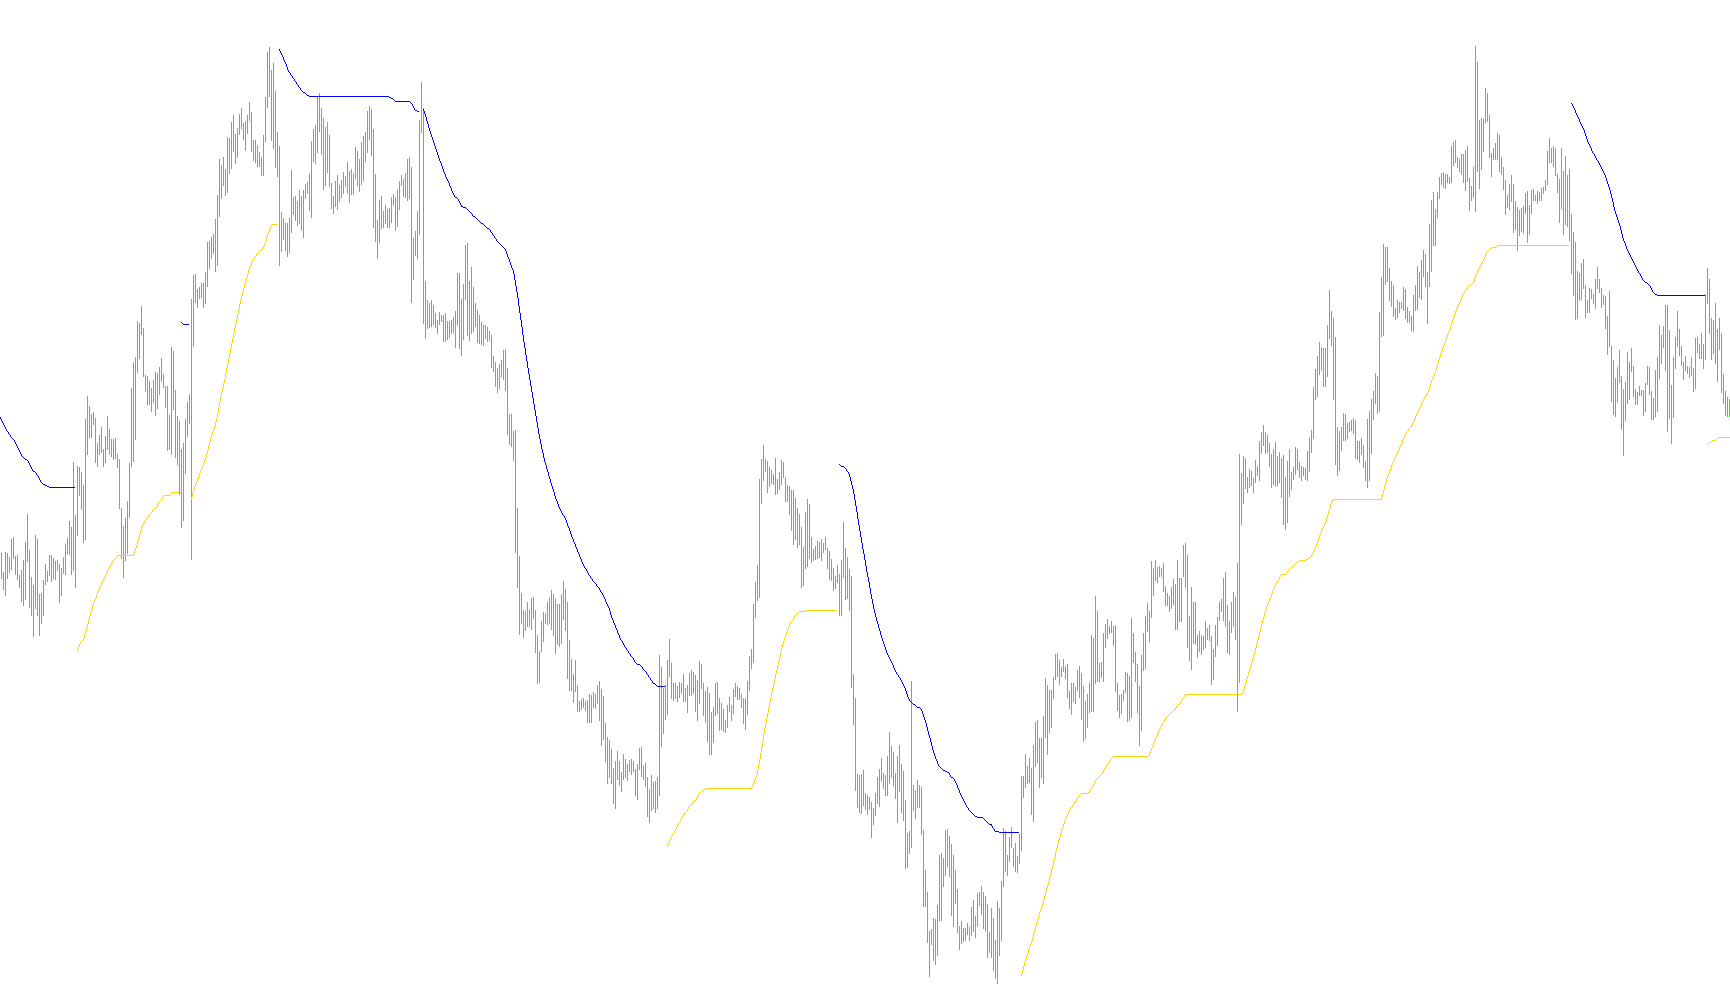
This indicator identifies market trend direction by calculating the maximum and minimum Simple Moving Average values over a multi-period window to establish upper and lower price boundaries.

TII_RLH
Indicator

TII_RLH

iMA

This indicator quantifies market momentum by calculating the percentage of positive versus negative price deviations relative to a long-term moving average.

TII_RLH1
Indicator

TII_RLH1

iMA

This indicator quantifies market momentum by calculating the ratio of positive to negative price deviations from a long-term moving average over a specified short-term window.

TII_RLH2
Indicator

TII_RLH2

iMA

This indicator measures market momentum by calculating the ratio of positive to negative price deviations from a long-term moving average over a secondary timeframe.

TII_RLH_v1
Indicator

TII_RLH_v1

iMA

This indicator quantifies market momentum by calculating the ratio of positive to negative price deviations relative to a long-term simple moving average.

TII_RLH_v2
Indicator

TII_RLH_v2

iMA

This indicator quantifies market momentum by calculating the ratio of positive to negative price deviations from a primary moving average over a secondary rolling window.

time to next bar
Indicator

time to next bar

iMACDiMA

This indicator identifies potential trend reversals by detecting MACD zero-line crossovers synchronized with Exponential Moving Average (EMA) distance thresholds.

Tipama
Indicator

Tipama

iMAiMAOnArray

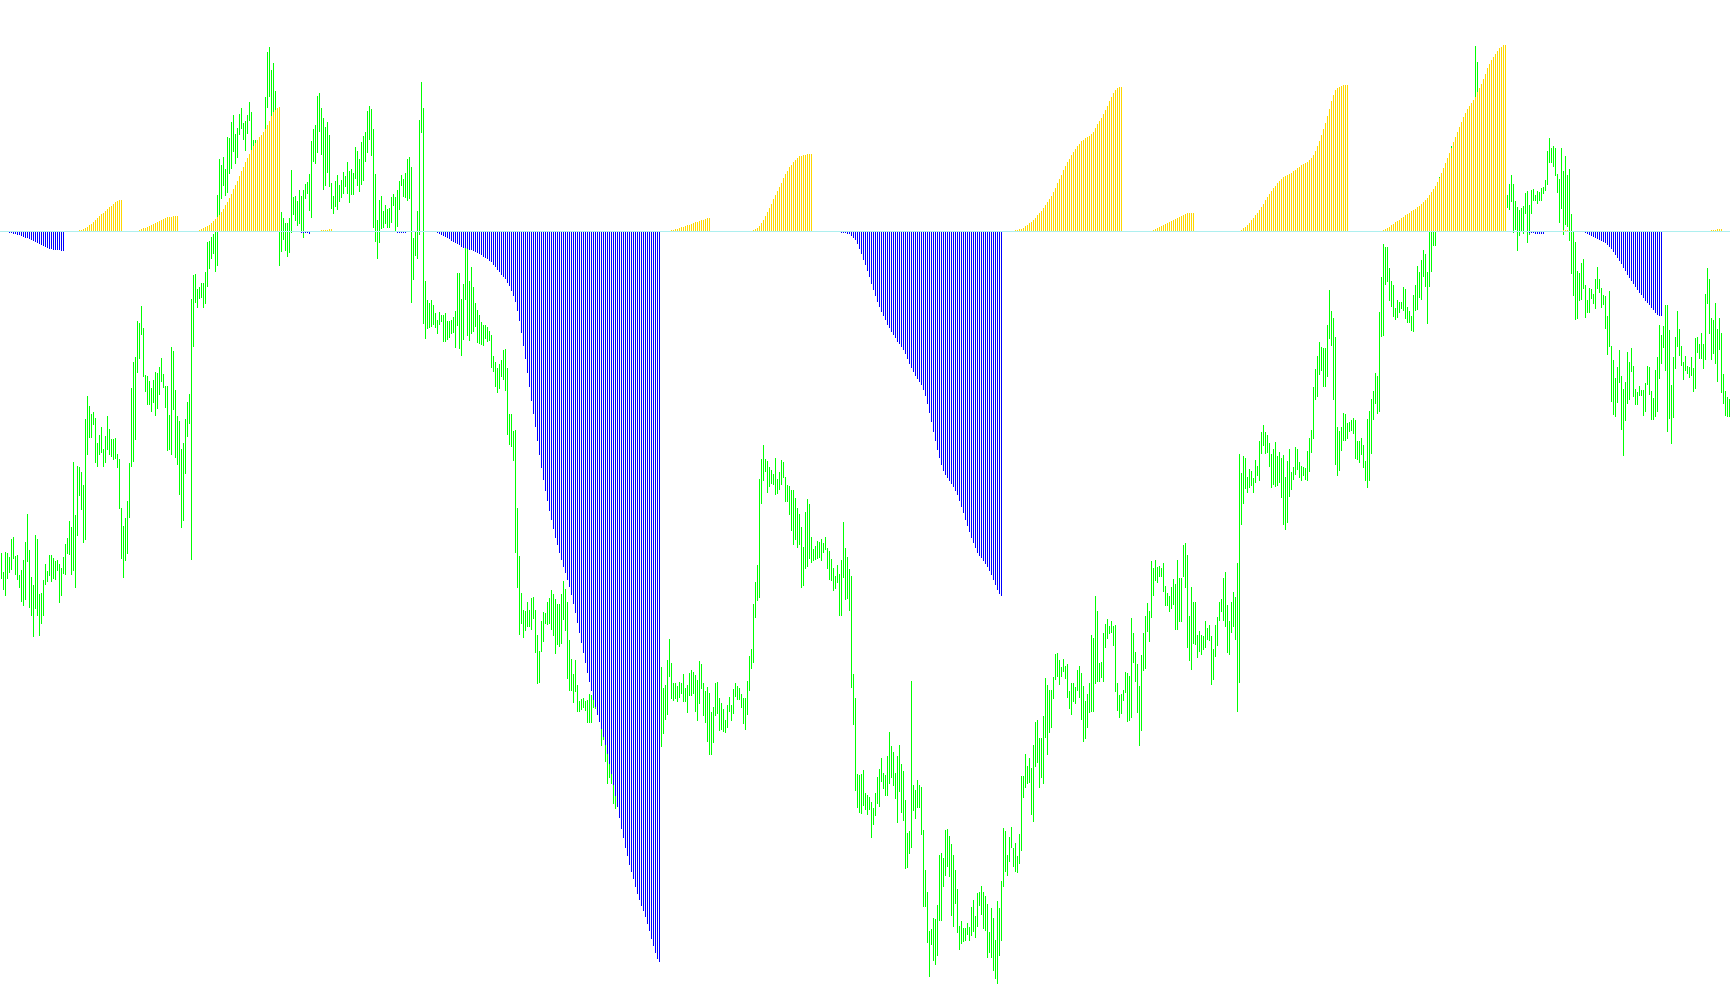
This indicator calculates the variance between twin exponential moving averages to derive a primary momentum oscillator, subsequently smoothed by a simple moving average to generate a reactive histogram of trend velocity.

TMAcentered
Indicator

TMAcentered

iMA

This indicator calculates a centered moving average by applying a triangular distribution of weights to price data, creating a balanced equilibrium curve.

tmagiq
Indicator

tmagiq

iADXiMAiMAOnArray

This indicator quantifies price volatility by calculating the absolute variance between three moving averages and scaling the resulting magnitude by the ADX directional difference.

tma_slope_nrp_alerts
Indicator

tma_slope_nrp_alerts

iMA

This MetaTrader indicator visualizes the trend and slope of a Triangular Moving Average (TMA) difference, highlighting potential divergence signals with histogram bars and optional arrows, and triggering alerts based on slope or trend changes.

TMLM-Channel-v2.2
Indicator

TMLM-Channel-v2.2

iMA

This indicator utilizes fractal high-low identification to construct multi-timeframe trend channels, providing dynamic price corridor visualizations and volatility-adjusted stop-loss calculations.

to_ind_Better_Bollinger_Bands
Indicator

to_ind_Better_Bollinger_Bands

iMA

This indicator utilizes a dual-layered recursive smoothing algorithm to calculate dynamic volatility bands based on the absolute deviation of price from a weighted moving average.

Indicator

Trader Dash Board

iMA
TradeSig
Indicator

TradeSig

iMA

This indicator visualizes the divergence between a standard simple moving average and an offset version to identify momentum shifts.

TradeSig_v2
Indicator

TradeSig_v2

iMA

This indicator quantifies the directional momentum by calculating the discrete difference between two shifted Simple Moving Averages based on typical price values.

TradeSig_v5
Indicator

TradeSig_v5

iMA

This indicator calculates a multi-stage smoothed exponential moving average derivative to identify price momentum shifts relative to a delayed trend baseline.

TradeSig_v6
Indicator

TradeSig_v6

iMA

This indicator calculates the directional variance between two distinct exponential moving average offsets and filters them through a multi-stage recursive smoothing algorithm to identify momentum shifts.

trafficlight_637
Indicator

trafficlight_637

iMA

This indicator evaluates price action relative to short and long Exponential Moving Averages across four distinct timeframes simultaneously to provide a synchronized directional sentiment signal.

Trailing
Indicator

Trailing

iMAiSAR

A versatile trade management utility providing seven distinct automated stop-loss adjustment methodologies, including moving average integration, parabolic SAR alignment, and multi-stage profit protection.

TrailingByMA
Indicator

TrailingByMA

iMA

This script automates risk management by dynamically adjusting the stop-loss level of a specific trade based on the real-time value of a customizable Moving Average with predefined buffer offsets.

TrailingFuncLib
Indicator

TrailingFuncLib

iATRiMA

A comprehensive suite of algorithmic risk management functions that execute dynamic stop-loss adjustments based on fractals, shadows, moving averages, ATR volatility, price channels, and time-based coefficients.

TrailingWithPartialClose
Indicator

TrailingWithPartialClose

iMAiSAR

An advanced trade management system featuring seven distinct trailing stop architectures including MA-based, Parabolic SAR, and multi-tiered lock-in logic with automated partial position liquidation.

Trand
Indicator

Trand

iMA

This indicator quantifies the rate of change and divergence between dual Exponential Moving Averages by calculating a weighted percentage of their spatial variance.

TRD
Indicator

TRD

iMA

This indicator quantifies price momentum by calculating the quotient of current closing prices relative to a customizable moving average.

TRD2
Indicator

TRD2

iMA

This indicator quantifies market momentum by calculating the quotient of current closing prices against a selected moving average basis.

Trend Bands
Indicator

Trend Bands

iMA

The logic calculates a central SMA line and projects symmetrical outer bands based on 3.5 times the average true range of high and low price deviations.

Trend Bands_v1
Indicator

Trend Bands_v1

iMA

This indicator maps a central exponential moving average and projects outer boundaries based on a multiplier of the historical price range variance.

Trend Manager
Indicator

Trend Manager

iMA

This indicator maps price extremes by quantifying the absolute distance between dual moving averages against a specific divergence threshold to highlight momentum expansion.

TREND-Cut-2
Indicator

TREND-Cut-2

iACiMA

This indicator aggregates directional bias from multiple moving average slopes across three distinct timeframes and incorporates Awesome Oscillator trend shifts to calculate a weighted percentage of bullish and bearish sentiment.

Trend-Table-1v1
Indicator

Trend-Table-1v1

iWPRiMAiSAR

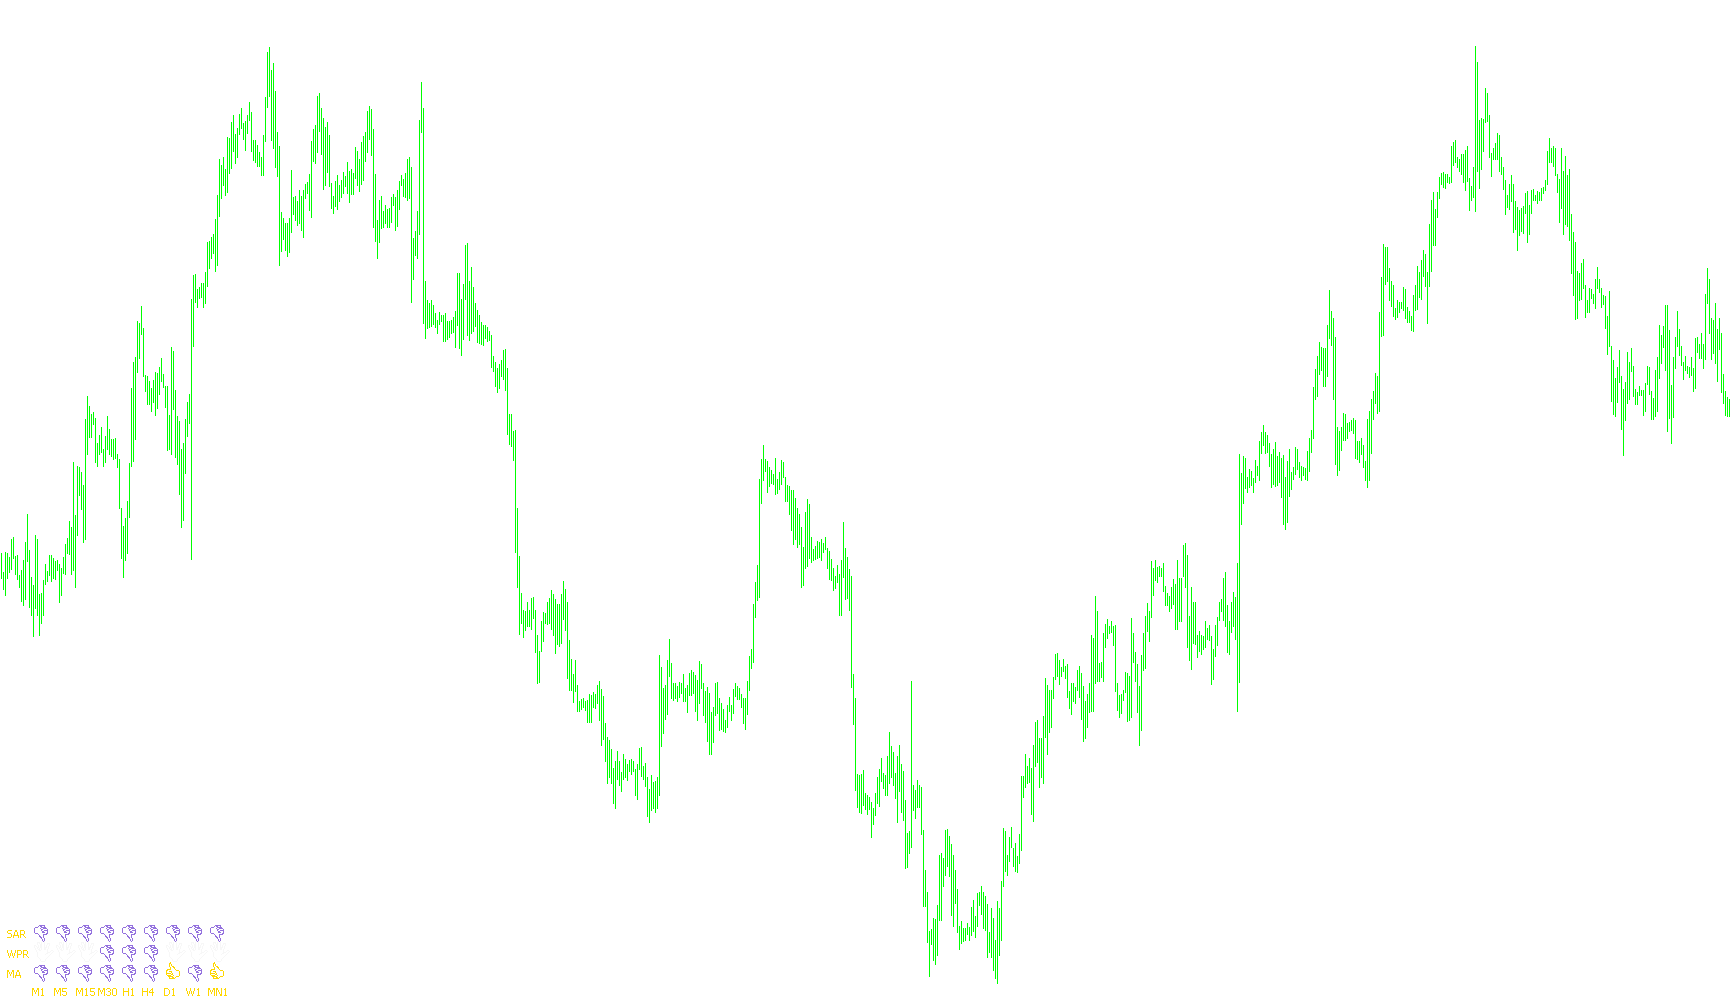
A comprehensive dashboard that visualizes concurrent trend strength and momentum signals across nine timeframes using Moving Average crossovers, Williams Percent Range extremes, and Parabolic SAR positionings.

TrendArea
Indicator

TrendArea

iMA

This indicator quantifies price trend intensity by accumulating the absolute variance between dual moving averages weighted by a cumulative progression counter triggered by crossovers.

TrendEMA - Display Trend And MA Values
Indicator

TrendEMA - Display Trend And MA Values

iMA

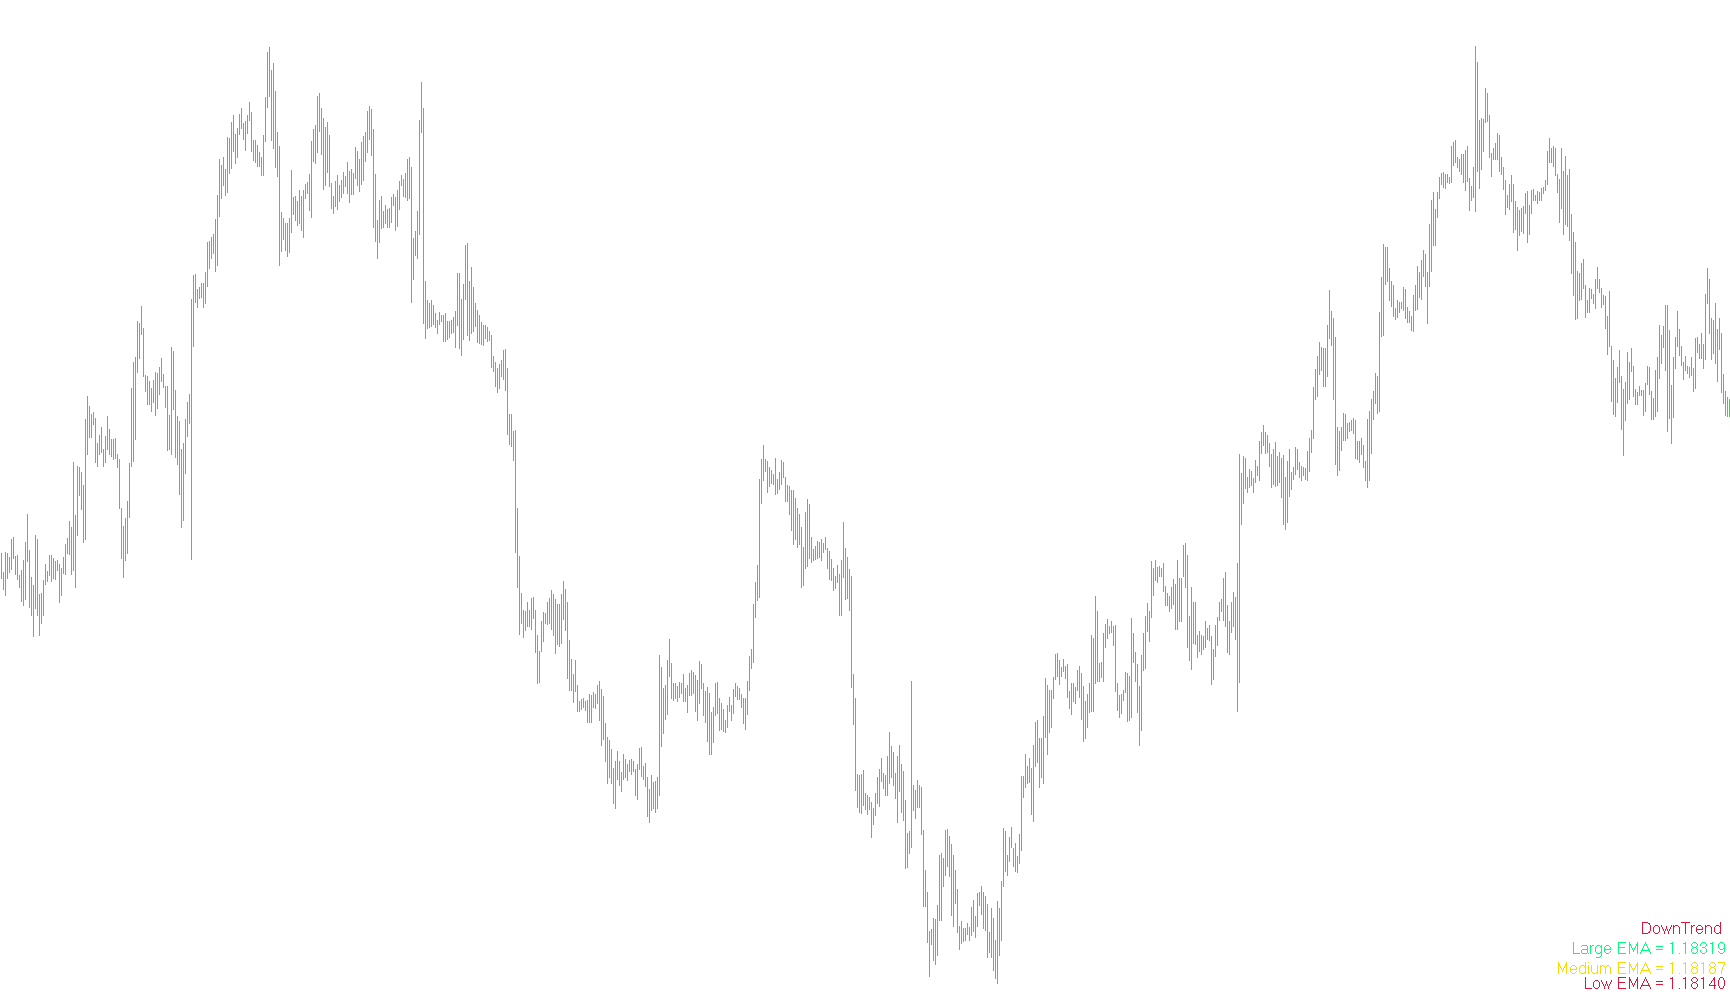
This indicator evaluates the relative sequential alignment of three distinct Exponential Moving Averages to dynamically categorize market behavior into upward, downward, or neutral trends.

TrendEMA
Indicator

TrendEMA

iMA

Determines market momentum by analyzing the sequential alignment of three distinct Exponential Moving Average periods to identify bullish, bearish, or equilibrium states.

TrendEMA_V_1
Indicator

TrendEMA_V_1

iMA

This indicator dynamically identifies market direction by evaluating the sequential stacking order of three distinct Exponential Moving Averages and displays real-time numerical values on the chart.

TrendEMA_V_1_001
Indicator

TrendEMA_V_1_001

iMA

This indicator identifies bullish, bearish, or sideways market conditions by evaluating the relative stacking order of three distinct Exponential Moving Averages and displays their real-time values on a customizable dashboard.
TrendEnvelopes_v1
Indicator

TrendEnvelopes_v1

iATRiMA

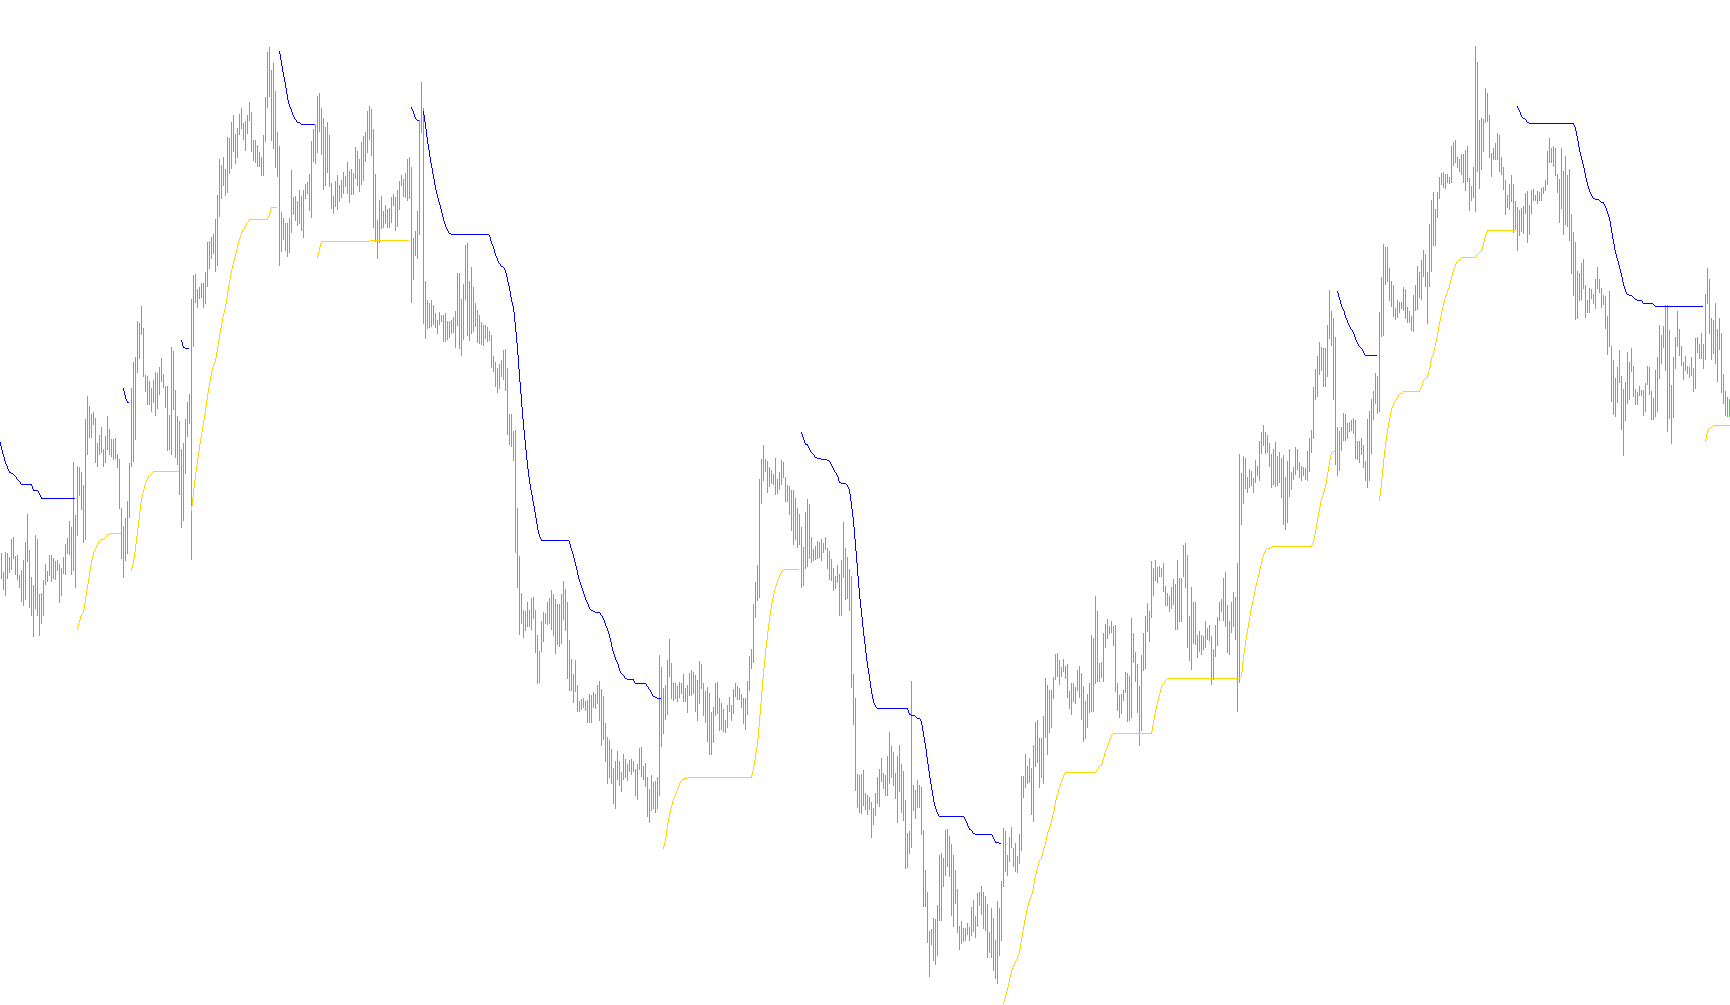
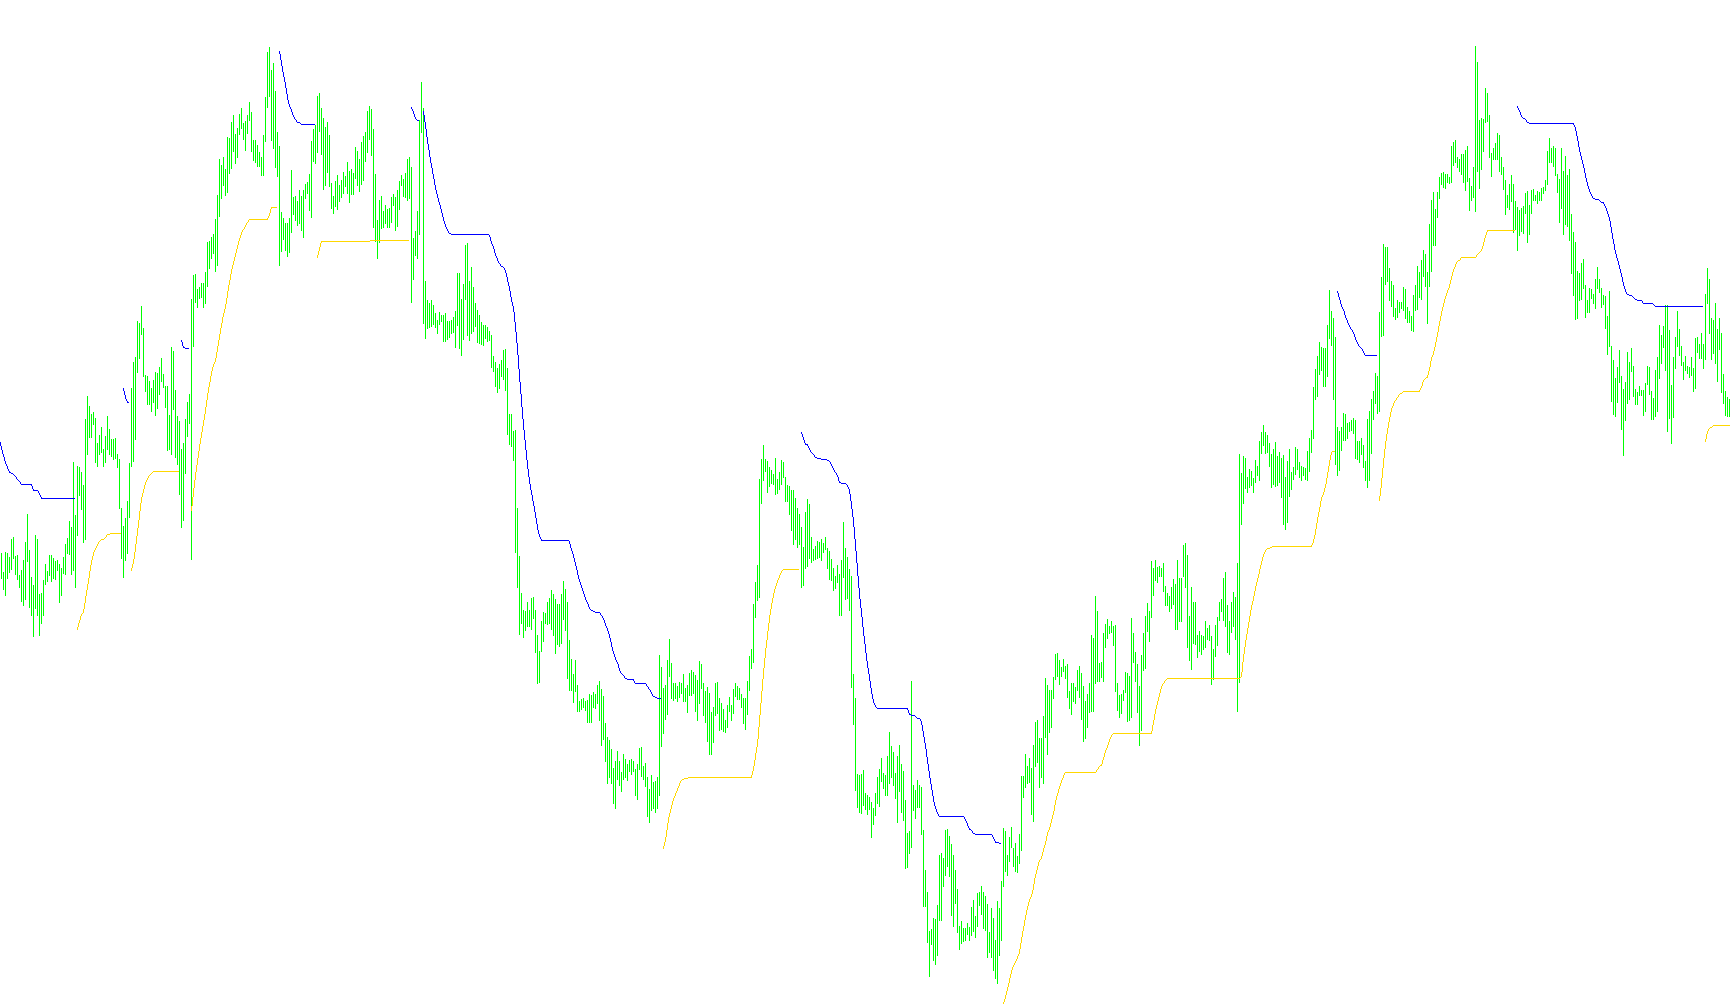
This indicator identifies structural momentum by projecting boundary offsets from a moving average and capturing trend reversals via price breaches of these evolving volatility levels.

TrendEnvelopes_v1[1].1
Indicator

TrendEnvelopes_v1[1].1

iATRiMA

This indicator identifies directional shifts by monitoring price breaches of moving average extremes and plotting trailing trend boundaries.

TrendEnvelopes_v1_Alert
Indicator

TrendEnvelopes_v1_Alert

iATRiMA

This indicator identifies momentum shifts by monitoring price breakouts against a moving average variance band, utilizing recursive trend persistence to filter noise and generate entry signals.

TrendEnvelopes_v1_v1
Indicator

TrendEnvelopes_v1_v1

iATRiMA

This indicator identifies directional shifts by tracking price breakouts relative to moving average boundaries and utilizes an ATR-based signal mechanism to pinpoint trend reversals.

TrendEnvelopes_v1_v3
Indicator

TrendEnvelopes_v1_v3

iATRiMA

This indicator identifies trend direction by monitoring price breakouts relative to an expanding moving average corridor and plots trailing support or resistance levels based on recursive extremes.

TrendEnvelopes_v2
Indicator

TrendEnvelopes_v2

iATRiMA

The indicator identifies market direction by monitoring price breaches of moving average deviations and plots trailing support/resistance levels based on previous local extremes.

TrendEnvelopes_v2Alert
Indicator

TrendEnvelopes_v2Alert

iATRiMA

This indicator identifies momentum shifts by monitoring price breaches of percentage-based volatility bands derived from a smoothed moving average.

TrendEnvelopes_v2_001
Indicator

TrendEnvelopes_v2_001

iMA

This indicator identifies trend shifts by tracking price breakouts from high and low moving average boundaries, plotting recursive support and resistance levels.

TrendEnvelopes_v2_v1
Indicator

TrendEnvelopes_v2_v1

iATRiMA

This indicator identifies market momentum by plotting dynamic price boundaries based on moving average deviations and tracking trend reversals via price breaches of these envelopes.

TrendEnvelopes_v5
Indicator

TrendEnvelopes_v5

iMA

This indicator identifies market direction by tracking price breaches against high and low moving averages to plot trailing trend boundaries and momentum shift signals.

TrendEnvelopes_v5_001
Indicator

TrendEnvelopes_v5_001

iMA

This indicator identifies trend shifts by tracking price breaches of moving average high-low extremes and plotting evolving support/resistance envelopes.