rsi_ma_trade_sist_chart
Indicator

rsi_ma_trade_sist_chart

iATRiMAiRSI

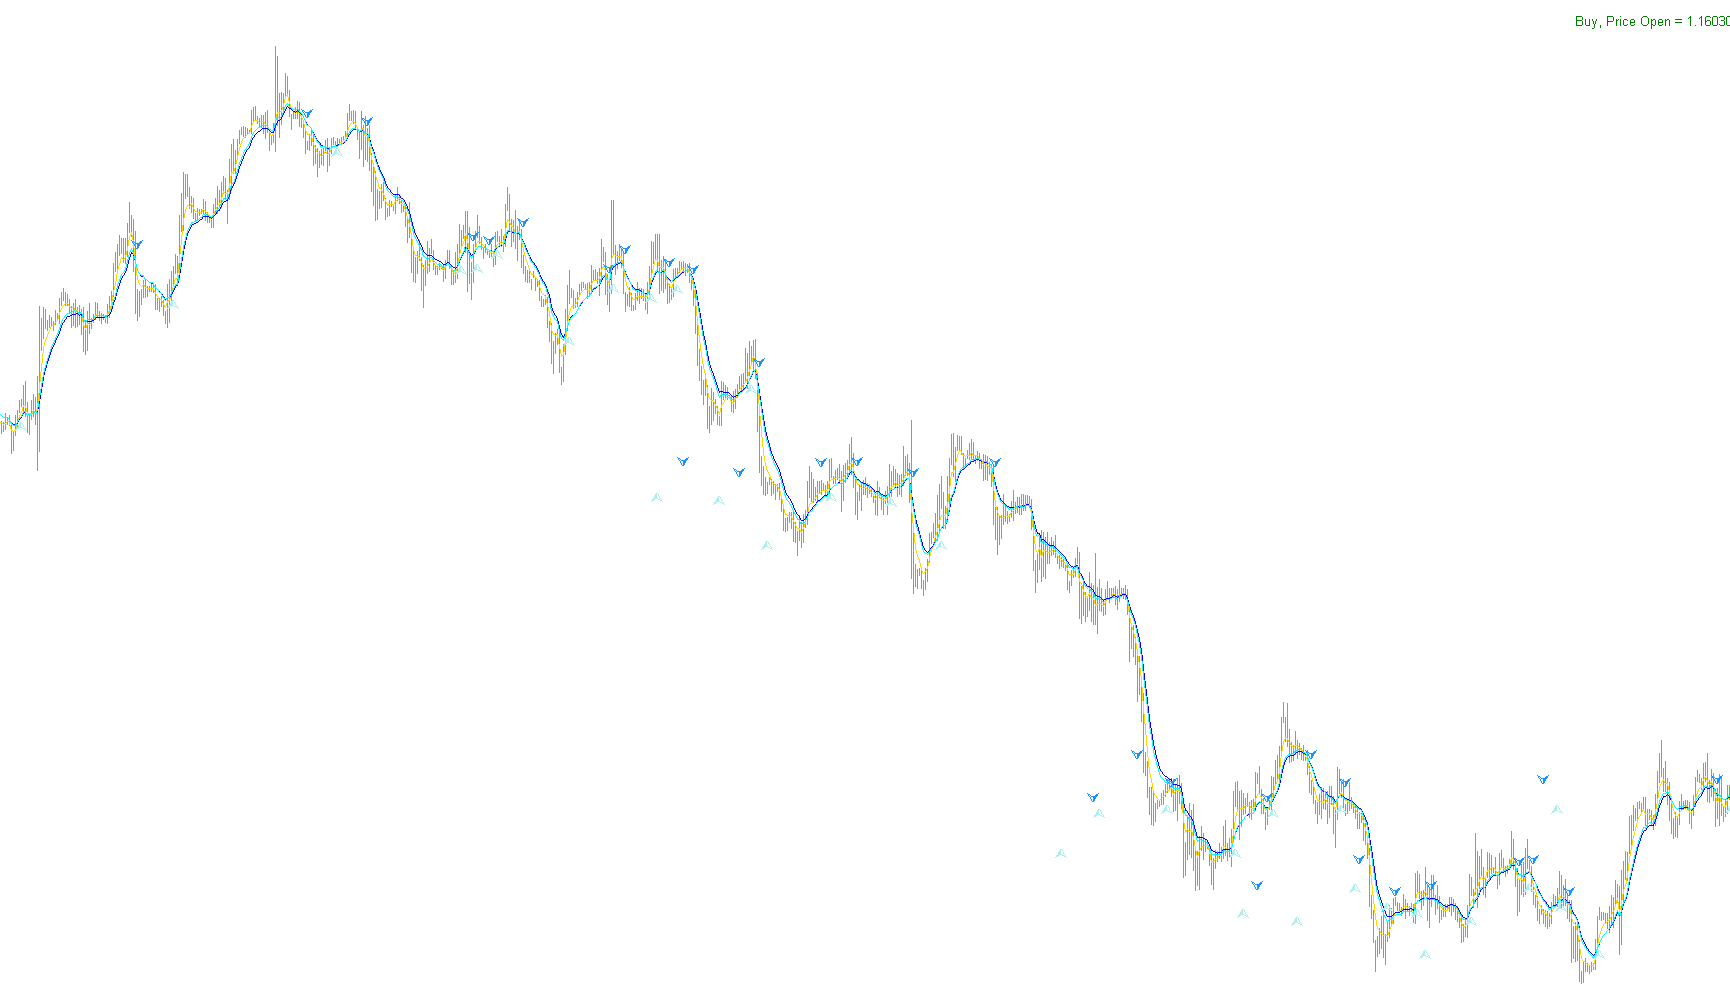
This indicator identifies trend reversals by detecting crossovers between a fast and slow exponential moving average synchronized with Relative Strength Index momentum thresholds.

RSI_on_MA_2X2_mtf
Indicator

RSI_on_MA_2X2_mtf

iMAiRSIOnArray

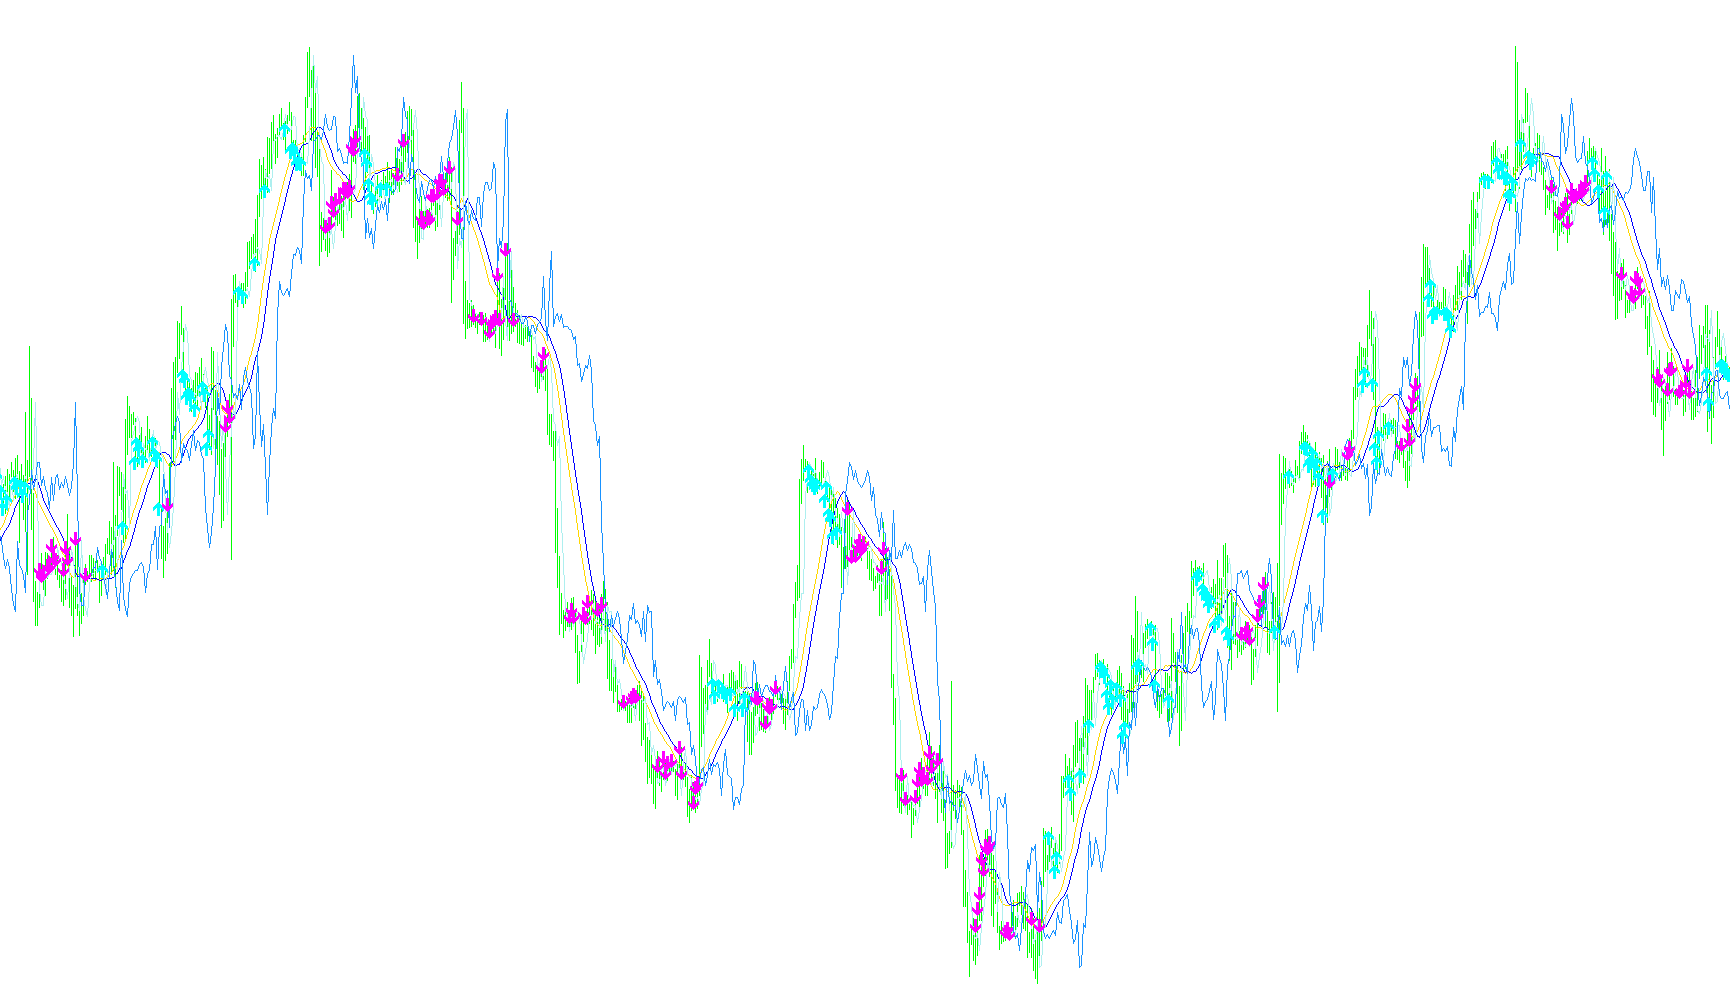
This indicator calculates dual Relative Strength Index values derived from smoothed moving average data across multiple timeframes to identify momentum shifts.

Rsi_R2_Opt_Indicator
Indicator

Rsi_R2_Opt_Indicator

iMAiMAOnArrayiRSI

This indicator identifies directional momentum by verifying sequential RSI growth/decay against a moving average trend, optionally filtered by Hull Moving Average velocity.

RSI_Strike(AM)_SW
Indicator

RSI_Strike(AM)_SW

iMAiRSI

This indicator identifies momentum shifts by calculating moving average differences and flagging specific crossover events across a multi-layered RSI grid.

RSL1
Indicator

RSL1

iMA

This indicator visualizes price action momentum by mapping historical Exponential Moving Average trend shifts onto a vertical coordinate system based on the asset's extreme price range.

Indicator

RS_FRASMA

iMA
ryan_jones_sm
Indicator

ryan_jones_sm

iMA

The indicator identifies reversal signals by evaluating the convergence of historical moving average shifts against specific price action boundaries from two distinct historical offsets.

r_Gator
Indicator

r_Gator

iMA

This indicator calculates a multi-dimensional average by synthesizing twenty-eight distinct moving average variations across three different time periods to identify dominant price trends.

S-RoC
Indicator

S-RoC

iMA

This indicator quantifies the relative percentage change between two distinct exponential moving average values separated by a fixed period interval.

sAccelerator
Indicator

sAccelerator

iMAiMAOnArray

This indicator identifies trend reversals by calculating the differential between a fast moving average and its own signal line to detect shifts in price velocity.

Sashken_v2
Indicator

Sashken_v2

iMA

Identifies trend reversal opportunities by detecting divergent crossovers between dual short-term smoothed averages and long-term simple price actions.

SCCI
Indicator

SCCI

iMA

Quantifies the relative distance of current typical price from its moving average normalized by the mean absolute deviation over a specified period.

Schaff Trend CD
Indicator

Schaff Trend CD

iMAiMAOnArray

This indicator calculates a secondary exponential moving average applied specifically to the difference between two fast and slow exponential moving averages.

Schaff Trend Cycle 1
Indicator

Schaff Trend Cycle 1

iMA

This indicator synthesizes an EMA-based MACD with smoothed Cauchy Distribution and dual-layered Stochastic processing to identify high-velocity trend cycles.

Schaff Trend Cycle
Indicator

Schaff Trend Cycle

iMA

This indicator calculates a smoothed momentum cycle by normalizing the difference between dual exponential moving averages into a percentage-based oscillator.

Indicator

Schaff Trend Cycletest

iMA
Schaff Trend Cycletest1
Indicator

Schaff Trend Cycletest1

iMA

This indicator calculates a smoothed trend cycle by applying a recursive smoothing constant to a normalized difference between two exponential moving averages.

Schaff Trend Cycle_001
Indicator

Schaff Trend Cycle_001

iMA

This algorithm calculates a normalized cycle of price momentum by mapping the spread between dual exponential moving averages into a periodic stochastic range.

Schaff Trend Cycle_v1
Indicator

Schaff Trend Cycle_v1

iMA

This indicator normalizes the spread between two exponential moving averages into a cyclical percentage oscillator to identify momentum shifts and trend exhaustion.

Schaff Trend s
Indicator

Schaff Trend s

iMAiMAOnArray

This indicator quantifies trend momentum by calculating a smoothed percentage of the distance between two exponential moving averages relative to their recent range.

Indicator

Schaff Trend

iMA
Indicator

Schaff Trend_001

iMA
Indicator

Schaff Trend_002

iMA
Indicator

Schaff Trend_v1

iMA
Indicator

Schaff Trend_v2

iMA
SchaffTrendCycle1
Indicator

SchaffTrendCycle1

iMA

This indicator synthesizes momentum by applying successive layers of stochastic normalization and exponential smoothing to the difference between fast and slow moving averages.

SchaffTrendCycle1Test
Indicator

SchaffTrendCycle1Test

iMA

This indicator derives a smooth trend cycle by applying nested stochastic transformations over a smoothed MACD signal to identify exhaustion points and momentum shifts.

Indicator

schaff_Plot_dcec

iMA
Indicator

Schaff_Trend_Cycle1cd_mtf

iMAiMAOnArray
Schaff_Trend_Cycle2
Indicator

Schaff_Trend_Cycle2

iMA

This indicator normalizes the velocity of price momentum by calculating the relative position of the Moving Average Cross Difference within a defined rolling window.

Schaff_Trend_Cycle2Test
Indicator

Schaff_Trend_Cycle2Test

iMA

This indicator identifies trend cycles by normalizing the distance between short and long exponential moving averages into a bounded oscillator, smoothed by a recursive coefficient.
Schaff_Trend_Cycletes
Indicator

Schaff_Trend_Cycletes

iMA

This indicator calculates a normalized momentum percentage by comparing the spread between short and long exponential moving averages against their local extremes within defined rolling windows.
Schaff_Trend_Cycletes1
Indicator

Schaff_Trend_Cycletes1

iMA

This indicator normalizes the variance between dual exponential moving averages into a percentage-based cycle to identify overextended price extremes and rhythmic trend reversals.

Schaff_Trend_Cycletes2
Indicator

Schaff_Trend_Cycletes2

iMA

This indicator calculates the percentage position of the difference between two exponential moving averages relative to its highest and lowest range over a rolling cycle.

Schaff_Trend_CycletesX
Indicator

Schaff_Trend_CycletesX

iMA

This indicator calculates a normalized stochastic cycle based on the distance between two exponential moving averages to identify momentum shifts and overbought or oversold price extremes.

Schaff_Trend_Cycle_-_adjustable_smoothing
Indicator

Schaff_Trend_Cycle_-_adjustable_smoothing

iMA

This indicator computes a double-smoothed stochastic cycle by applying sequential momentum filtering to MACD values, providing a smoothed trend velocity signal with multi-timeframe interpolation.

Indicator

Schaff_Trend_Cycle_mtf

iMA
SD Channels
Indicator

SD Channels

iMAiStdDev

This indicator projects dual-layered price boundaries by calculating standard deviation offsets from multiple linear weighted moving averages to visualize market expansion and contraction.

SDL_MAM
Indicator

SDL_MAM

iMAiMAOnArray

This indicator calculates a second-order difference of Weighted Moving Averages to identify directional shifts and visualizes momentum transitions via distinct trend buffers.

Seddboy30MA
Indicator

Seddboy30MA

iMA

This indicator monitors real-time price action relative to a 30-period simple moving average to trigger audible, visual, and email notifications upon trend crossovers.

SelfAdjustRSI_v1
Indicator

SelfAdjustRSI_v1

iMA

This indicator calculates a smoothed Relative Strength Index while dynamically determining overbought and oversold thresholds based on the standard deviation of RSI fluctuations.

sell zone fibs
Indicator

sell zone fibs

iMA

This indicator projects multiple equidistant price offsets below a user-defined moving average to identify potential bearish supply zones.

sell zone fibs_v1
Indicator

sell zone fibs_v1

iMA

This indicator projects seven distinct price zones downward from a selected moving average to identify potential bearish reversal levels.

Sem BearsBulls
Indicator

Sem BearsBulls

iBearsPoweriBullsPoweriMA

This indicator identifies structural trend shifts by synchronizing the directional slope of moving averages with the relative power fluctuations of bullish and bearish momentum oscillators.

Sem Black
Indicator

Sem Black

iMAiRSI

This indicator identifies high-probability reversal zones by detecting synchronized momentum shifts between an exponential moving average crossover and extreme Relative Strength Index levels.

Sem Force
Indicator

Sem Force

iMAiMAOnArray

This indicator calculates a normalized sentiment score by comparing current price action against six concurrent moving average layers to identify trend acceleration and momentum shifts.

Sem MACross
Indicator

Sem MACross

iMA

This indicator visualizes bullish and bearish sentiment by generating a histogram based on the relative positioning of a fast and slow moving average crossover.

Sem Sidus
Indicator

Sem Sidus

iMA

This indicator categorizes market sentiment into four distinct states by analyzing the relative positioning and convergence of two sets of dual moving averages.

SeNSetiVe
Indicator

SeNSetiVe

iMA

This indicator quantifies market momentum by calculating the weighted variance between open-close price averages and extreme high-low pivots, scaled by instantaneous trading volume.

several_moving_average
Indicator

several_moving_average

iMA

This indicator renders five independent moving average overlays on a single chart, allowing for simultaneous visualization of diverse smoothing methods and periods.