Synergy Signals [v2]
Indicator

Synergy Signals [v2]

iMAOnArrayiMAiRSI

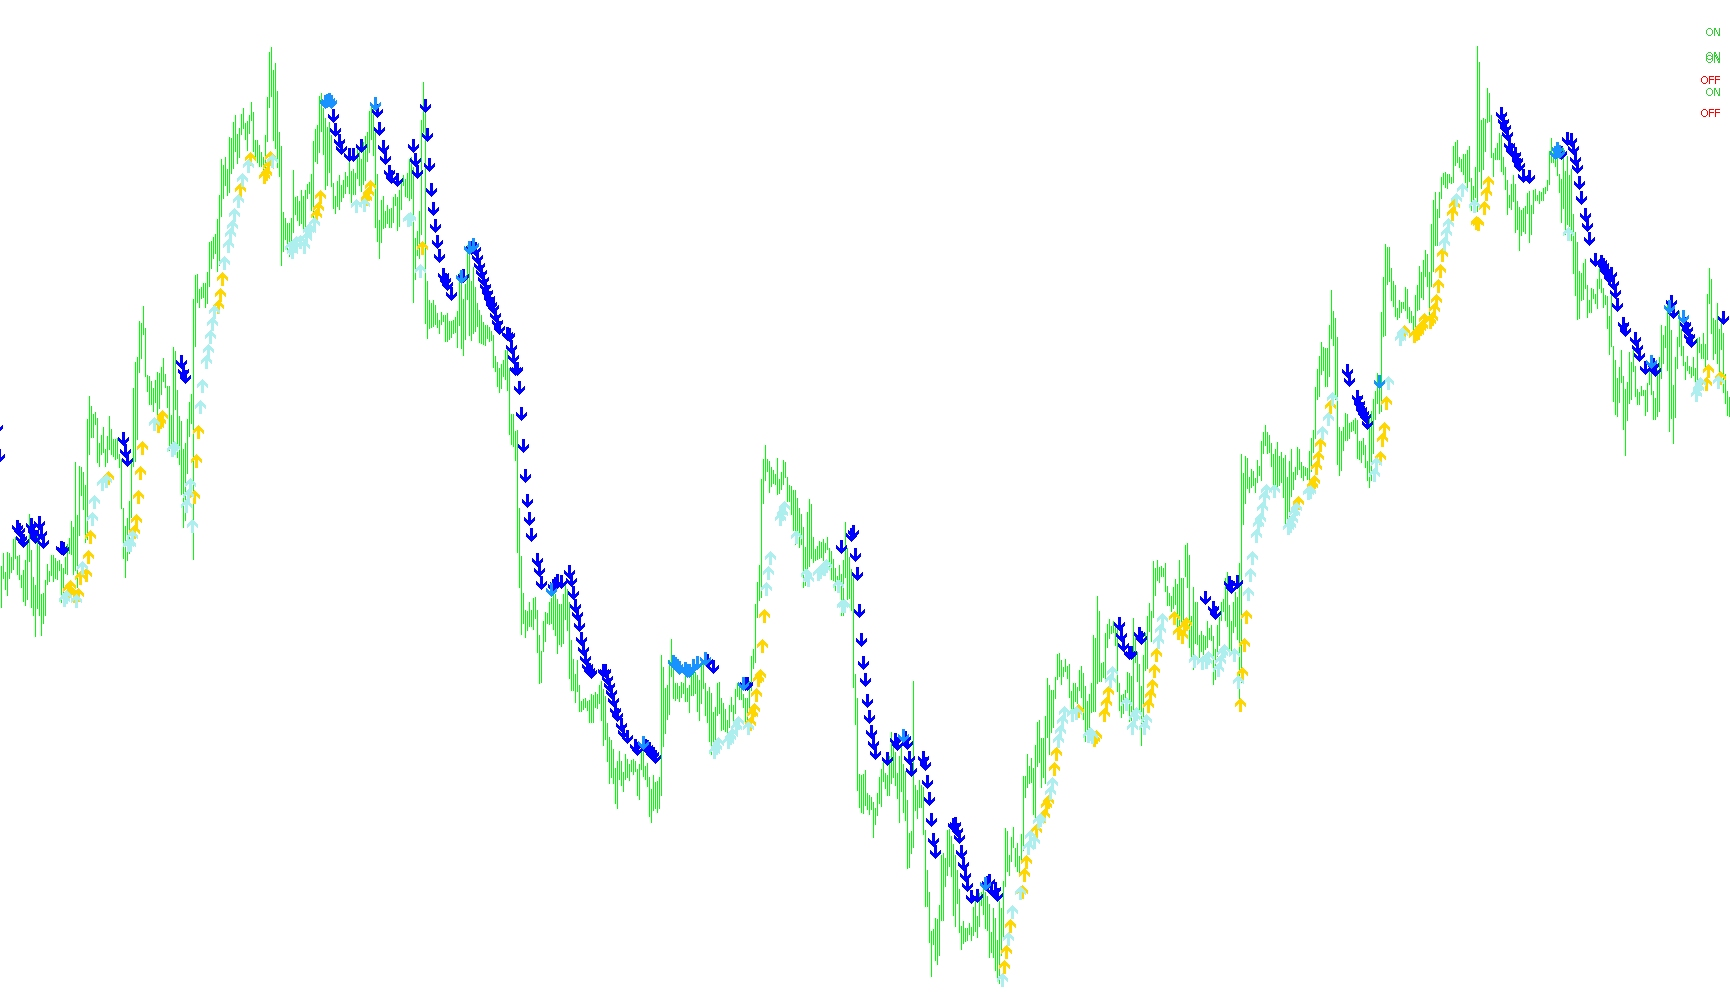
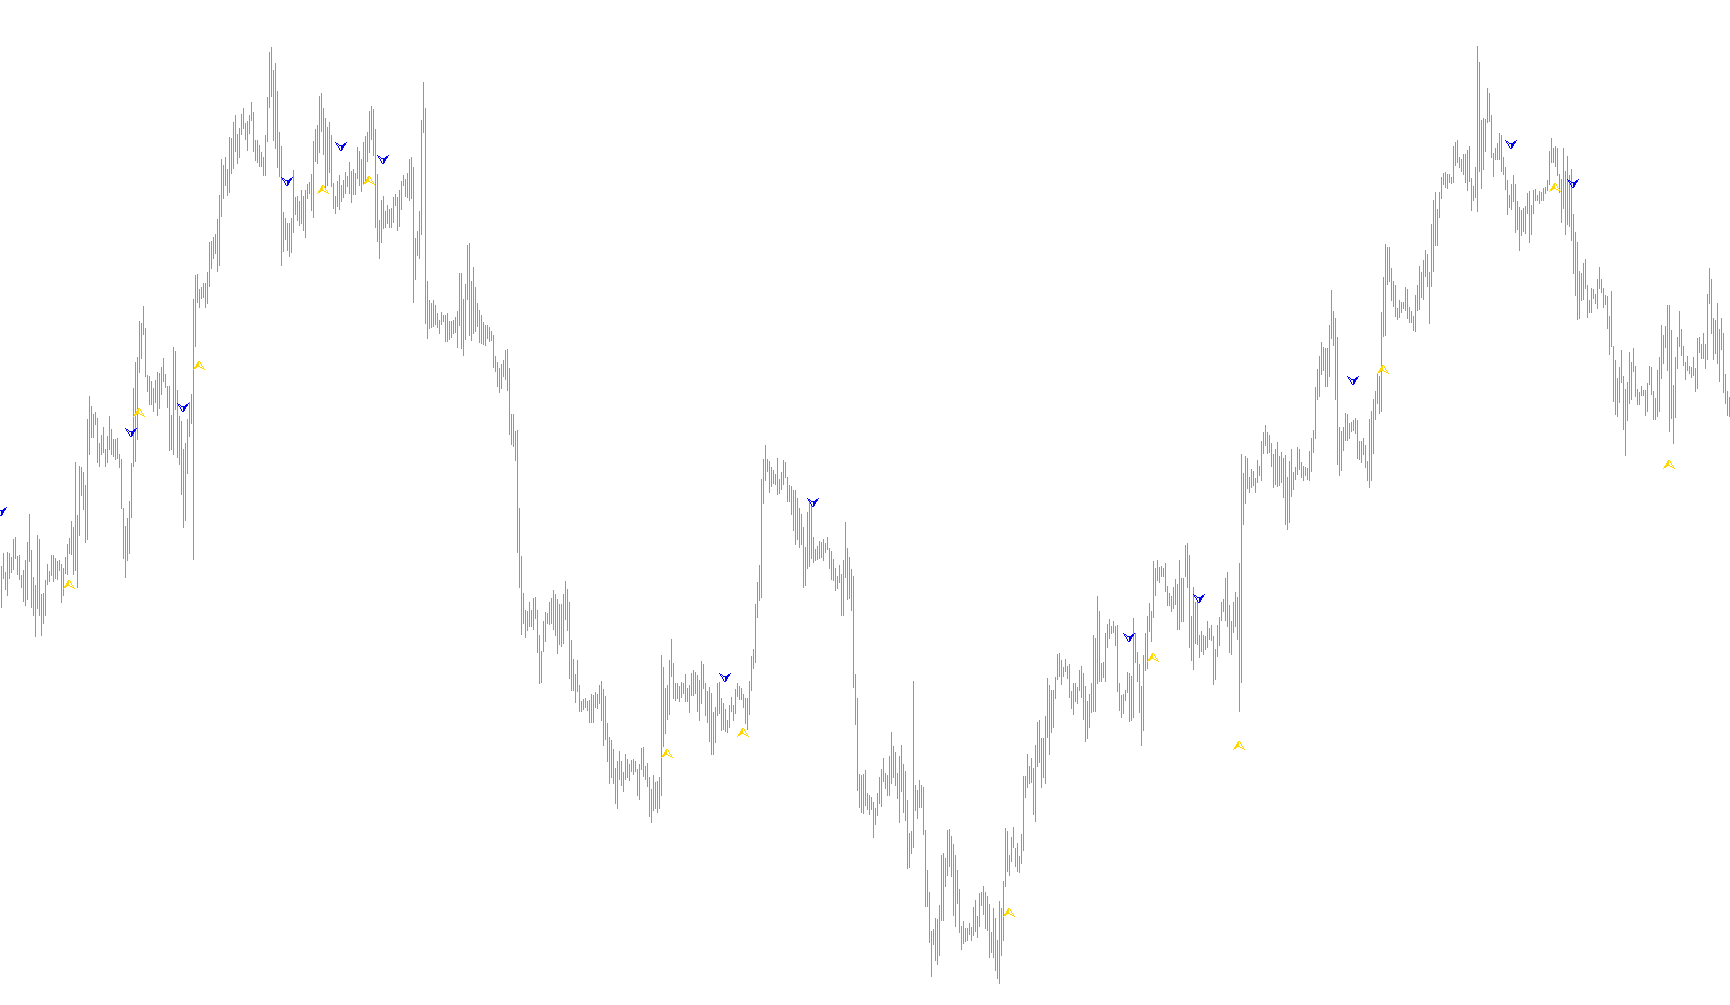
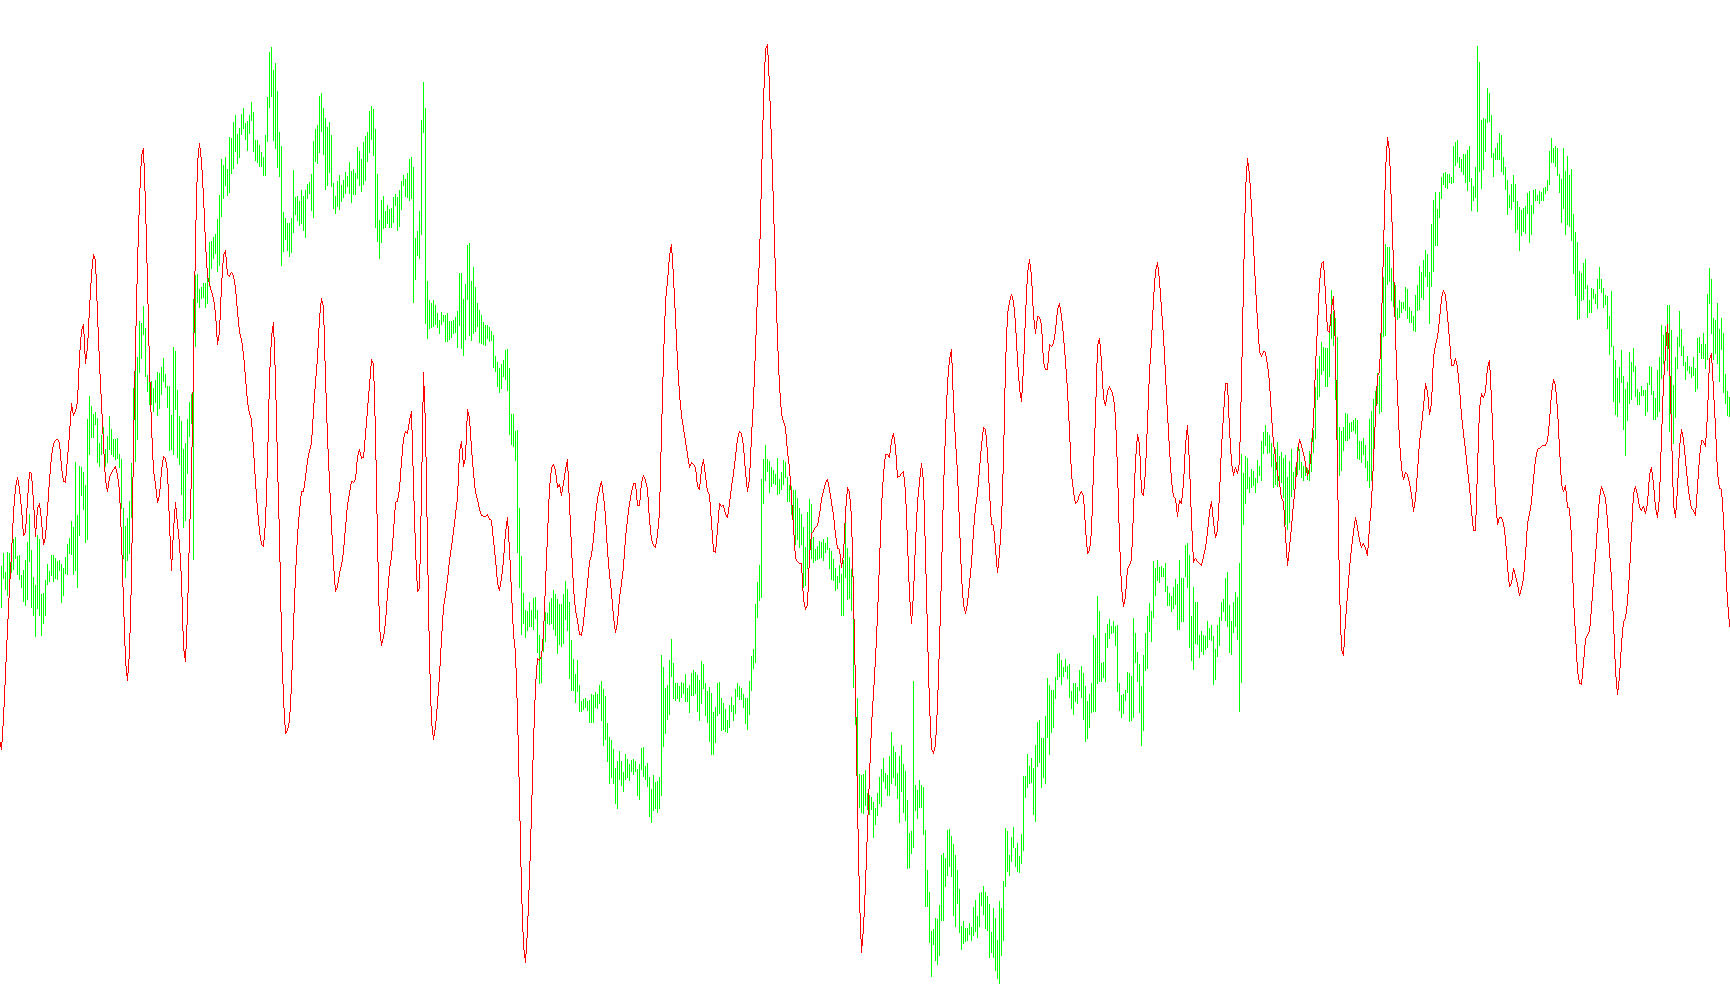
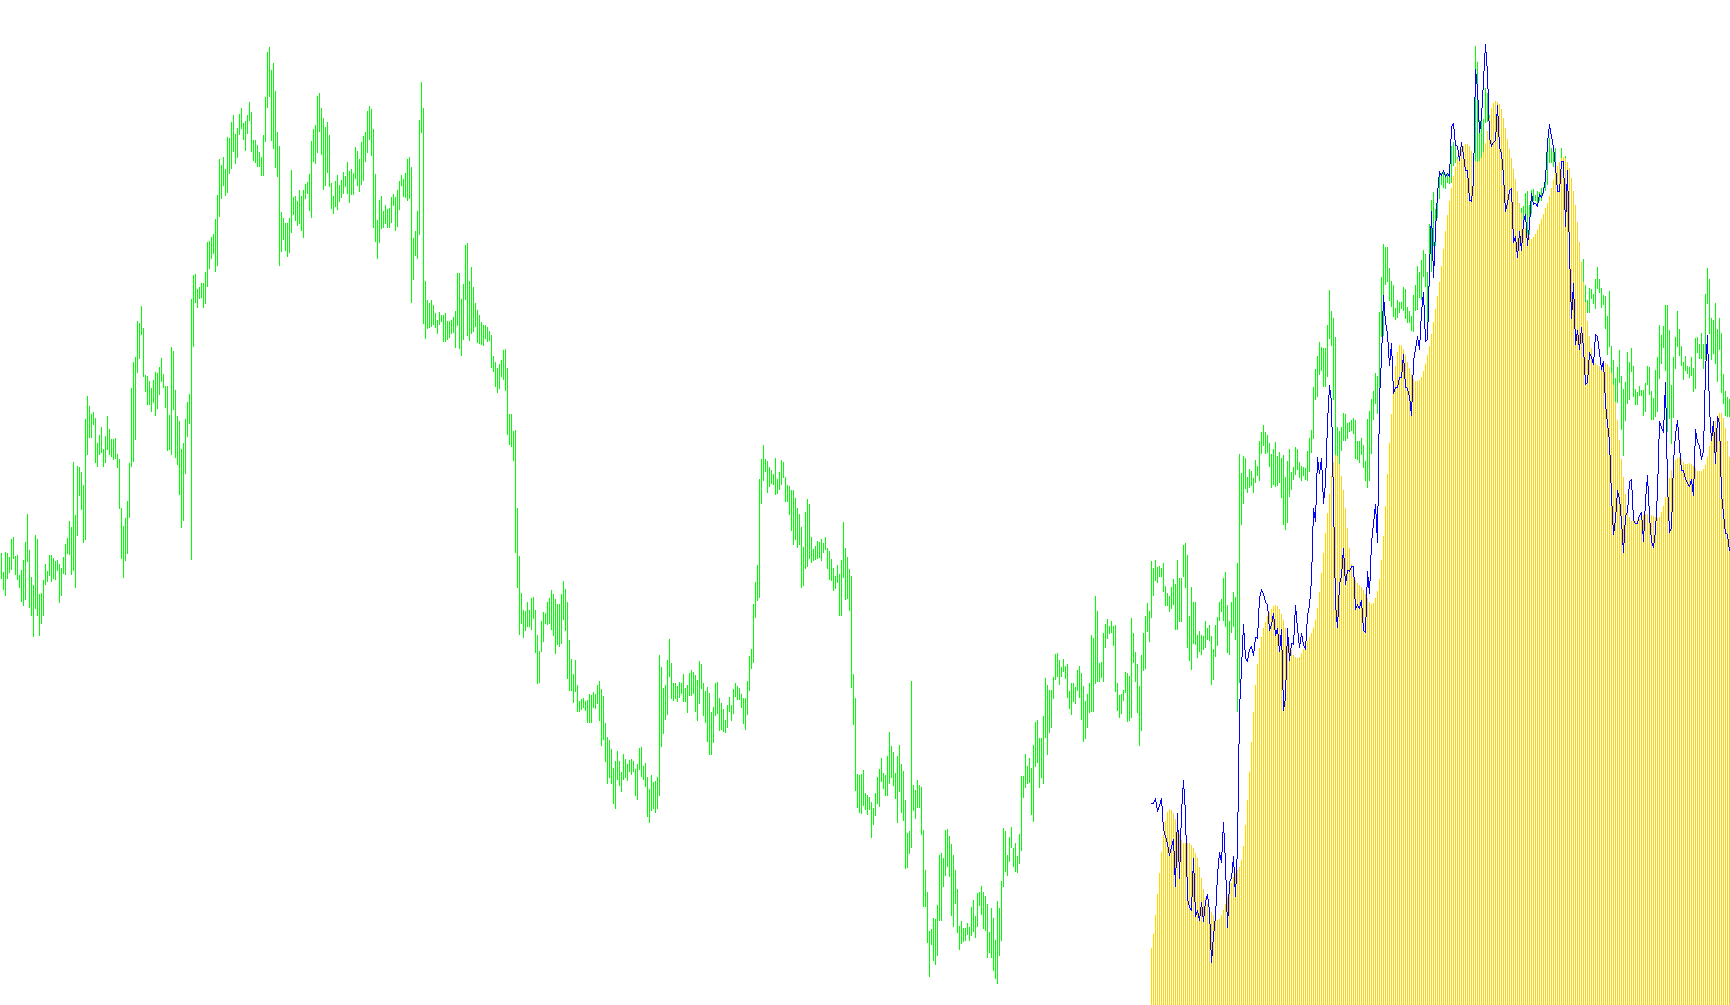
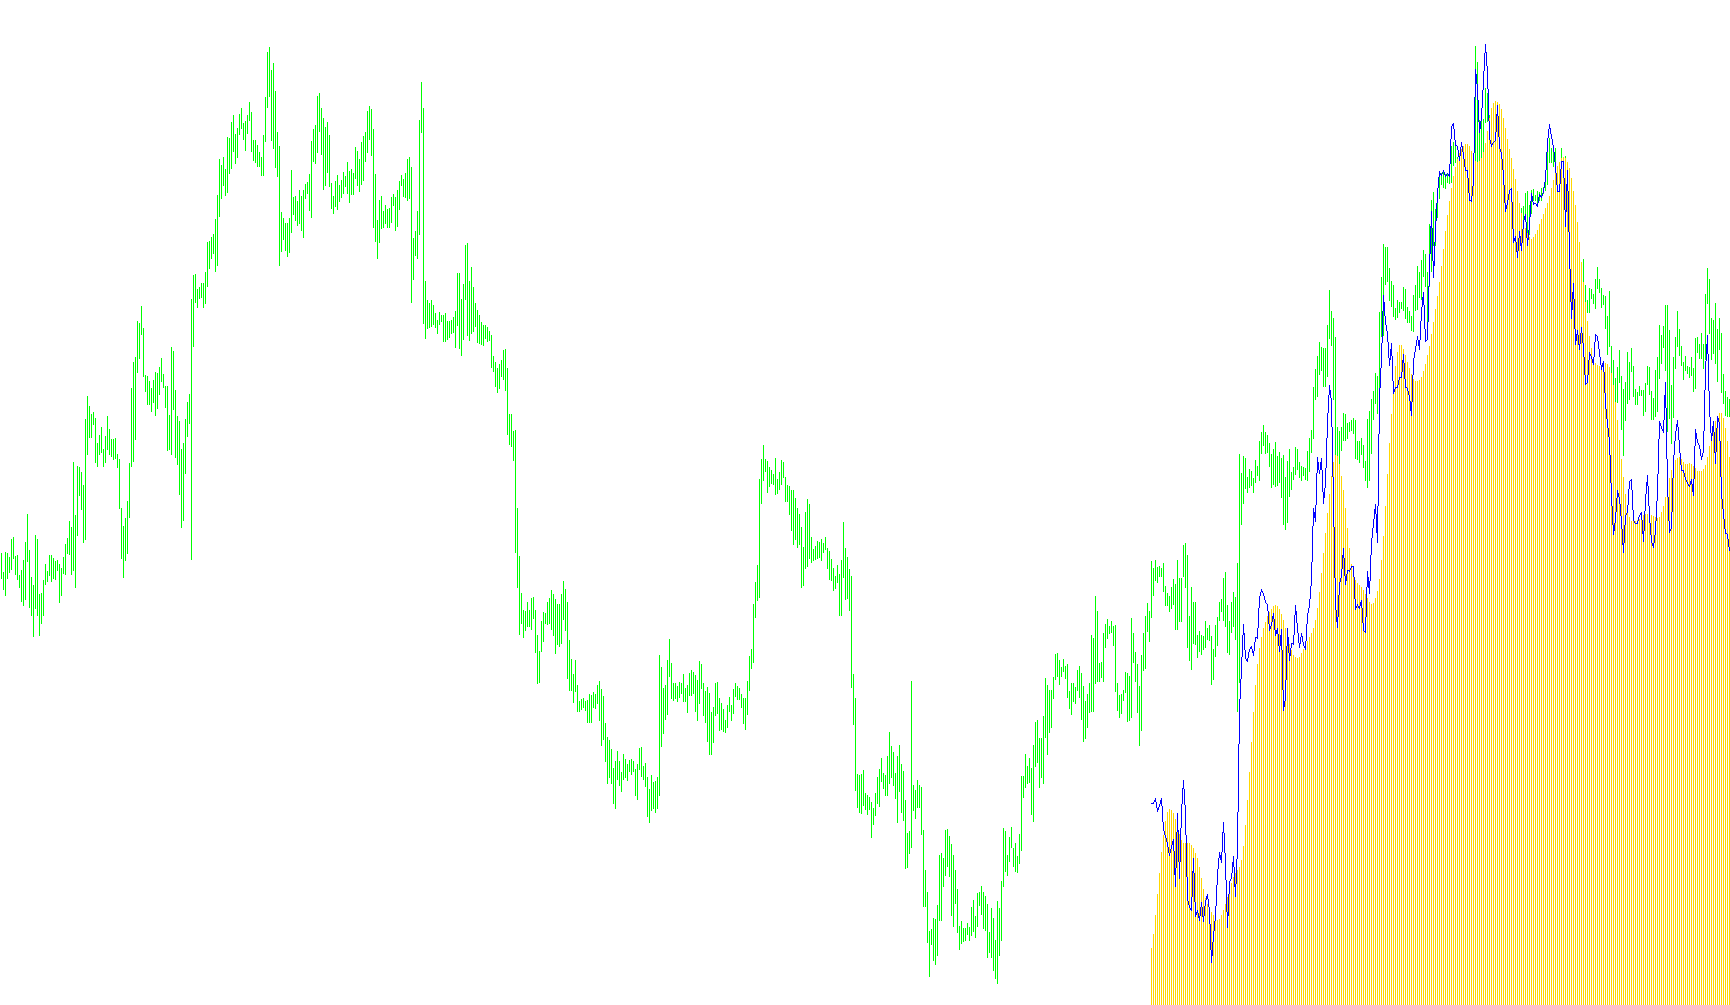
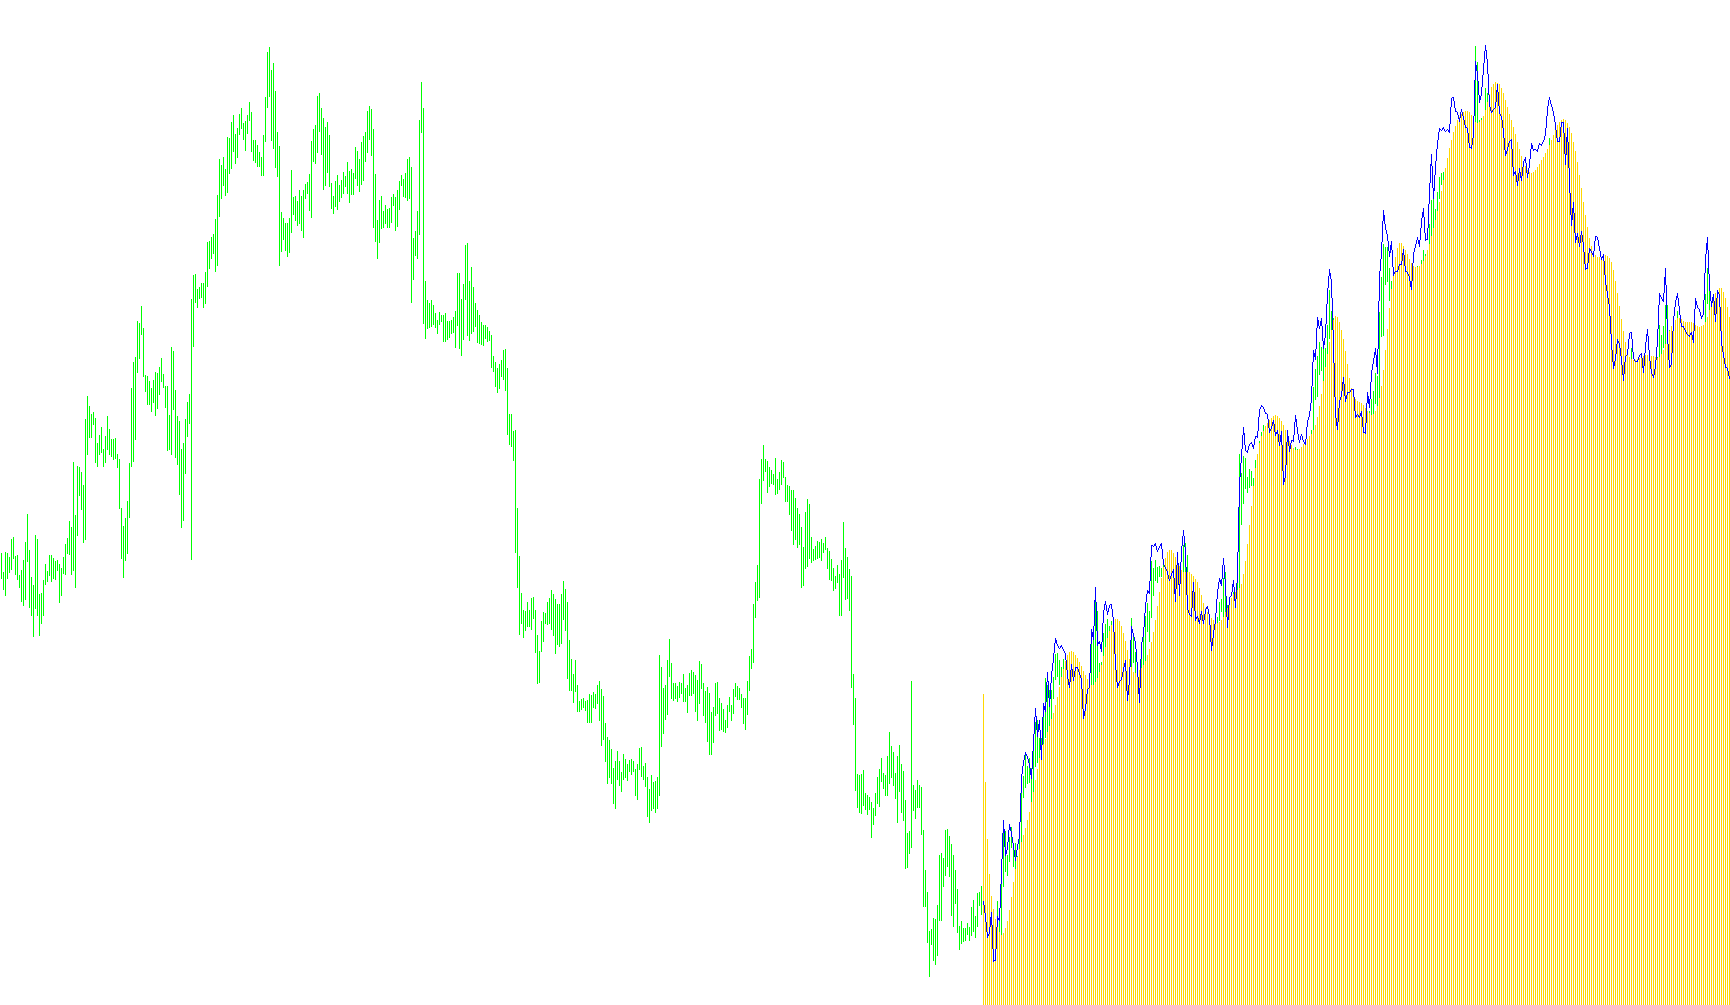
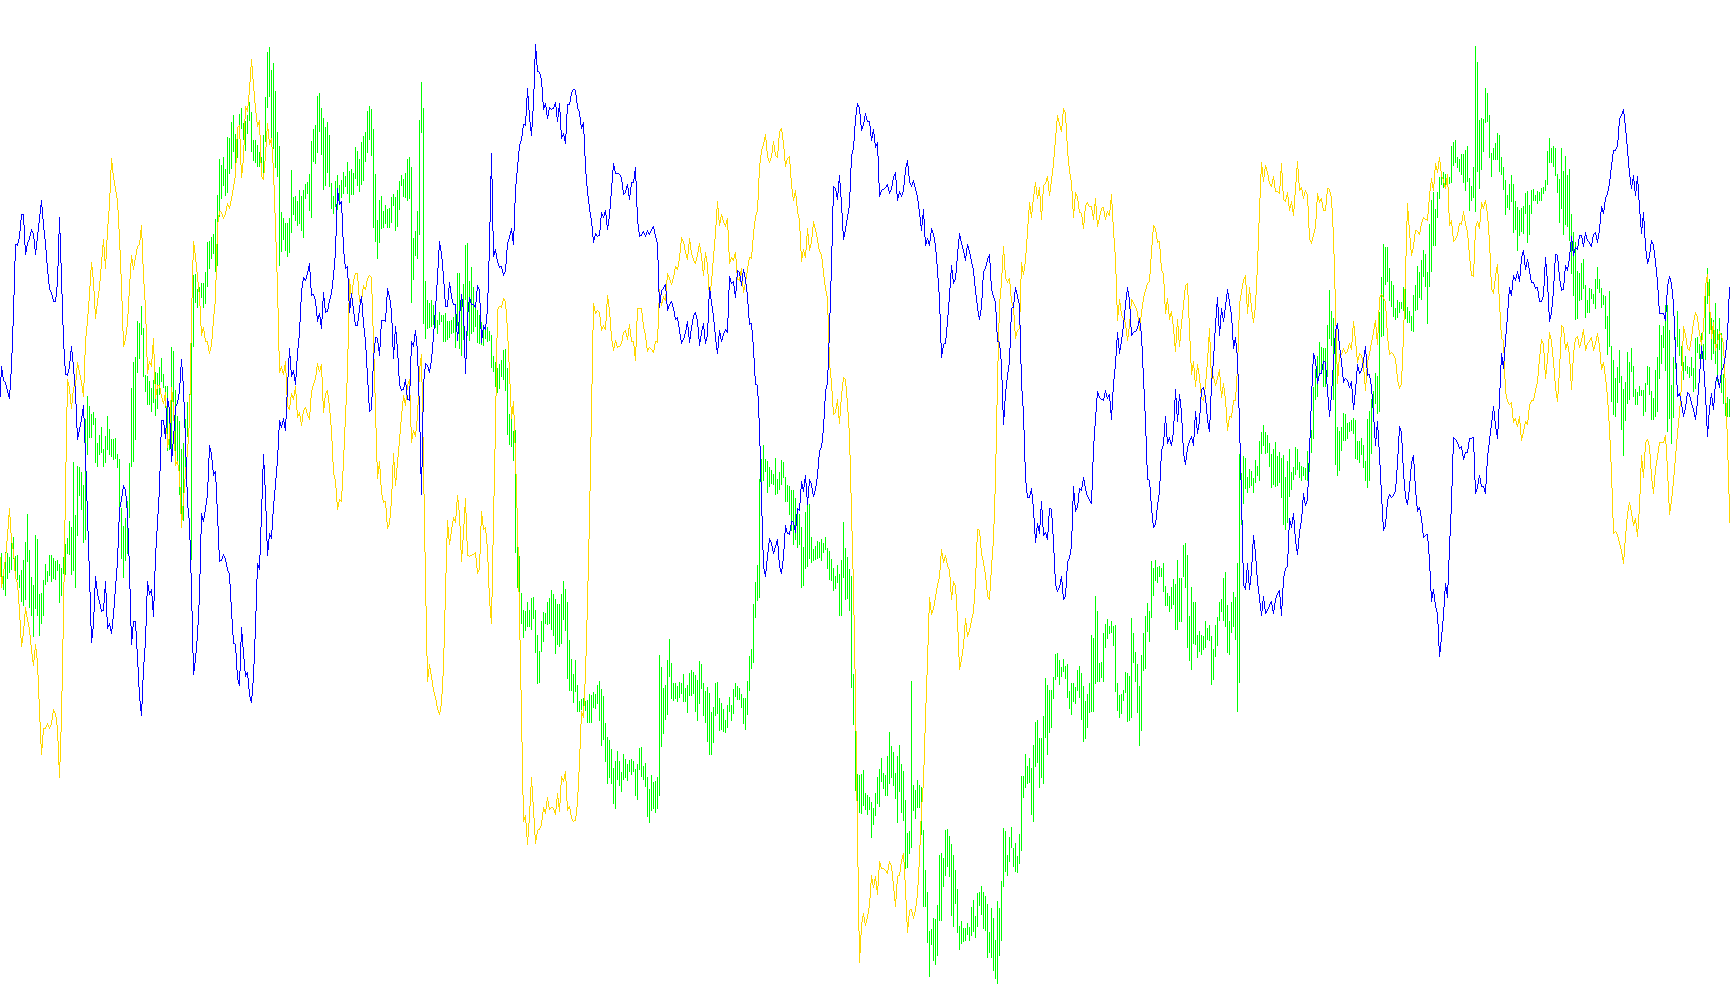
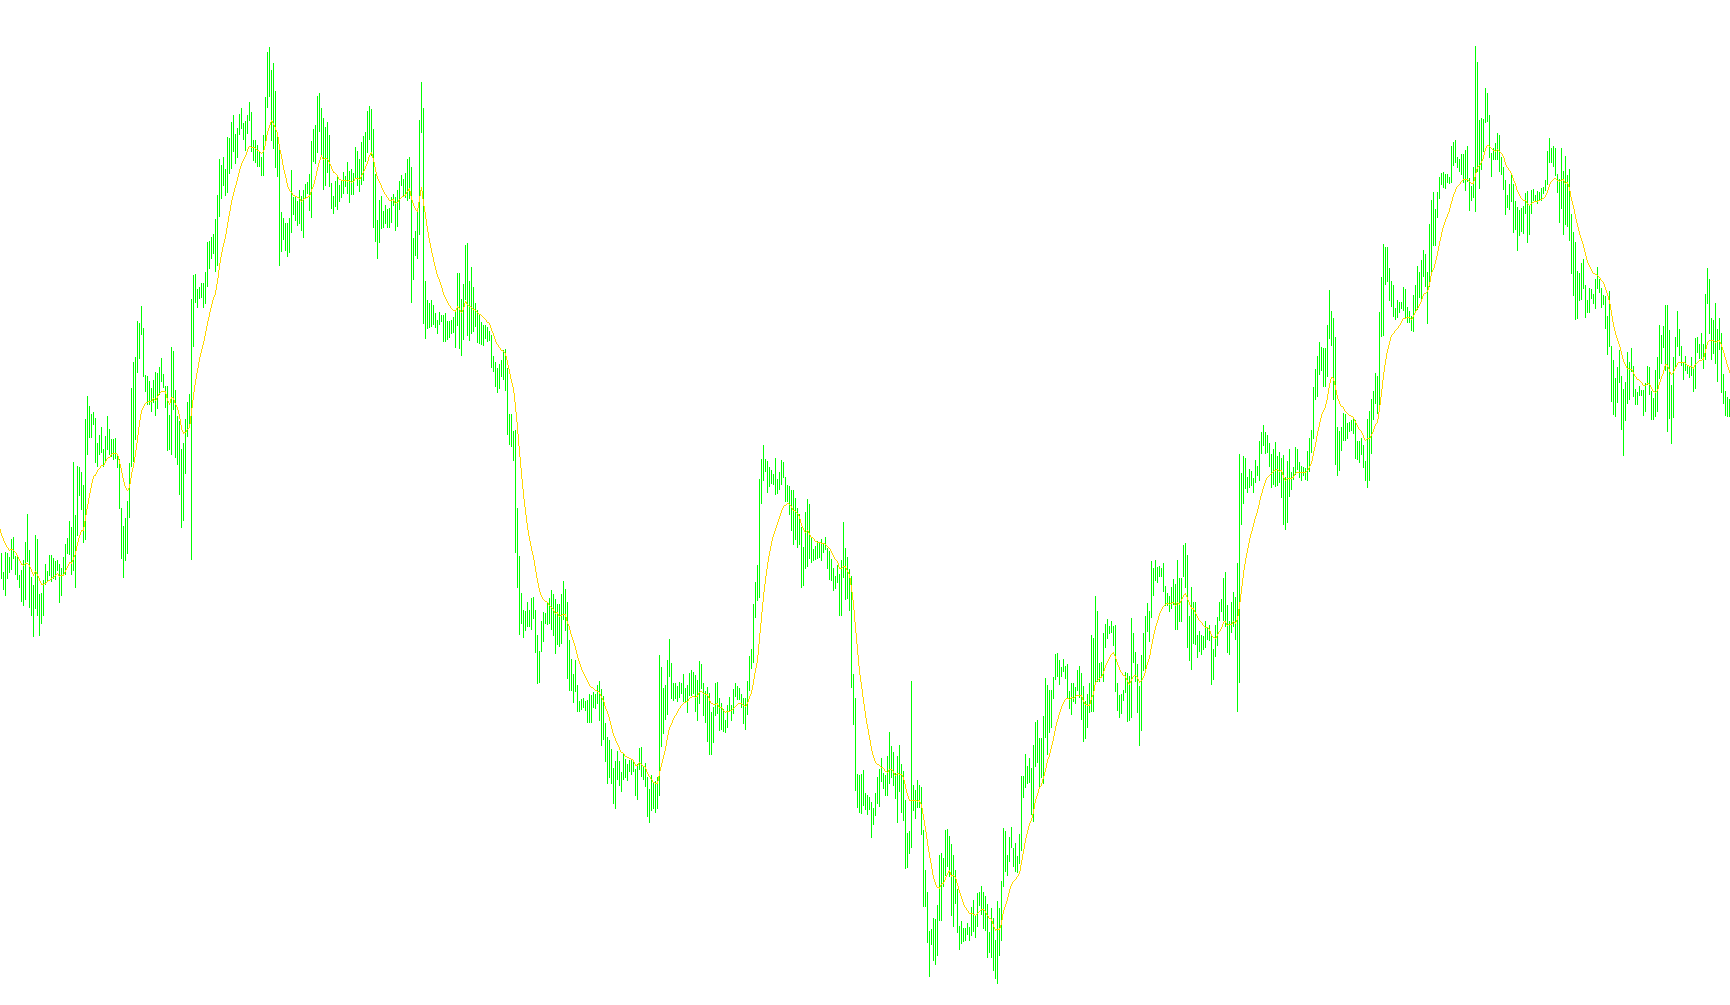
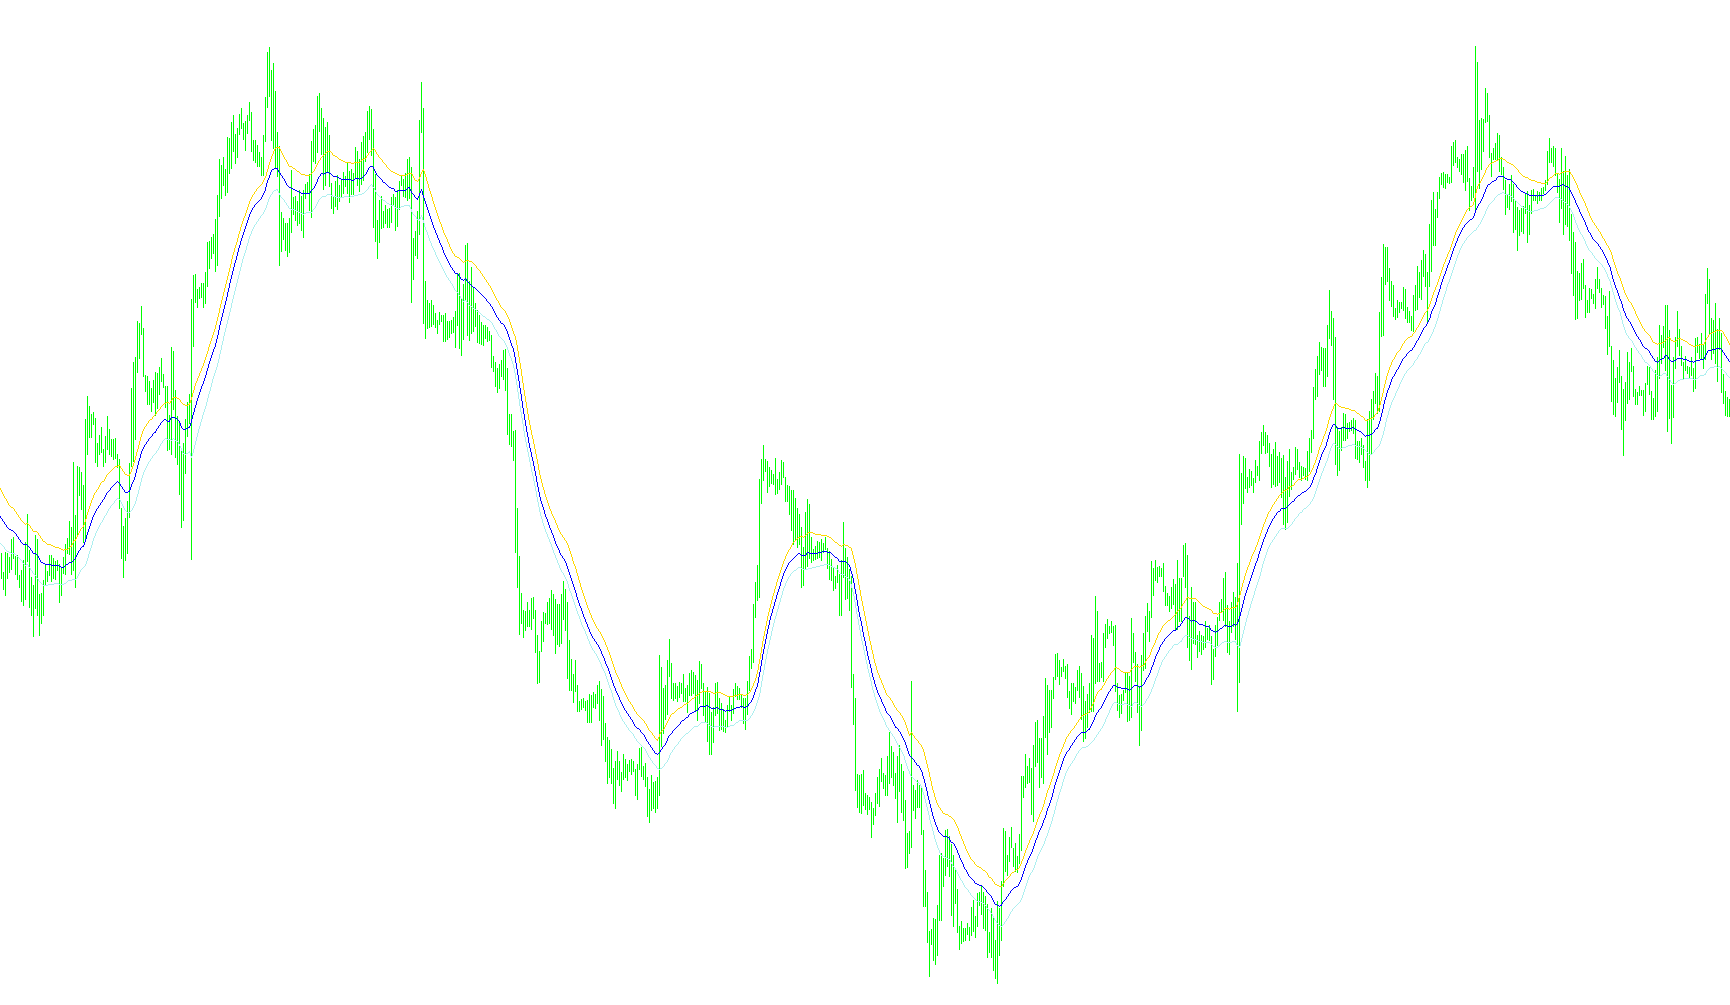
This indicator identifies high-probability entries by synchronizing Heikin Ashi price action, moving average channel trends, and volatility-adjusted momentum oscillators to filter signal noise.

Synergy_Continuation
Indicator

Synergy_Continuation

iMA

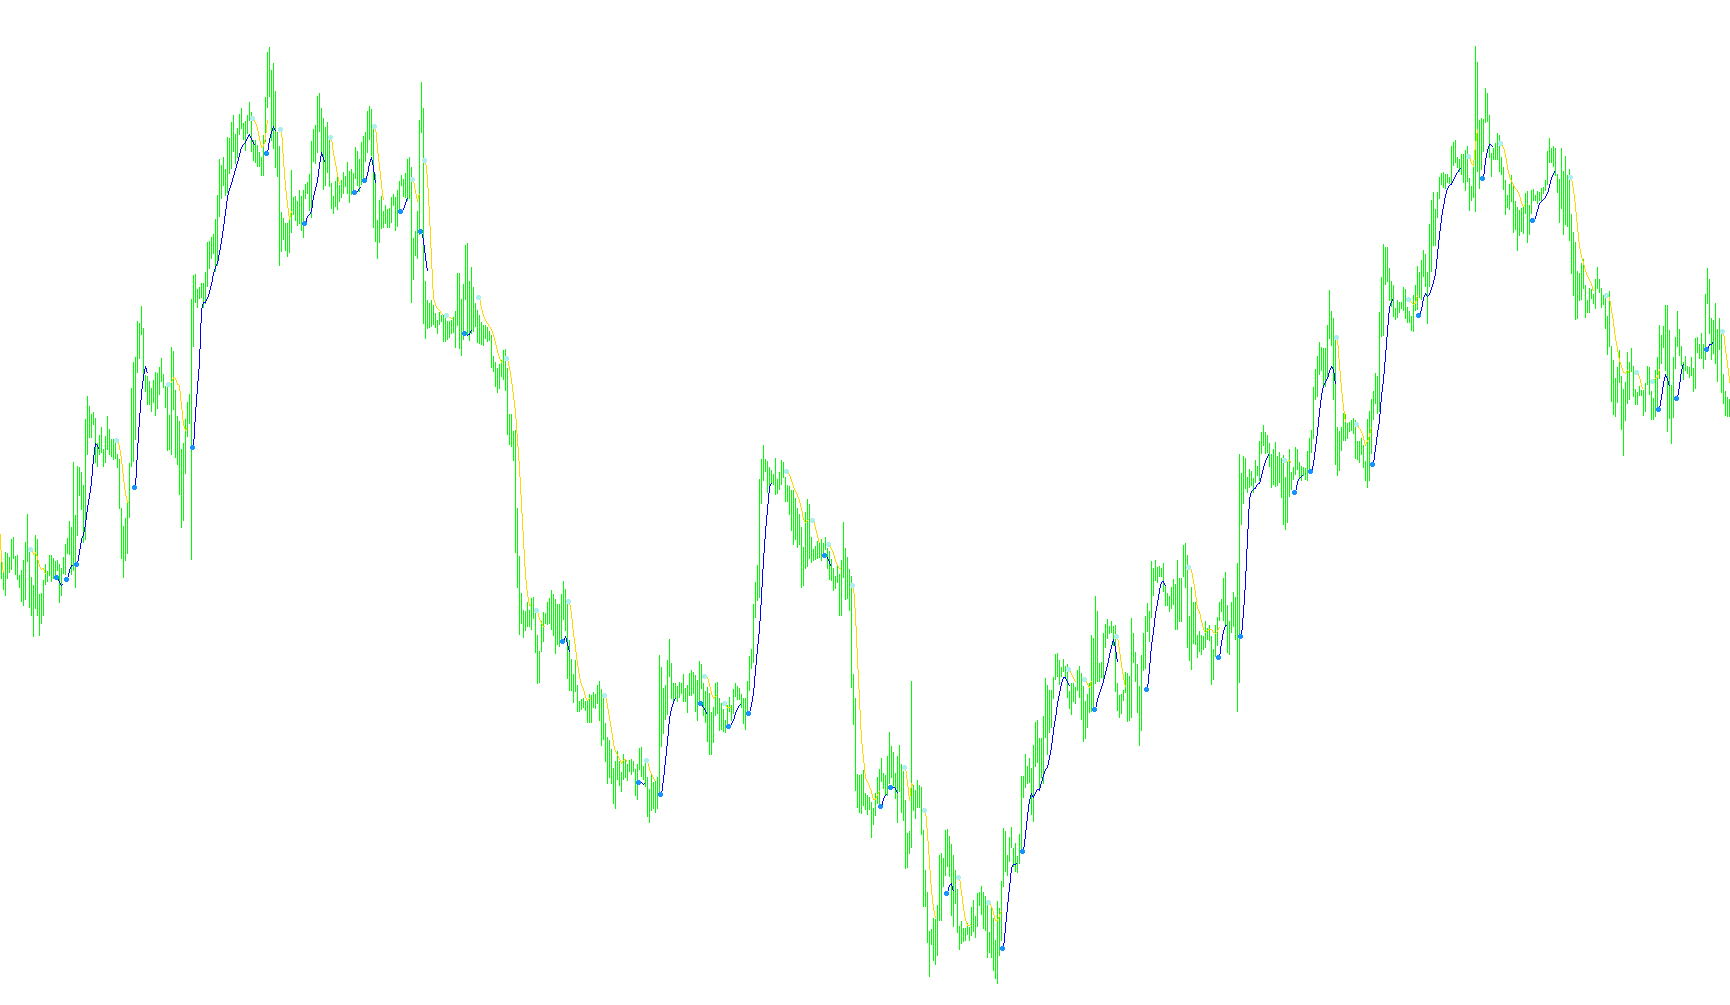
This indicator identifies trend direction by comparing a composite average of four price points (High, Low, Open, Close) against a mean of historical price buffers to generate directional momentum signals.

Synergy_RangeFactor
Indicator

Synergy_RangeFactor

iATRiMA

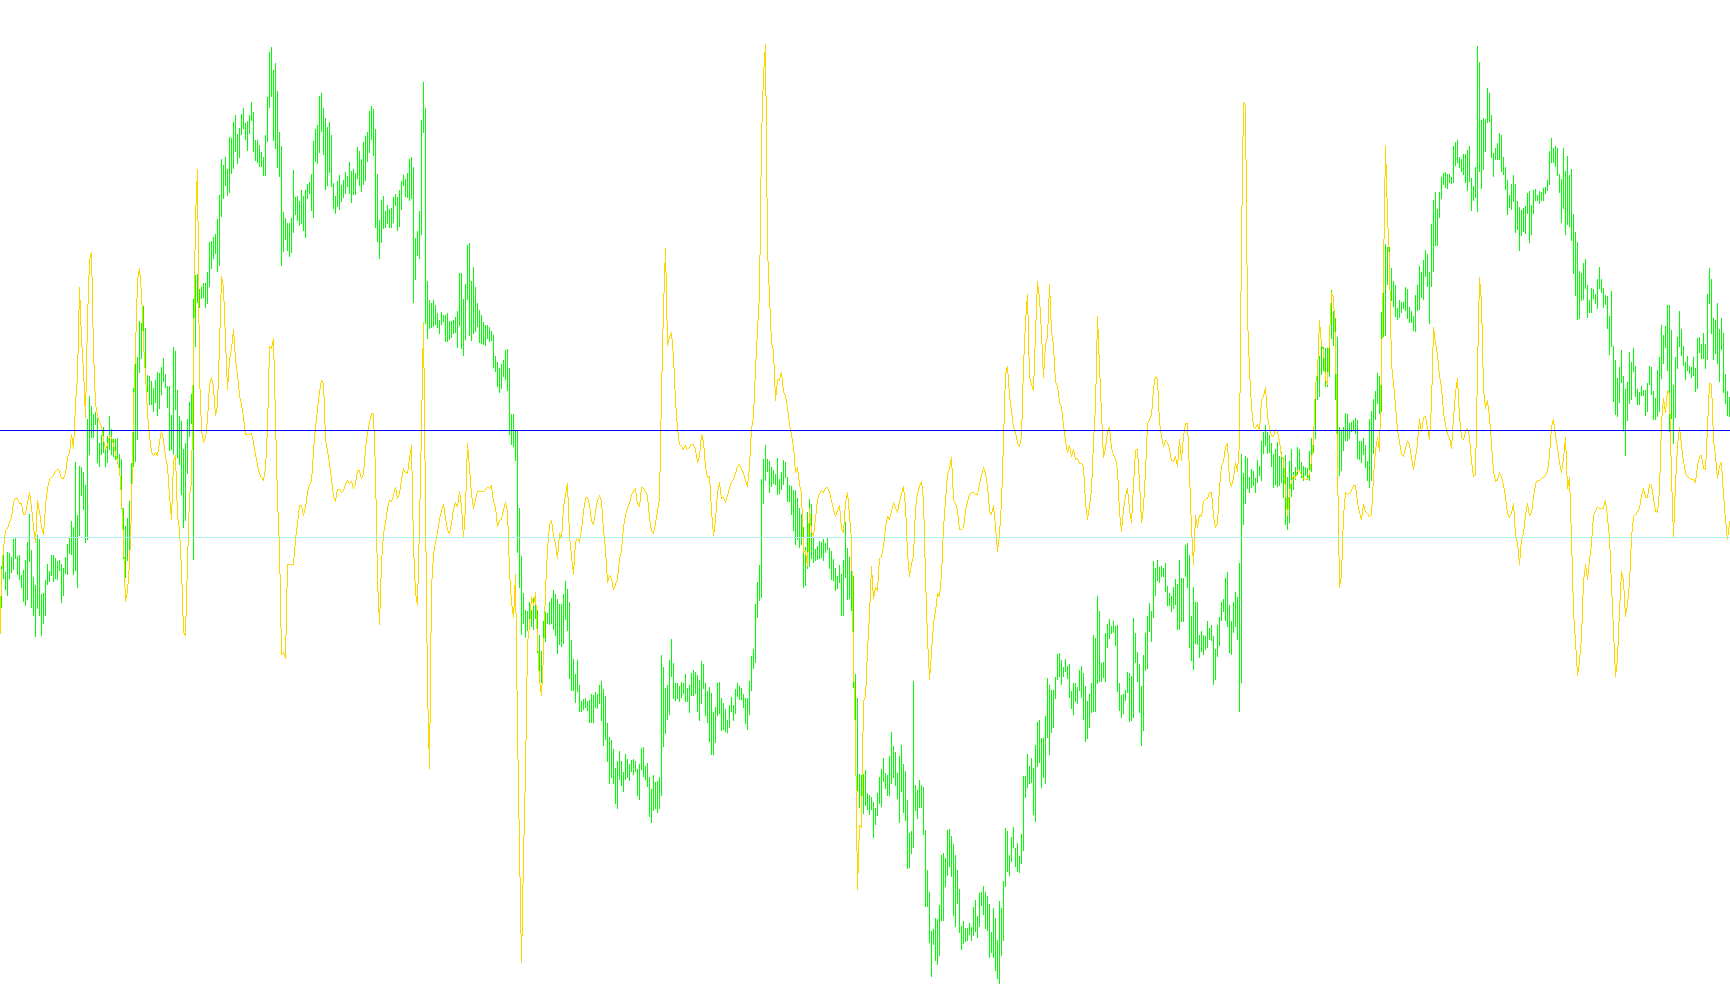
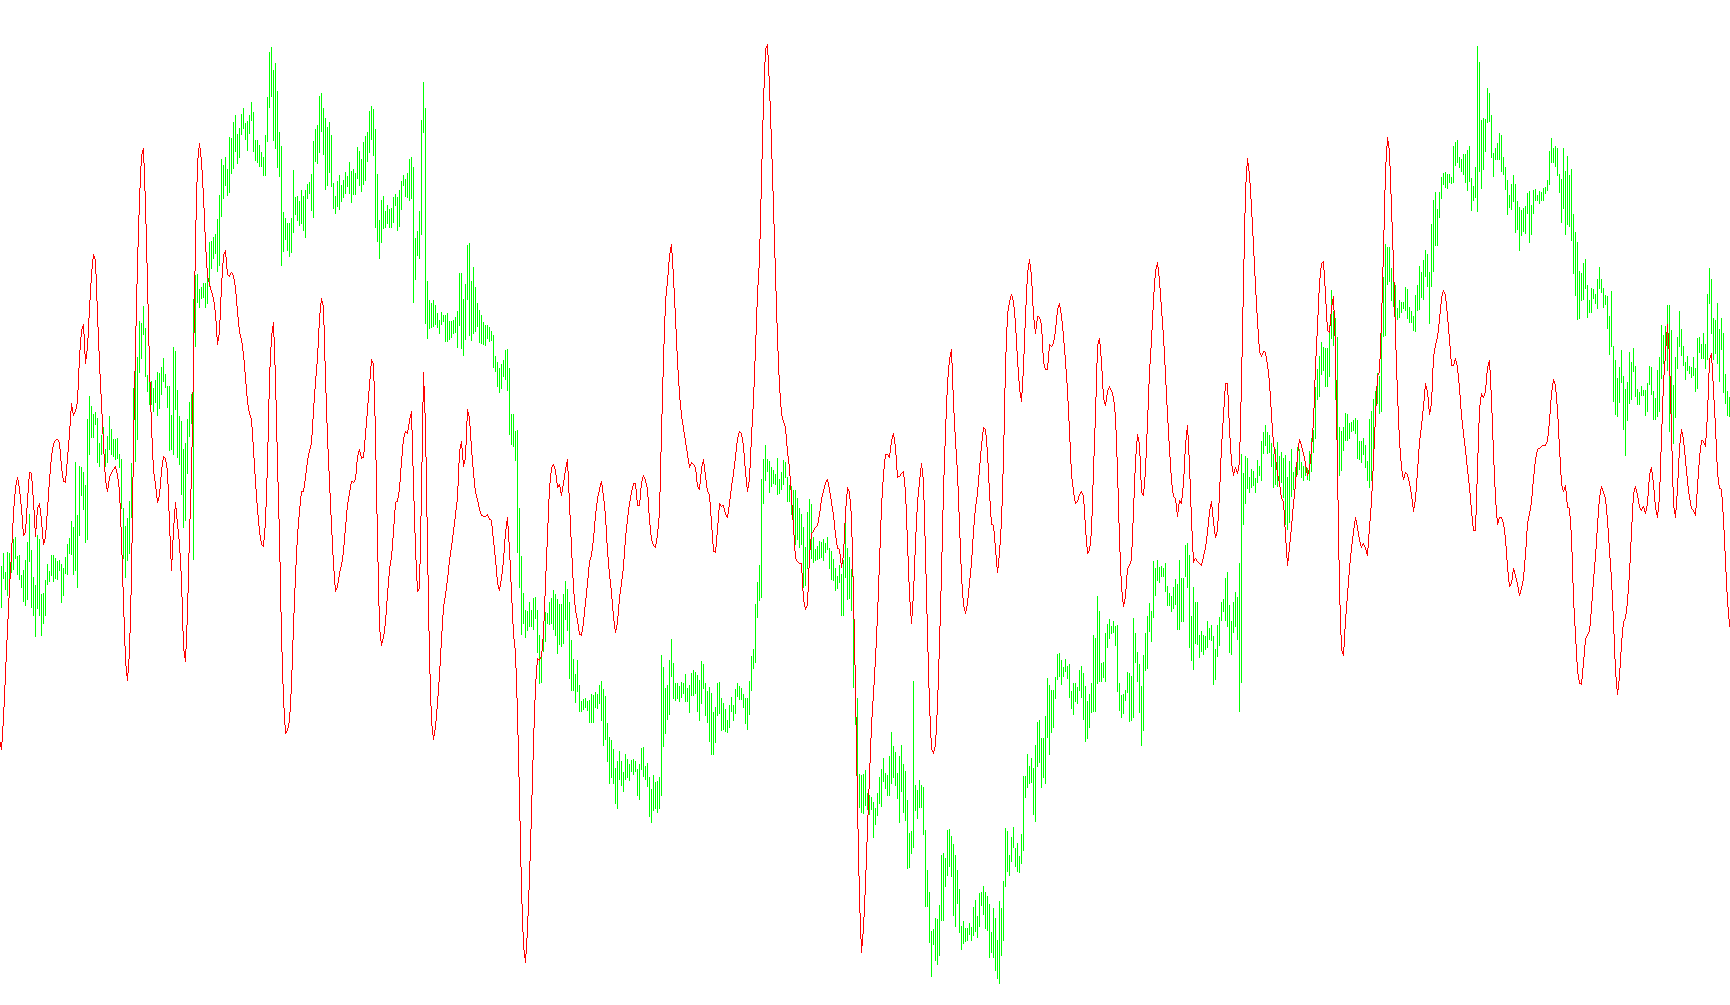
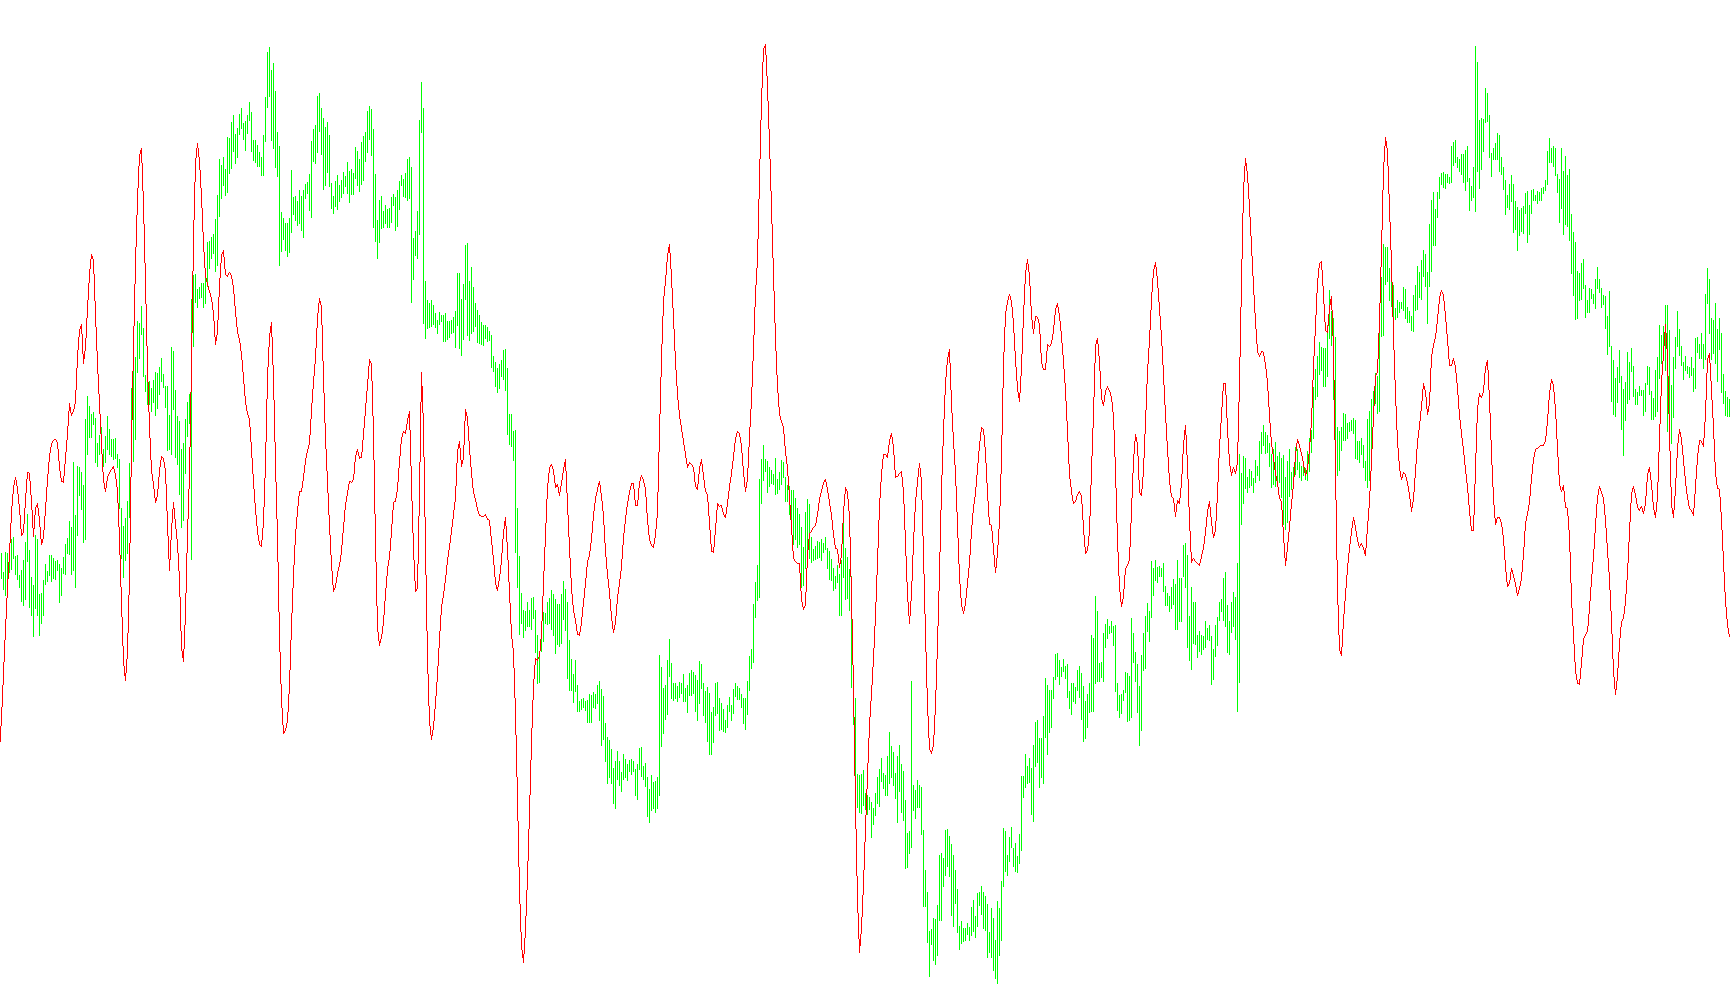
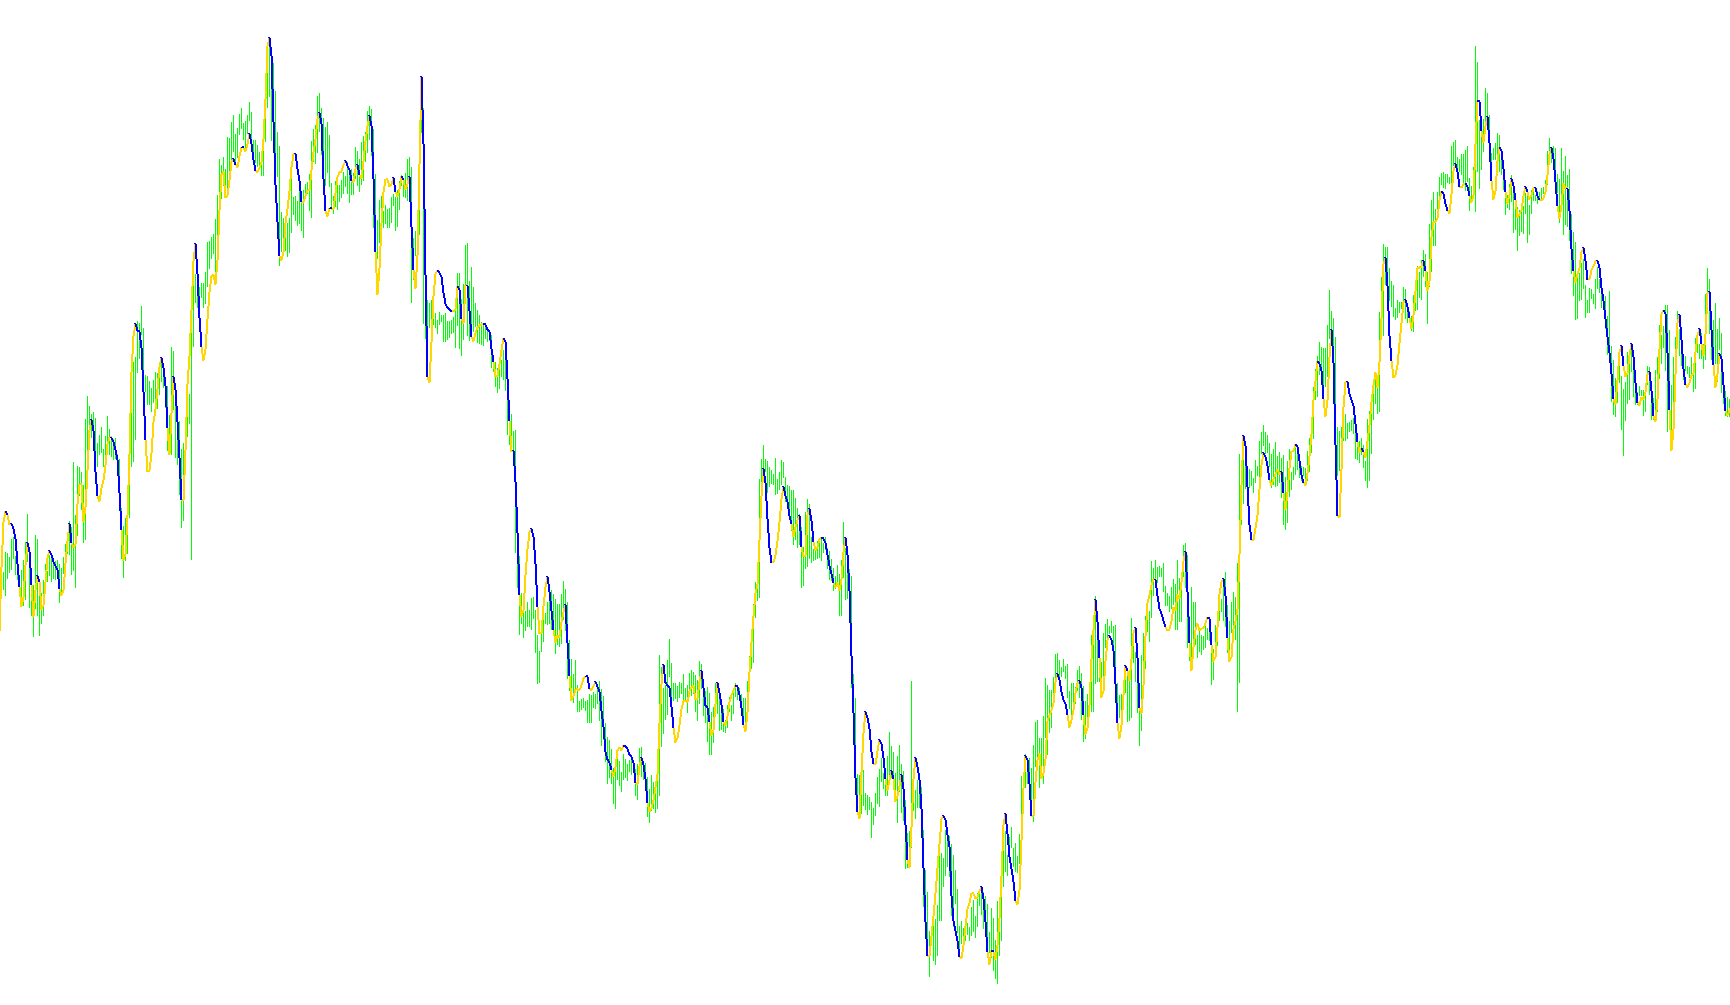
This indicator quantifies price momentum by calculating the normalized distance between short-term and long-term linear weighted moving averages, adjusted by volatility metrics to identify cyclical extremes.

Synergy_TradeSignal
Indicator

Synergy_TradeSignal

iMAiStdDev

This multi-layered indicator synthesizes Heiken Ashi trends, TDI momentum oscillators, and dynamic Standard Deviation filters to identify high-probability reversal zones and trend continuations.

Indicator

Synergy_Volatility

iMA
syst_Mrs V traffic lights 04
Indicator

syst_Mrs V traffic lights 04

iMACDiMAOnArrayiRSIiStochastic

A multi-layered trend confirmation system that synchronizes MACD momentum, Stochastic oscillations, and RSI-based moving average crossovers to generate visual buy and sell signals.

s_FlatEfficiency_v1
Indicator

s_FlatEfficiency_v1

iMA

The algorithm parses multiple financial instruments to quantify and rank them based on price movement efficiency, average bar dimensions relative to spreads, and statistical volatility deviations over a specified historical period.

T.S.V._Bullish & Bearish
Indicator

T.S.V._Bullish & Bearish

iMA

The indicator identifies trend shifts by comparing price action against high and low Simple Moving Average boundaries to trigger histogram signals.

T3  MA Nick
Indicator

T3 MA Nick

iMAiMAOnArray

This indicator calculates a highly smoothed price trend by applying triple exponential moving averages layered with a polynomial weighting coefficient to minimize lag while preserving signal integrity.

T3 crosses
Indicator

T3 crosses

iATRiMA

This indicator identifies momentum shifts by detecting precise crossover points between two smoothed T3 moving averages and plotting visual markers at ATR-adjusted price levels.

T3 MACO
Indicator

T3 MACO

iMA

The indicator utilizes a multi-layered Triple Exponential Moving Average (T3) smoothing algorithm on the differential between Fast and Slow EMA price actions to identify refined momentum trends.

T3 MACO_v1
Indicator

T3 MACO_v1

iMA

The algorithm applies nested exponential smoothing to the differential between fast and slow EMAs to isolate high-frequency price momentum shifts.

T3MA-MTF
Indicator

T3MA-MTF

iMAiMAOnArray

This indicator calculates a triple exponential moving average using nested smoothing and a volume factor coefficient, projected across higher timeframes.

T3MA
Indicator

T3MA

iMAiMAOnArray

This indicator calculates a high-order smoothed moving average by recursively applying exponential averages and weighting them with a customizable volume factor to reduce noise while preserving price trends.

T3MA_001
Indicator

T3MA_001

iMAiMAOnArray

The algorithm calculates a smoothed trend line by applying a triple-nested Exponential Moving Average sequence modified by a cubic polynomial weight factor.

T3MA_002
Indicator

T3MA_002

iMAiMAOnArray

This indicator calculates a high-fidelity trend line by recursively applying exponential moving averages to derive a refined, lag-reduced price signal through weighted polynomial coefficients.

T3MA_mod_3
Indicator

T3MA_mod_3

iMAiMAOnArray

This indicator calculates a sophisticated moving average by applying multiple layers of exponential smoothing and a specific volume-weighted polynomial coefficient to reduce lag while maintaining price proximity.

T3MA_v1
Indicator

T3MA_v1

iMAiMAOnArray

This algorithm computes a high-order smoothing curve by recursively applying exponential moving averages and weighting them through a polynomial coefficient matrix to minimize lag while preserving trend integrity.

T3MA_v2
Indicator

T3MA_v2

iMAiMAOnArray

This indicator utilizes a multi-layered exponential moving average recursion combined with polynomial coefficients to minimize lag while preserving price trend integrity.

T3MA_v3
Indicator

T3MA_v3

iMAiMAOnArray

This indicator utilizes a multi-layered recursive EMA data-fitting technique to minimize price lag while maintaining high signal fidelity through polynomial coefficient weighting.

Indicator

T3_clean

iMA
T3_DPO-v1
Indicator

T3_DPO-v1

iMA

This indicator applies a multi-layered weighted smoothing algorithm to price action to isolate underlying trend momentum while filtering out high-frequency market noise.

T3_DPO-v1_v1
Indicator

T3_DPO-v1_v1

iMA

This indicator calculates a weighted recursive smoothing of the simple moving average to derive high-fidelity momentum signals while filtering out market noise.

T3_DPO-v1_v2
Indicator

T3_DPO-v1_v2

iMA

This indicator utilizes a multi-stage weighted moving average filter combined with polynomial coefficients to smooth price action and identify directional trends.

T3_DPO-v3
Indicator

T3_DPO-v3

iMA

This indicator calculates a high-order smoothing of the simple moving average through recursive weighting to identify trend momentum and price deviations.

T3_MACO
Indicator

T3_MACO

iMA

This indicator utilizes a recursive triple-smoothing algorithm on the differential between fast and slow exponential moving averages to filter market noise and identify underlying momentum trends.

T3_MACO_v1
Indicator

T3_MACO_v1

iMA

This indicator synthesizes multi-stage recursive smoothing and weighted exponential averages to derive a polynomial momentum signal from price differentials.

T3_MA_Nick
Indicator

T3_MA_Nick

iMAiMAOnArray

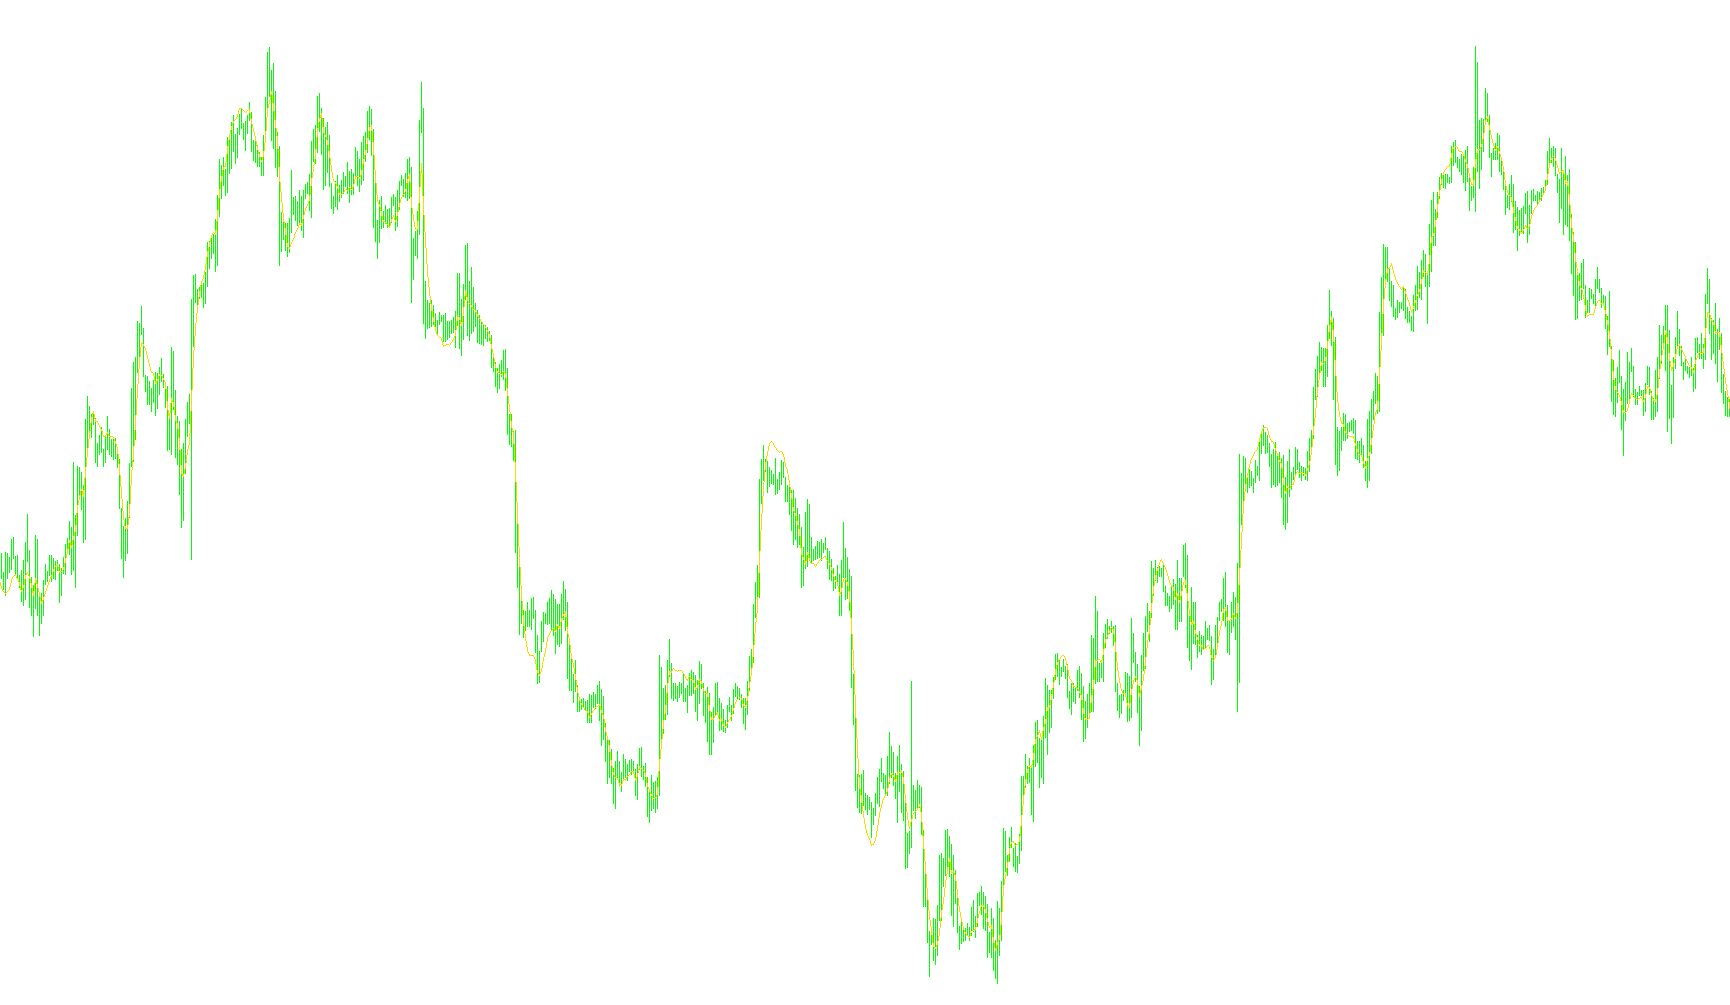
A high-order smoothing algorithm that applies recursive exponential moving averages to minimize price noise and reduce lag through a polynomial weighting coefficient.
T3_v4
Indicator

T3_v4

iMAiMAOnArray

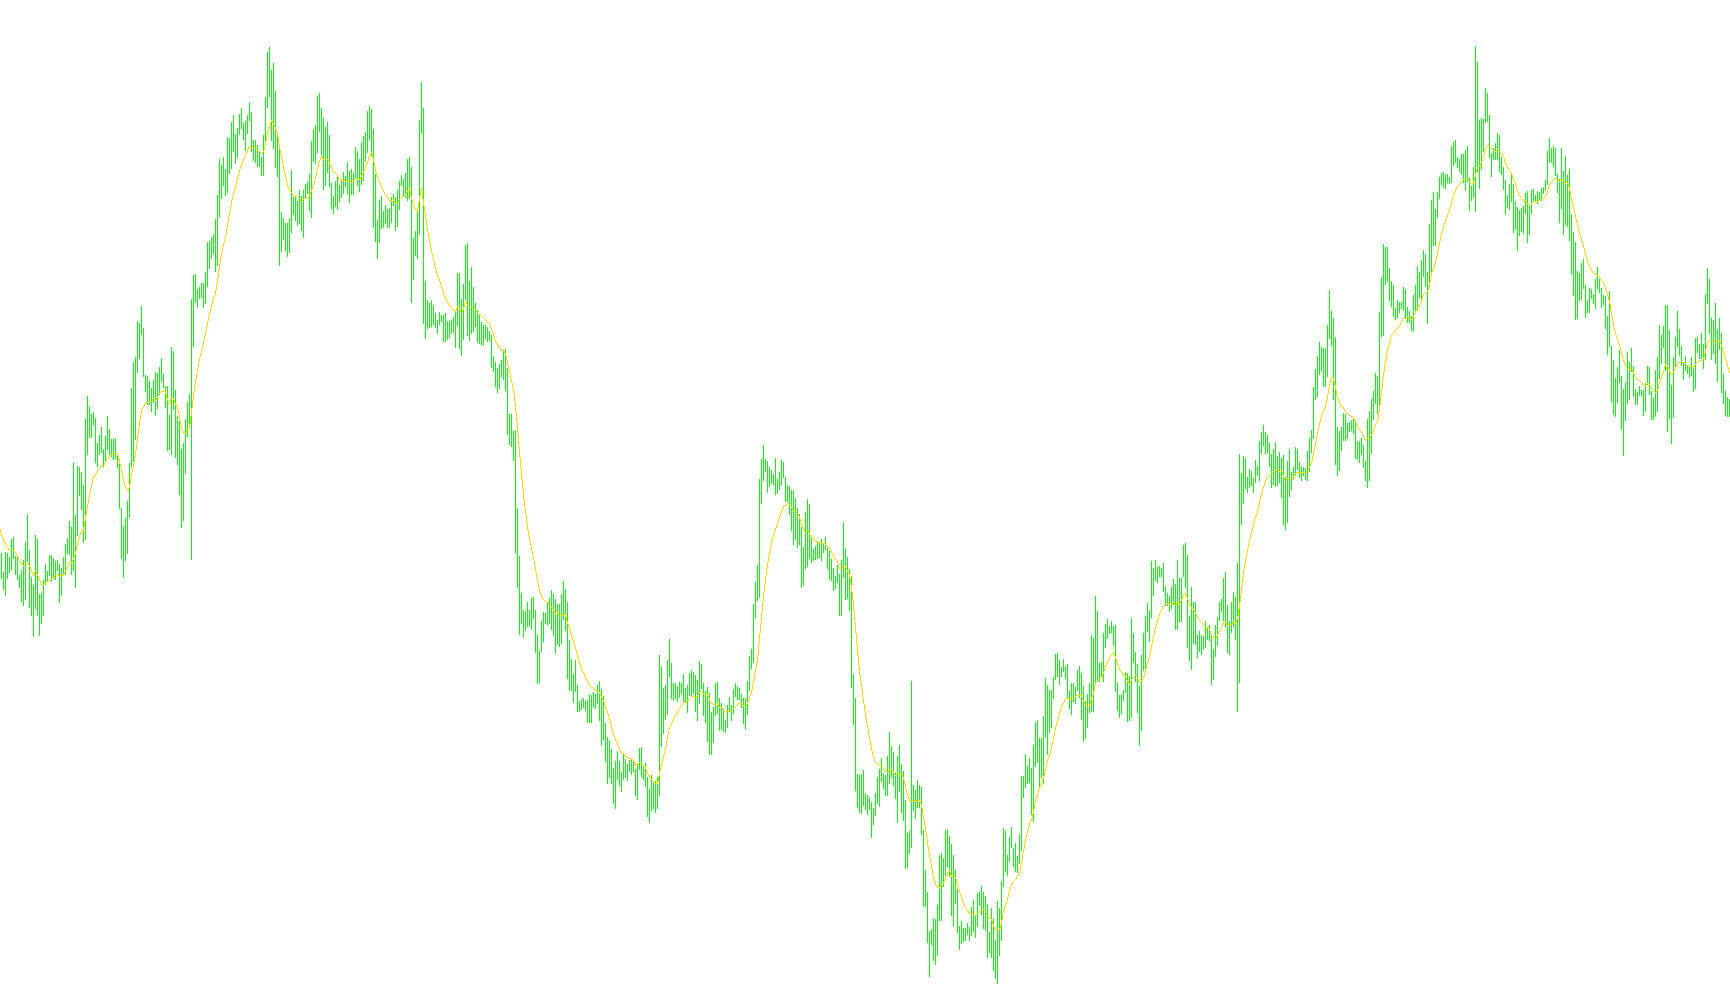
The algorithm synthesizes a high-order smoothed moving average by applying recursive exponential smoothing across six layers and calculating a weighted polynomial sum based on a specific volume factor.
Indicator

Tabelka_kontrolna_PL

iADiACiAlligatoriFractals
Table_v0
Indicator

Table_v0

iCCIiMAiRSI

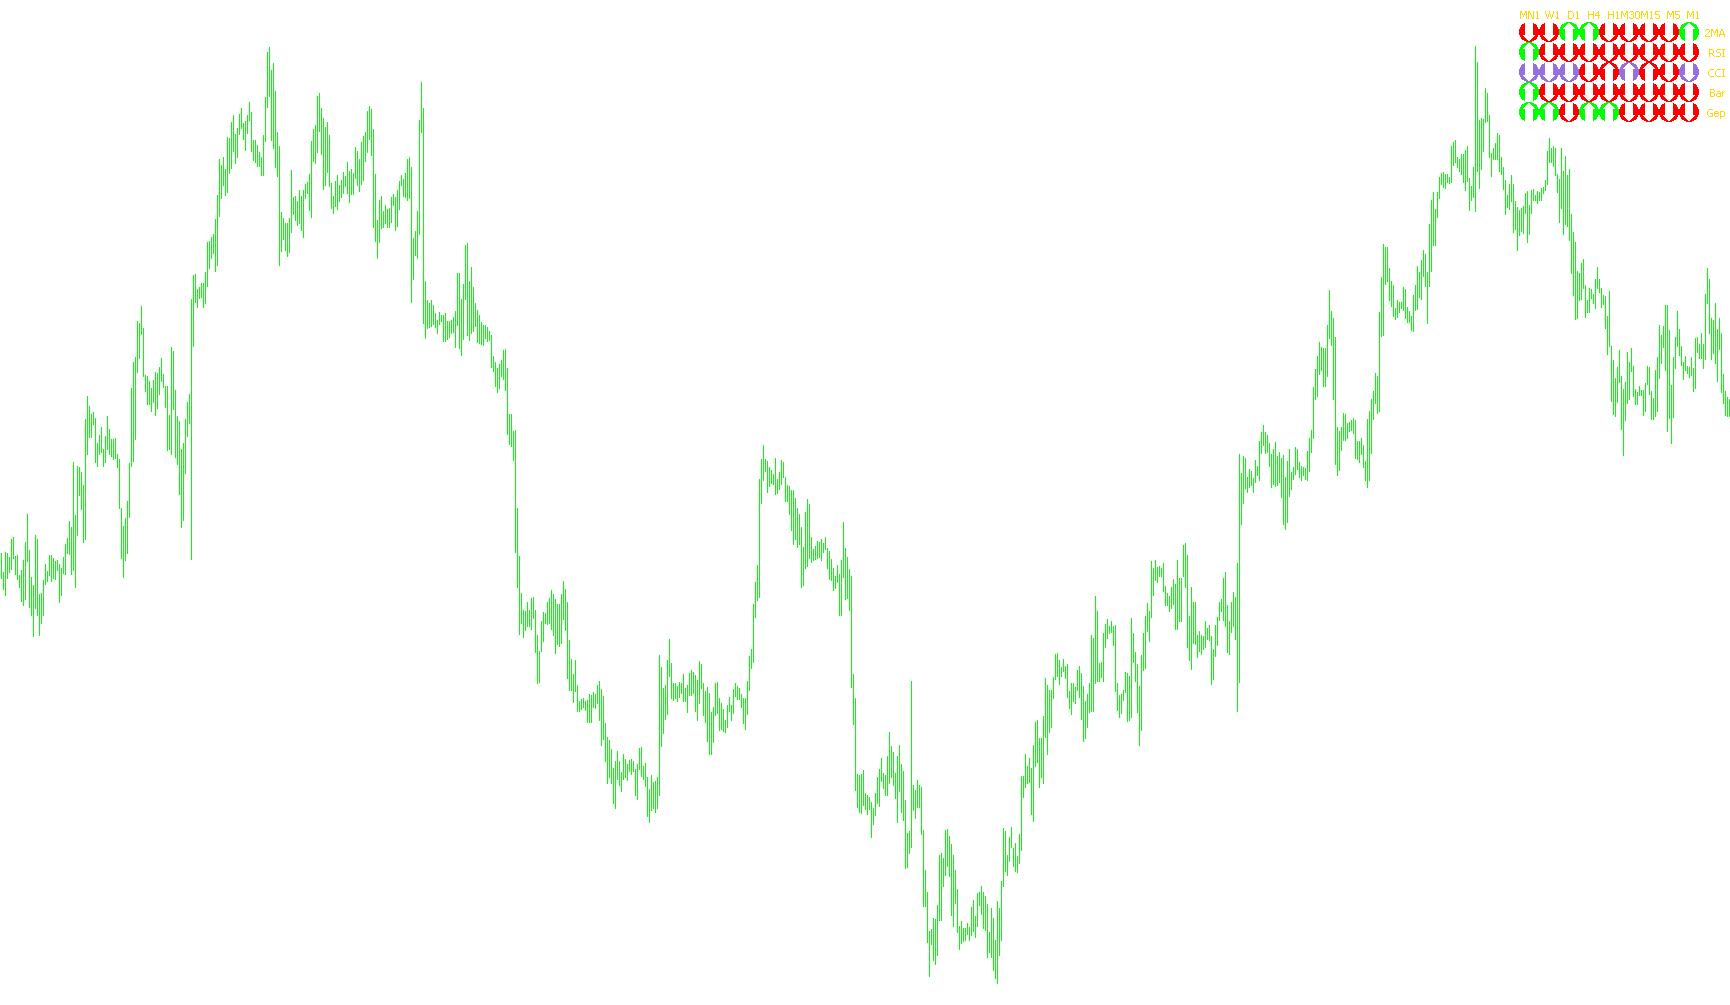
This indicator generates a visual grid of real-time buy and sell signals across nine concurrent timeframes by synthesizing Moving Average crossovers, RSI momentum, CCI deviations, and price action bar analysis.

target_lubang_MA
Indicator

target_lubang_MA

iMA

This indicator dynamically identifies dynamic price targets and structural trend shifts by evaluating hierarchical relationships between the 20, 50, 100, and 200 Simple Moving Averages.

tcf smoothed - T3
Indicator

tcf smoothed - T3

iMA

This indicator quantifies momentum by segregating directional rate of change into cumulative additive components, then applying a triple exponential smoothing algorithm to identify persistent trend strength.

tcf
Indicator

tcf

iMA

The indicator quantifies momentum sustainability by aggregating the net difference between cumulative positive and negative Rate of Change components over a specific lookback period.

TDCD_TemaDema_rlh
Indicator

TDCD_TemaDema_rlh

iMAiMAOnArray

This indicator quantifies the momentum variance between Triple Exponential Moving Averages (TEMA) and Double Exponential Moving Averages (DEMA) to identify trend acceleration.

TD_moving_average_I
Indicator

TD_moving_average_I

iMA

This indicator identifies significant price structural pivots by tracking consecutive high and low occurrences within a specific threshold to plot smoothed trend reversals.

TEMa-RV
Indicator

TEMa-RV

iMAiMAOnArray

This indicator utilizes a nested three-stage moving average calculation combined with a smoothing coefficient to filter market noise and identify high-probability trend direction.

TEMa-RV_v1
Indicator

TEMa-RV_v1

iMAiMAOnArray

This indicator executes a multi-stage recursive smoothing process on nested moving averages to filter market noise and identify trend momentum shifts.

TEMA
Indicator

TEMA

iMAiMAOnArray

This indicator calculates a Triple Exponential Moving Average by applying a weighted linear combination of nested EMA layers to reduce lag while maintaining high sensitivity to price fluctuations.

tema_custom
Indicator

tema_custom

iMAiMAOnArray

This indicator calculates a Triple Exponential Moving Average by applying weighted nested smoothing to minimize lag while maintaining high sensitivity to price fluctuations.

TEMA_RLH
Indicator

TEMA_RLH

iMAiMAOnArray

This indicator calculates the Triple Exponential Moving Average (TEMA) by mathematically compounding nested EMA layers to reduce lag while maintaining high sensitivity to price fluctuations.

TEMA_RLH_v1
Indicator

TEMA_RLH_v1

iMAiMAOnArray

This indicator calculates a high-responsiveness moving average by applying a triple nested exponential smoothing calculation to reduce lag while maintaining trend fidelity.

Tema_rlh_v2
Indicator

Tema_rlh_v2

iMAiMAOnArray

This indicator calculates a high-responsiveness trend line by applying a weighted recursive formula of three nested exponential moving averages to minimize lag while maintaining signal smoothness.

TFT_Colour
Indicator

TFT_Colour

iMA

This indicator dynamically identifies trend direction by comparing closing prices against shifted SMA boundaries of high and low extremes to switch between bullish and bearish envelopes.

TF_15B15D.01
Indicator

TF_15B15D.01

iMACDiMA

This indicator visualizes real-time trend alignment by simultaneously monitoring MACD crossovers and dual Exponential Moving Average (EMA) configurations across six distinct timeframes.

The-Wave
Indicator

The-Wave

iMA

This indicator synthesizes three concurrent moving averages based on high, close, and low prices to delineate the active price corridor.

THMA
Indicator

THMA

iMAiMAOnArray

This algorithm calculates a high-velocity trend line by applying a weighted linear moving average to the difference between two scaled linear moving averages.

THMA_v1
Indicator

THMA_v1

iMAiMAOnArray

This indicator calculates a smoothed price trajectory by applying a weighted linear moving average to the variance of half-period movements, aiming to eliminate lag while maintaining high sensitivity.

ThreeCombo_v2
Indicator

ThreeCombo_v2

iADXiMAiRSI

This indicator identifies high-probability trend alignment by synchronizing moving average crossovers, RSI momentum thresholds, and ADX directional bias to filter actionable entries.

Three_Color
Indicator

Three_Color

iMA

This indicator segments historical price data into three distinct chronological windows to display sequential simple moving average phases using separate color buffers.