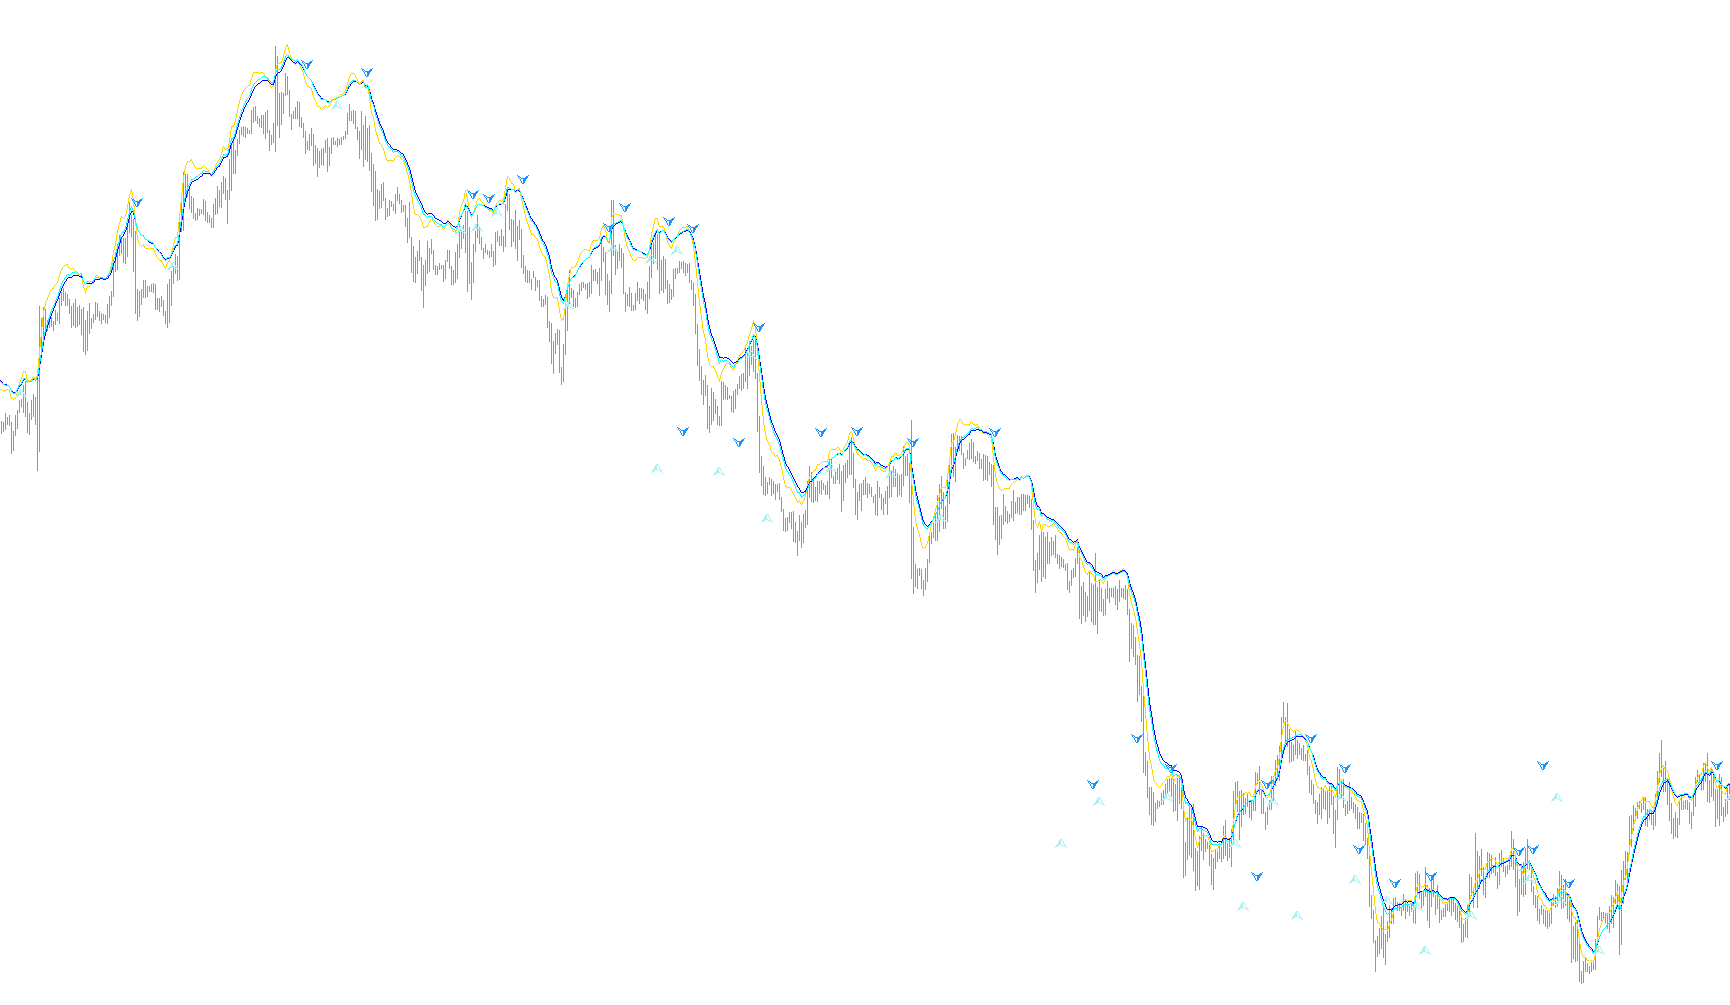
Regular RSI Div
Indicator

Regular RSI Div

iMAiMAOnArrayiRSI

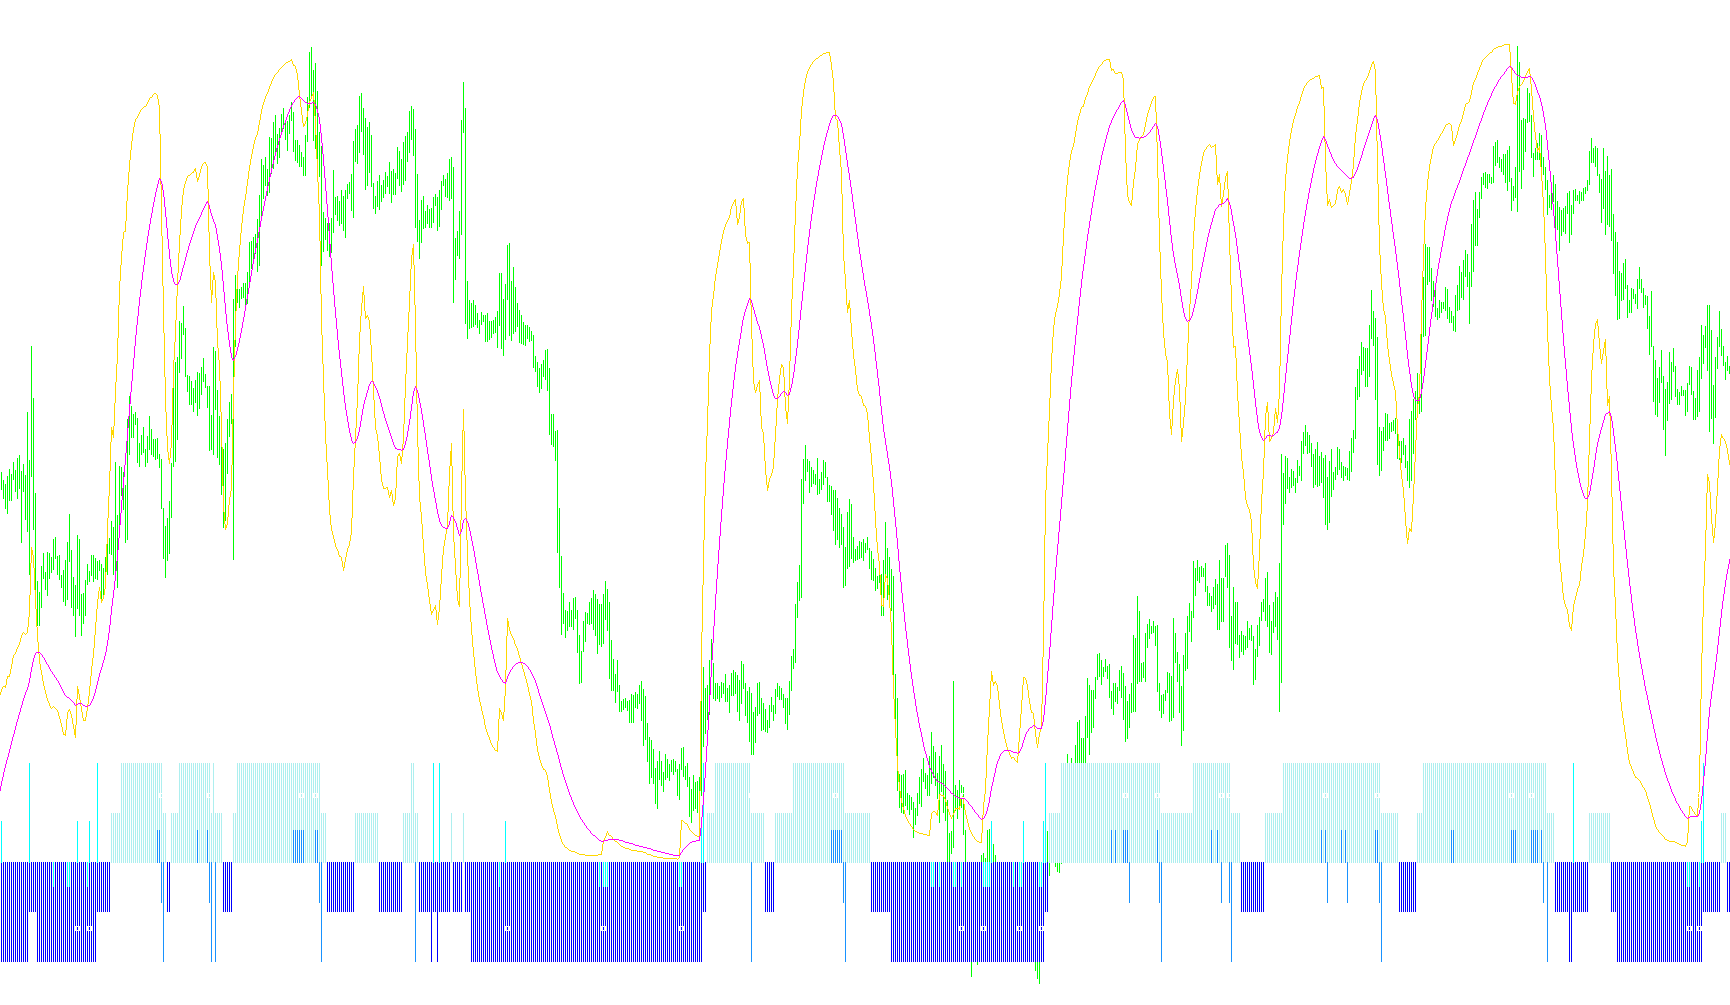
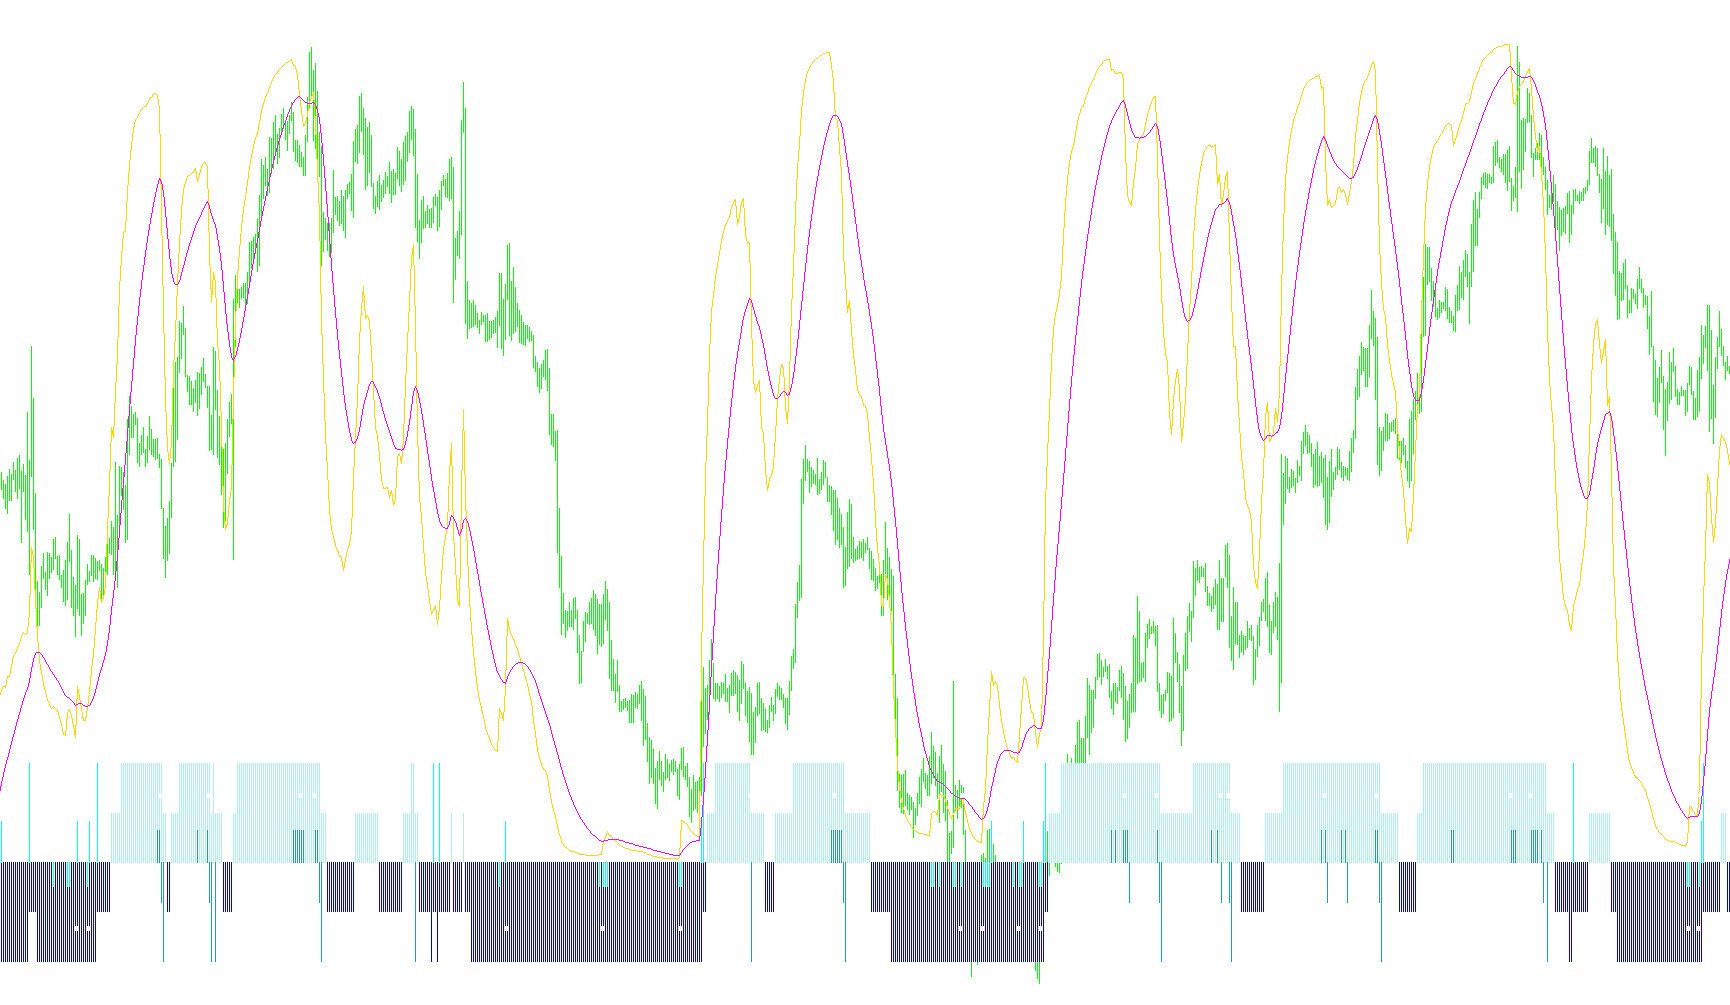
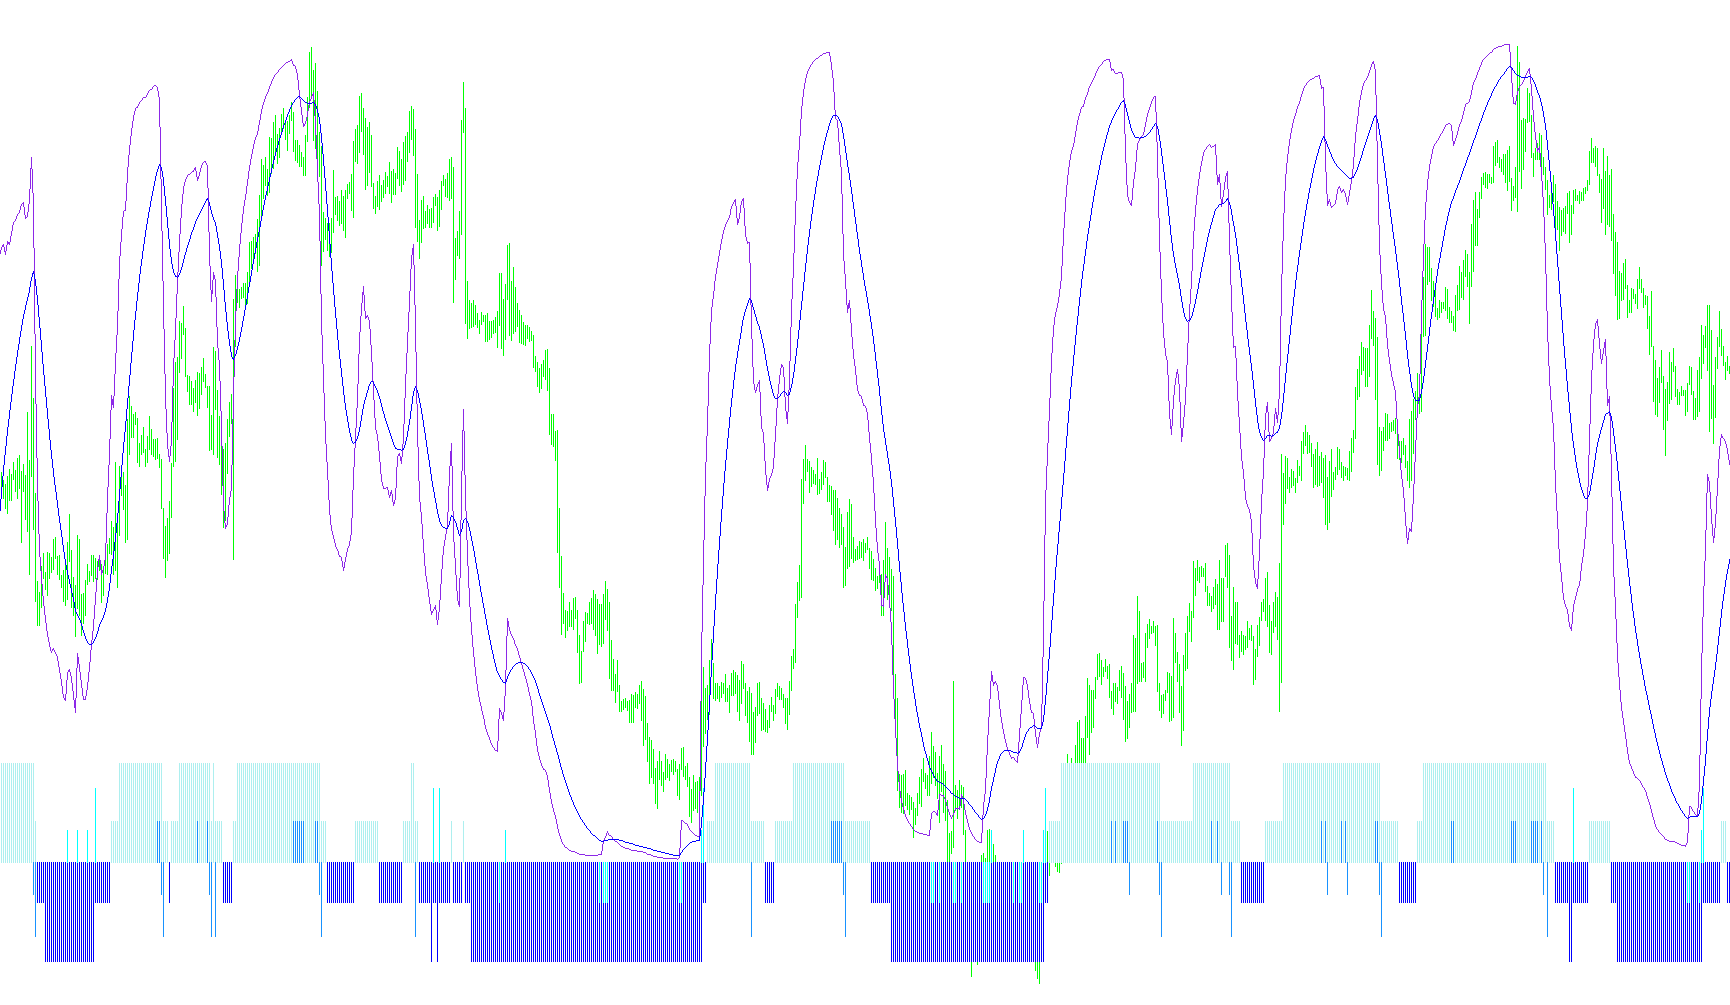
This indicator identifies structural market reversals by detecting geometric discrepancies between price action extremes and weighted RSI-based momentum oscillations.

ROC_MA
Indicator

ROC_MA

iMAiMAOnArray

This indicator quantifies the point distance between current price and its moving average, then applies a secondary smoothing layer to visualize volatility trends.

ROC_Smoothed
Indicator

ROC_Smoothed

iMA

This indicator calculates the rate of change between current and historical price points by applying various moving average filters, including Linear Scrutiny, Non-Lag algorithms, and standard exponential smoothing.

RollerCoaster
Indicator

RollerCoaster

iMA

This indicator visualizes price momentum by tracking moving averages alongside historical high and low peaks identified over a rolling five-bar window.

ronz_price_ma_candle
Indicator

ronz_price_ma_candle

iMA

This indicator visualizes the smoothed extremes of candle geometry by mapping moving averages of open, close, high, and low prices to identify structural momentum.

Round Numbers
Indicator

Round Numbers

iMA

Dynamically projects horizontal zones based on the nearest whole-cent price points to highlight significant liquidity boundaries.

RSI-TC
Indicator

RSI-TC

iBandsiATRiMAiRSI

This indicator identifies high-probability trend reversals by detecting Bollinger Band contractions (squeezes) followed by price breakouts in alignment with multi-colored RSI momentum shifts.

RSI-TC_001
Indicator

RSI-TC_001

iBandsiATRiMAiRSI

This indicator identifies high-probability reversal points by combining a dual-tone RSI filter with Bollinger Band volatility squeezes and Keltner Channel expansion signals.

RSI-TC_NEW
Indicator

RSI-TC_NEW

iBandsiATRiMAiRSI

This indicator identifies explosive market entries by detecting volatility compression between Bollinger Bands and Keltner Channels, filtered by dual-tone RSI momentum and directional band breakouts.

RSI-TC_NEW1
Indicator

RSI-TC_NEW1

iBandsiATRiMAiRSI

This indicator identifies high-probability trend reversals by detecting volatility expansion from a 'squeeze' state combined with multi-layered RSI momentum filtering.

RSI-TC_NEWd
Indicator

RSI-TC_NEWd

iBandsiATRiMAiRSI

This indicator identifies high-probability trend reversals by detecting price volatility compression using a Bollinger Band and Keltner Channel squeeze, coupled with RSI momentum filtering to trigger directional signals.

RSI-TC_NEW[1]
Indicator

RSI-TC_NEW[1]

iBandsiATRiMAiRSI

This indicator identifies high-probability momentum shifts by detecting price breakouts from low-volatility Keltner Channel squeezes while filtering directionality through a dual-tone Relative Strength Index.

RSI-TC_NEW_Alert2
Indicator

RSI-TC_NEW_Alert2

iBandsiATRiMAiRSI

This indicator identifies high-probability trend reversals by detecting price volatility compression (Squeeze) and validating breakouts through RSI momentum shifts and Bollinger Band expansions.

RSI-TC_NEW_v2
Indicator

RSI-TC_NEW_v2

iBandsiATRiMAiRSI

This indicator identifies high-probability trend continuations by detecting volatility 'squeezes' through Bollinger Band and Keltner Channel convergence, filtered by RSI momentum shifts.

RSI-TC_v1
Indicator

RSI-TC_v1

iBandsiATRiMAiRSI

This indicator identifies high-probability entries by synchronizing RSI momentum with the spatial divergence between Bollinger Bands and SuperTrend volatility envelopes.

RSIOMA Bollinger Bands
Indicator

RSIOMA Bollinger Bands

iMA

This indicator calculates a smoothed Relative Strength Index and overlays Bollinger Bands to identify trend exhaustion and momentum shifts via overbought/oversold signal triggers.

RSIOMA
Indicator

RSIOMA

iMA

This indicator calculates the Relative Strength Index by applying Exponential Moving Averages to price changes and identifies overbought/oversold reversals through specific trend-crossing signals.

RSIOMA_v2
Indicator

RSIOMA_v2

iMAiMAOnArray

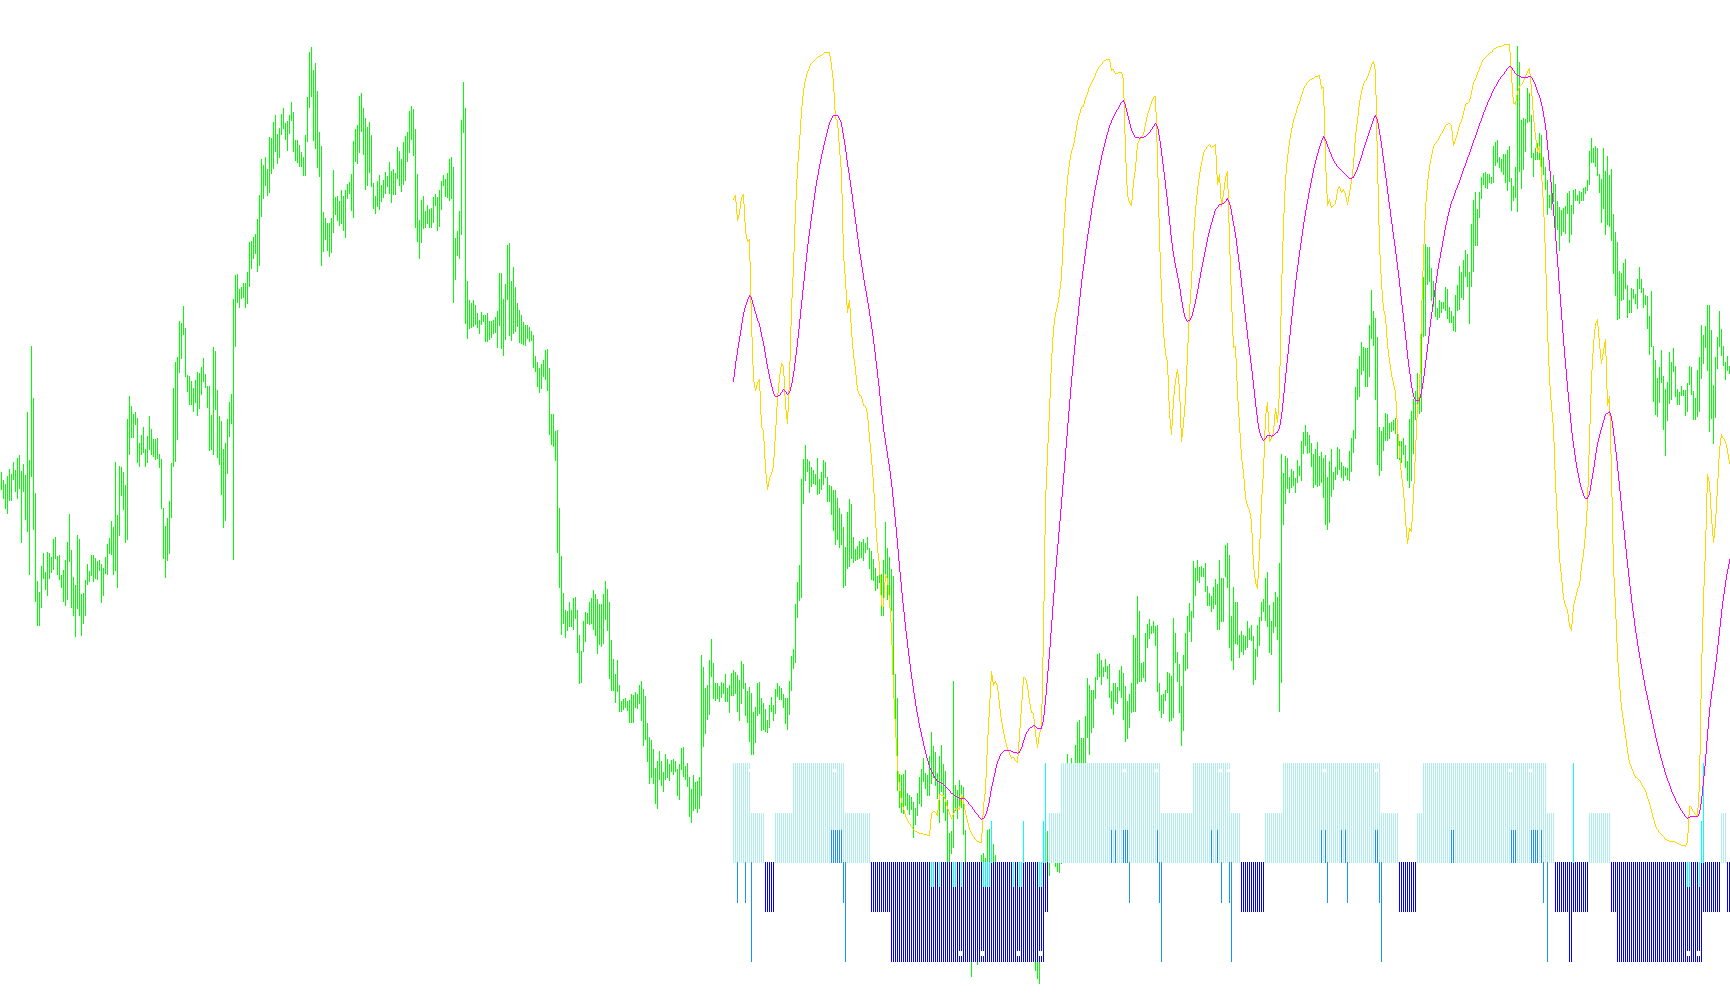
This indicator identifies momentum shifts by applying a dual-layer smoothed moving average to the Relative Strength Index while simultaneously highlighting trend violations and overextended price reversals through dynamic histogram triggers.

RSIOMA_v2HHLS
Indicator

RSIOMA_v2HHLS

iMAiMAOnArrayiRSIOnArray

This indicator synthesizes a dual-layered moving average on the Relative Strength Index to identify momentum shifts and visualize directional bias through multi-zone histogram signaling.

RSIOMA_v2HHLS22
Indicator

RSIOMA_v2HHLS22

iMAiMAOnArrayiRSIOnArray

This indicator synthesizes smoothed Relative Strength Index data with dual-layer moving averages to identify trend exhaustion, momentum shifts, and dynamic support/resistance transitions.

RSIOMA_v2HHLSX
Indicator

RSIOMA_v2HHLSX

iMAiMAOnArrayiRSIOnArray

This indicator identifies momentum shifts by calculating a Moving Average on an RSI-derived array to generate crossover signals and multi-level trend exhaustion zones.

RSIOMA_v2HHLSX_001
Indicator

RSIOMA_v2HHLSX_001

iMAiMAOnArrayiRSIOnArray

This indicator synthesizes a dual-layered Moving Average of the Relative Strength Index to identify momentum crossovers and dynamic trend exhaustion zones.

RSIOMA_v2HHLSX_v1
Indicator

RSIOMA_v2HHLSX_v1

iMAiMAOnArrayiRSIOnArray

This indicator synthesizes a smoothed Relative Strength Index with moving average crossovers and multi-tier volatility thresholds to identify momentum shifts and trend exhaustion.

RSIOMA_v2HHLSX__rev
Indicator

RSIOMA_v2HHLSX__rev

iMAiMAOnArrayiRSIOnArray

This indicator utilizes a dual-layer smoothing technique by applying a Moving Average to price data before calculating the RSI, then layering a secondary MA over that result to generate trend crossovers and momentum exhaustion signals.

RSIOMA_v2HHLSX__rev_alert
Indicator

RSIOMA_v2HHLSX__rev_alert

iMAiMAOnArrayiRSIOnArray

This indicator identifies trend shifts by calculating a Moving Average of the RSI on a pre-smoothed price buffer, generating visual signals and alerts upon momentum crossovers.

RSIOMA_v2HLS
Indicator

RSIOMA_v2HLS

iMAiMAOnArray

This indicator synthesizes a smoothed RSI with integrated moving averages and dynamic histogram overlays to identify momentum shifts and extreme price exhaustion levels.

RSIOMA_v2HLS22
Indicator

RSIOMA_v2HLS22

iMAiMAOnArray

This indicator combines a smoothed Relative Strength Index with a secondary moving average and dynamic histogram signals to identify trend shifts, momentum reversals, and extreme overbought or oversold conditions.

RSIOMA_v2MA
Indicator

RSIOMA_v2MA

iMAiMAOnArrayiRSIOnArray

This indicator calculates a Relative Strength Index based on smoothed moving average data, then applies a secondary moving average overlay to filter noise and identify trend momentum.

RSIOMA_v2MaMa
Indicator

RSIOMA_v2MaMa

iMAiMAOnArrayiRSIOnArray

This indicator calculates a nested momentum overlay by applying Smoothed Moving Averages (SMMA) over an RSI derived from an initial Moving Average sequence.

RSIOMA_v2MA_001
Indicator

RSIOMA_v2MA_001

iMAiMAOnArrayiRSIOnArray

This indicator computes a Relative Strength Index based on smoothed price data, then applies a secondary moving average to the resulting momentum for refined signal filtering.

RSIOMA_v2Only
Indicator

RSIOMA_v2Only

iMAiRSIOnArray

This indicator calculates a nested momentum metric by applying a Relative Strength Index calculation over a pre-smoothed Exponential Moving Average buffer.

RSIOMA_v2_001
Indicator

RSIOMA_v2_001

iMAiMAOnArray

This indicator calculates a smoothed Relative Strength Index combined with a moving average to identify momentum shifts and potential reversal zones through histogram signals.

RSIOMA_v2_006
Indicator

RSIOMA_v2_006

iMAiMAOnArrayiRSIOnArray

This indicator calculates a Relative Strength Index based on an Exponential Moving Average to identify trend shifts and detect extreme price exhaustion via multi-layered signal triggers.

RSIOMA_v2_v1
Indicator

RSIOMA_v2_v1

iMAiMAOnArray

This indicator identifies trend extremes and potential reversals by combining a smoothed Relative Strength Index with a secondary Moving Average overlay to highlight momentum shifts.

RSIOMA_v3
Indicator

RSIOMA_v3

iMAiMAOnArrayiRSIOnArray

This indicator employs a nested calculation of RSI on an Moving Average array to identify trend shifts and momentum extremes through multi-level signal crossovers.

RSIOMA_v3CDVar
Indicator

RSIOMA_v3CDVar

iMAiMAOnArrayiRSIOnArray

This indicator calculates a dynamic momentum spread by deriving a Moving Average, applying an RSI filter to that average, and then measuring the variance between that filtered value and its secondary moving average.

RSIOMA_v3L
Indicator

RSIOMA_v3L

iMAiRSIOnArray

This indicator calculates a Relative Strength Index based on a moving average of price data to provide a filtered momentum signal.

RSIOMA_v3LMA
Indicator

RSIOMA_v3LMA

iMAiMAOnArrayiRSIOnArray

This indicator calculates a Relative Strength Index based on an underlying Moving Average array, then applies a secondary smoothing moving average to the resulting RSI values to identify momentum trends.

RSIOMA_v3Var
Indicator

RSIOMA_v3Var

iMAiMAOnArrayiRSIOnArray

This indicator calculates a nested moving average of Relative Strength Index values derived from a primary moving average to filter out market noise and identify structural trend shifts.

RSIOMA_v3_alerts
Indicator

RSIOMA_v3_alerts

iMAiMAOnArrayiRSIOnArray

This indicator utilizes a nested RSI calculation on moving average arrays to identify trend reversals and momentum shifts through moving average crossovers and dynamic threshold breaches.

RSIOMA_v3_alertsD
Indicator

RSIOMA_v3_alertsD

iMAiMAOnArrayiRSIOnArray

This indicator identifies momentum shifts by calculating an RSI on a smoothed Moving Average array and detects trend reversals through multi-level threshold breaches and moving average crossovers.

RSIOMA_v3_alertsD_002
Indicator

RSIOMA_v3_alertsD_002

iMAiMAOnArrayiRSIOnArray

This indicator identifies trend shifts and exhaustion points by calculating a smoothed RSI on a Moving Average array and monitoring its crossovers against dynamic trend, trigger, and signal thresholds.

RSIOMA_v3_alerts_002
Indicator

RSIOMA_v3_alerts_002

iMAiMAOnArrayiRSIOnArray

This indicator identifies trend reversals and momentum shifts by analyzing the intersection of an RSI-based moving average with dynamic overbought, oversold, and midline threshold levels.

Indicator

RSIOMA_v4-Lines

iMAiMAOnArrayiRSIOnArray
Indicator

RSIOMA_v4

iMAiMAOnArrayiRSIOnArray
Indicator

RSIOMA_v4_v1

iMAiMAOnArrayiRSIOnArray
RSIonMA
Indicator

RSIonMA

iMAiRSIOnArray

This indicator computes Relative Strength Index values derived from two distinct Moving Average layers to filter noise and identify momentum trends.

RSI_MA
Indicator

RSI_MA

iMA

This indicator calculates the Relative Strength Index and modulates its value by the point difference of a weighted exponential moving average to highlight velocity changes.

RSI_MA_LevelSignal
Indicator

RSI_MA_LevelSignal

iMAiRSI

This indicator identifies bullish and bearish entries by detecting RSI oversold/overbought breakouts synchronized with EMA trend alignment and dynamic price range volatility.

rsi_ma_trade_sist
Indicator

rsi_ma_trade_sist

iATRiMAiRSI

This indicator identifies trend reversals by detecting concurrent EMA crossovers and RSI threshold breaches to confirm momentum shifts.