TSSuperTrendSTS
Indicator

TSSuperTrendSTS

iATRiMA

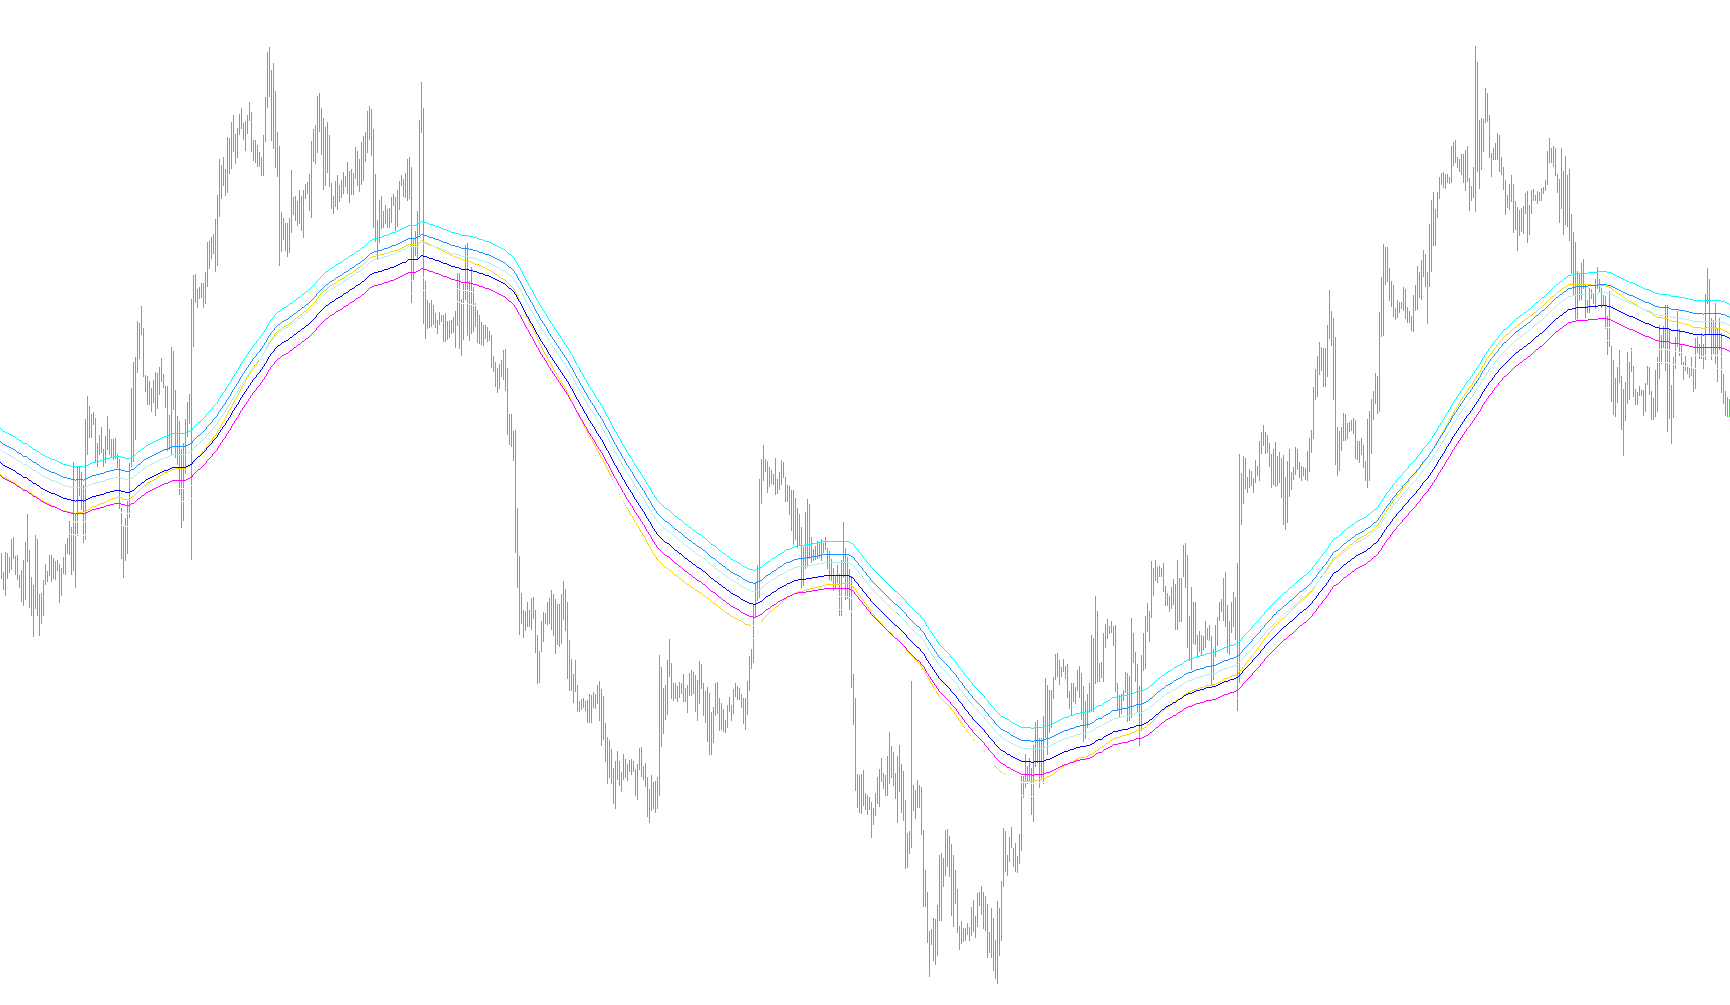
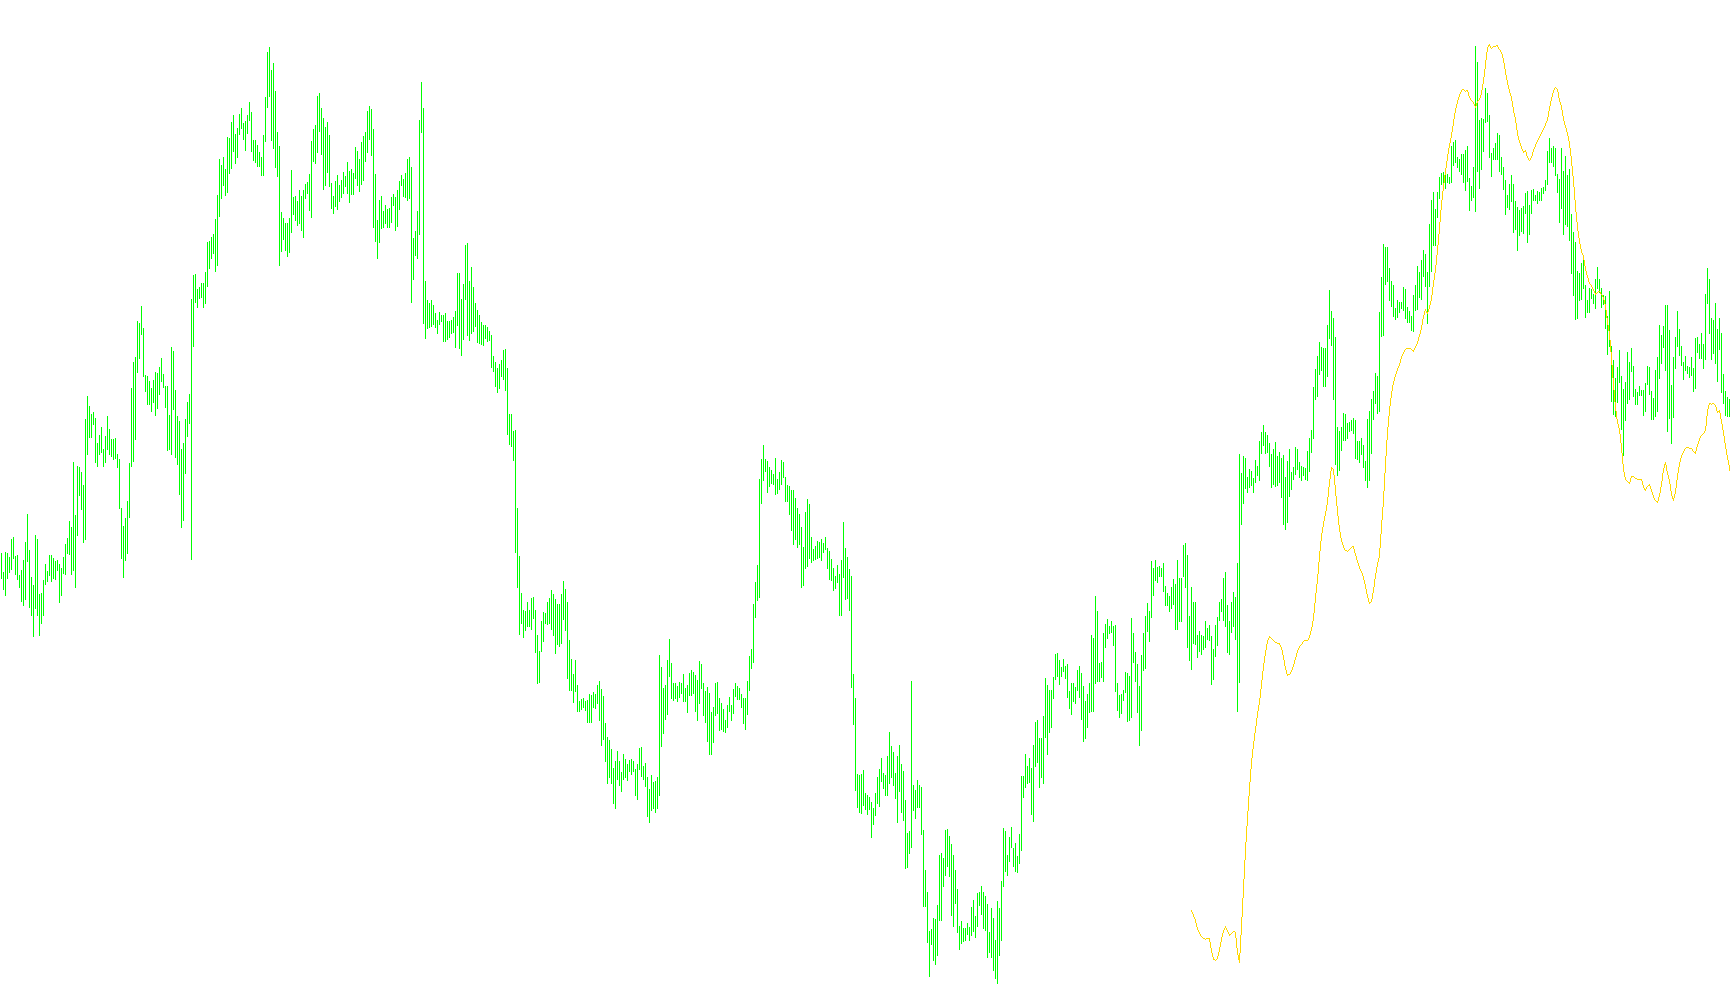
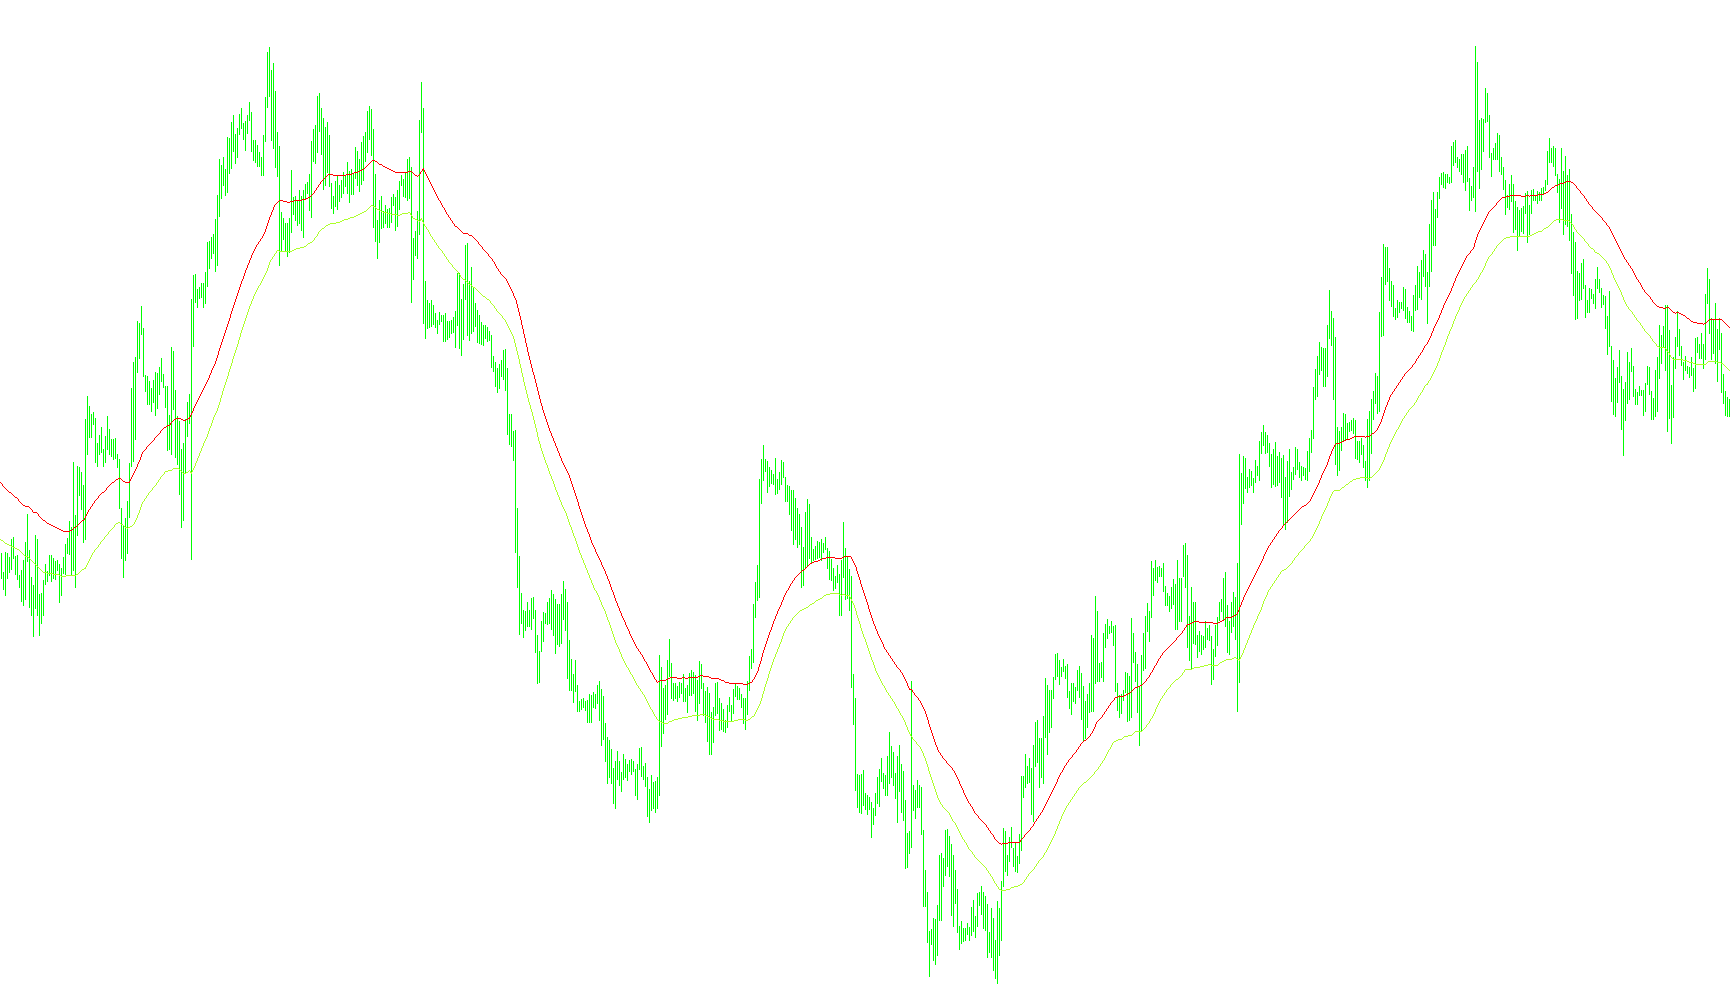
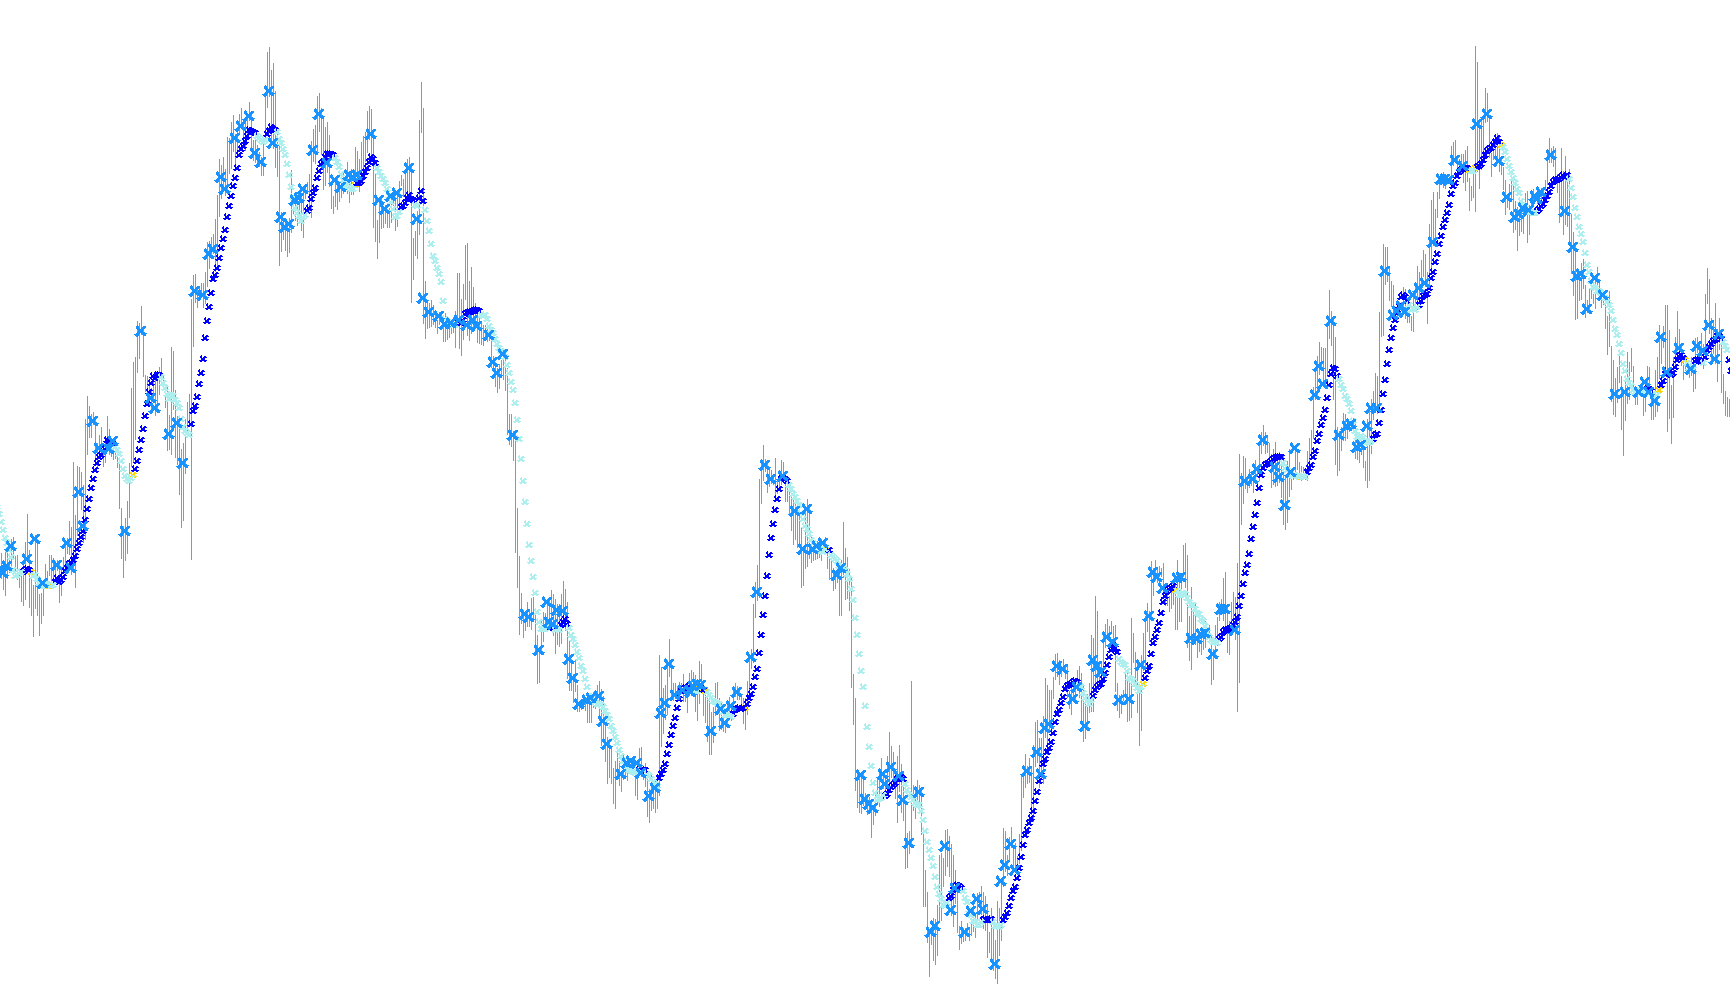
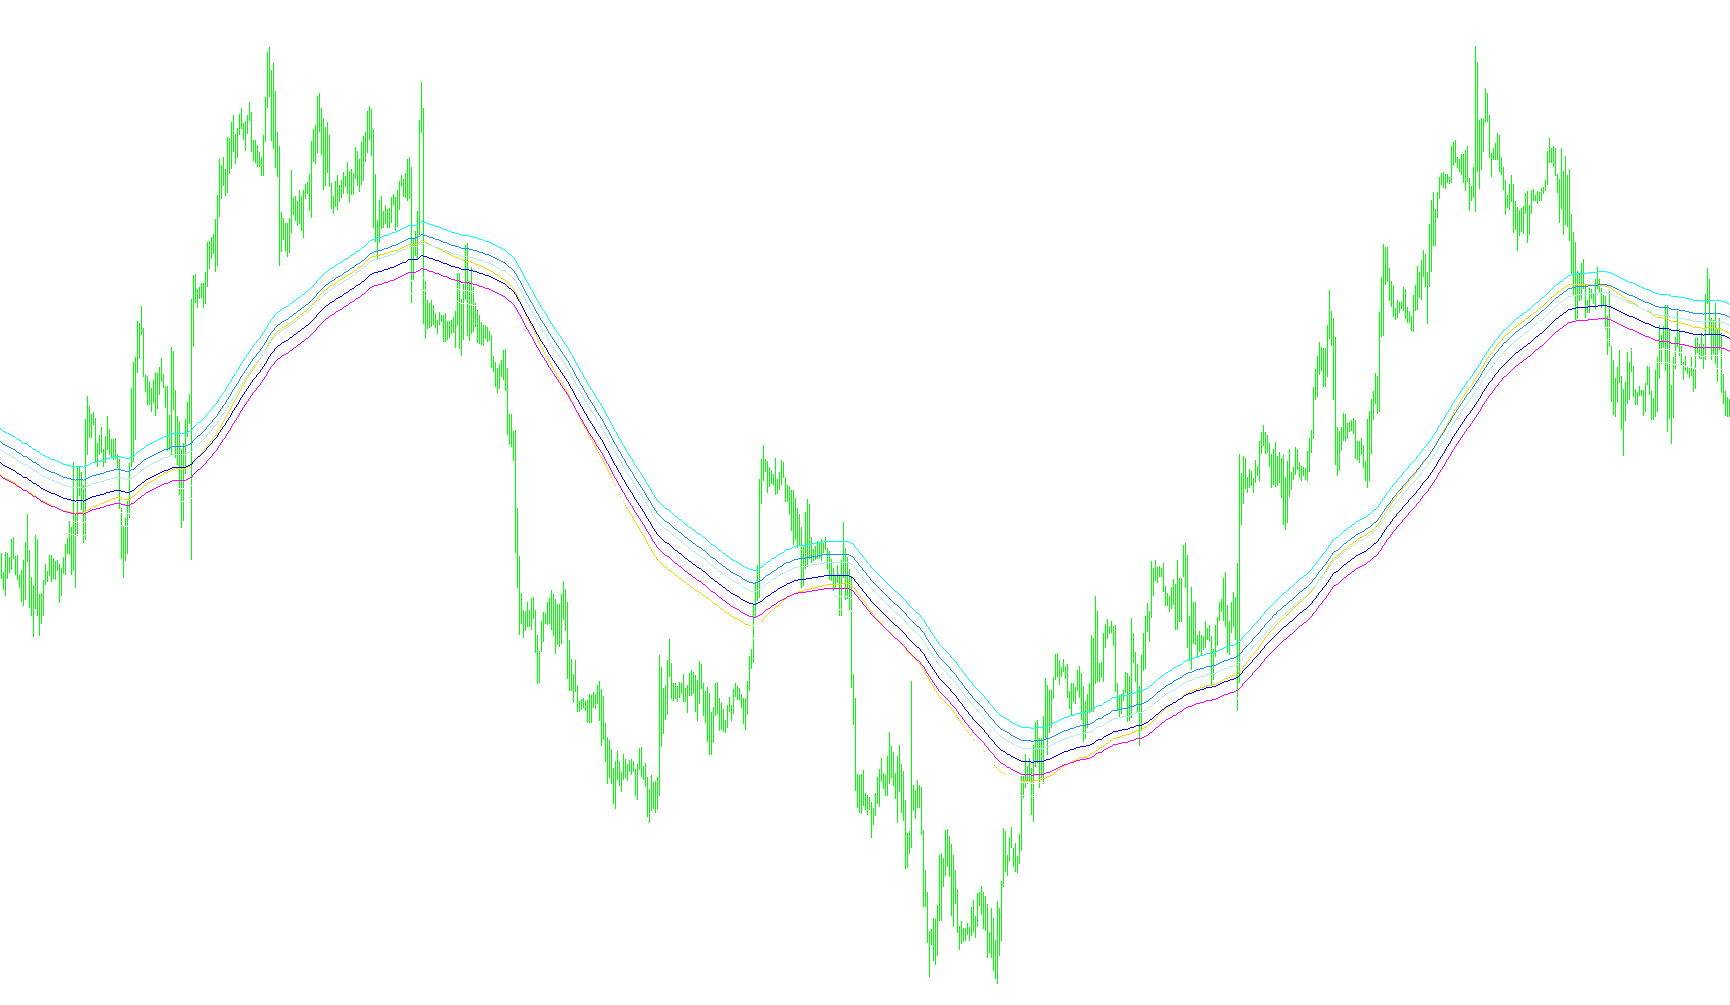
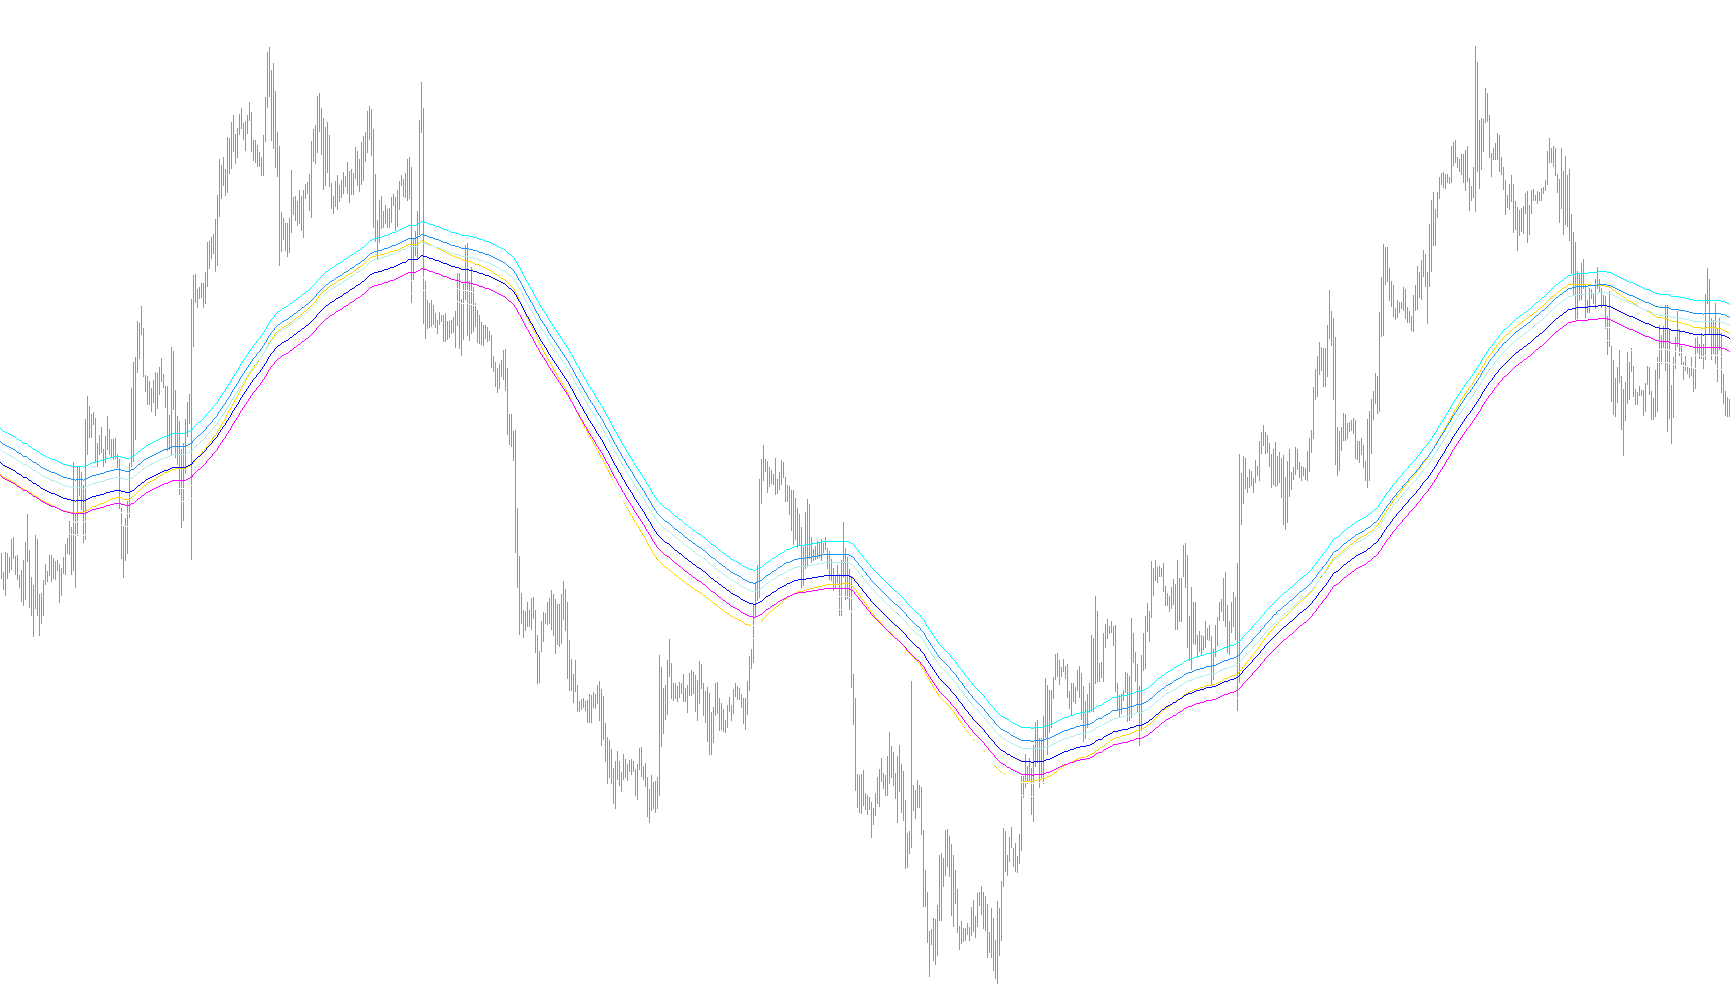
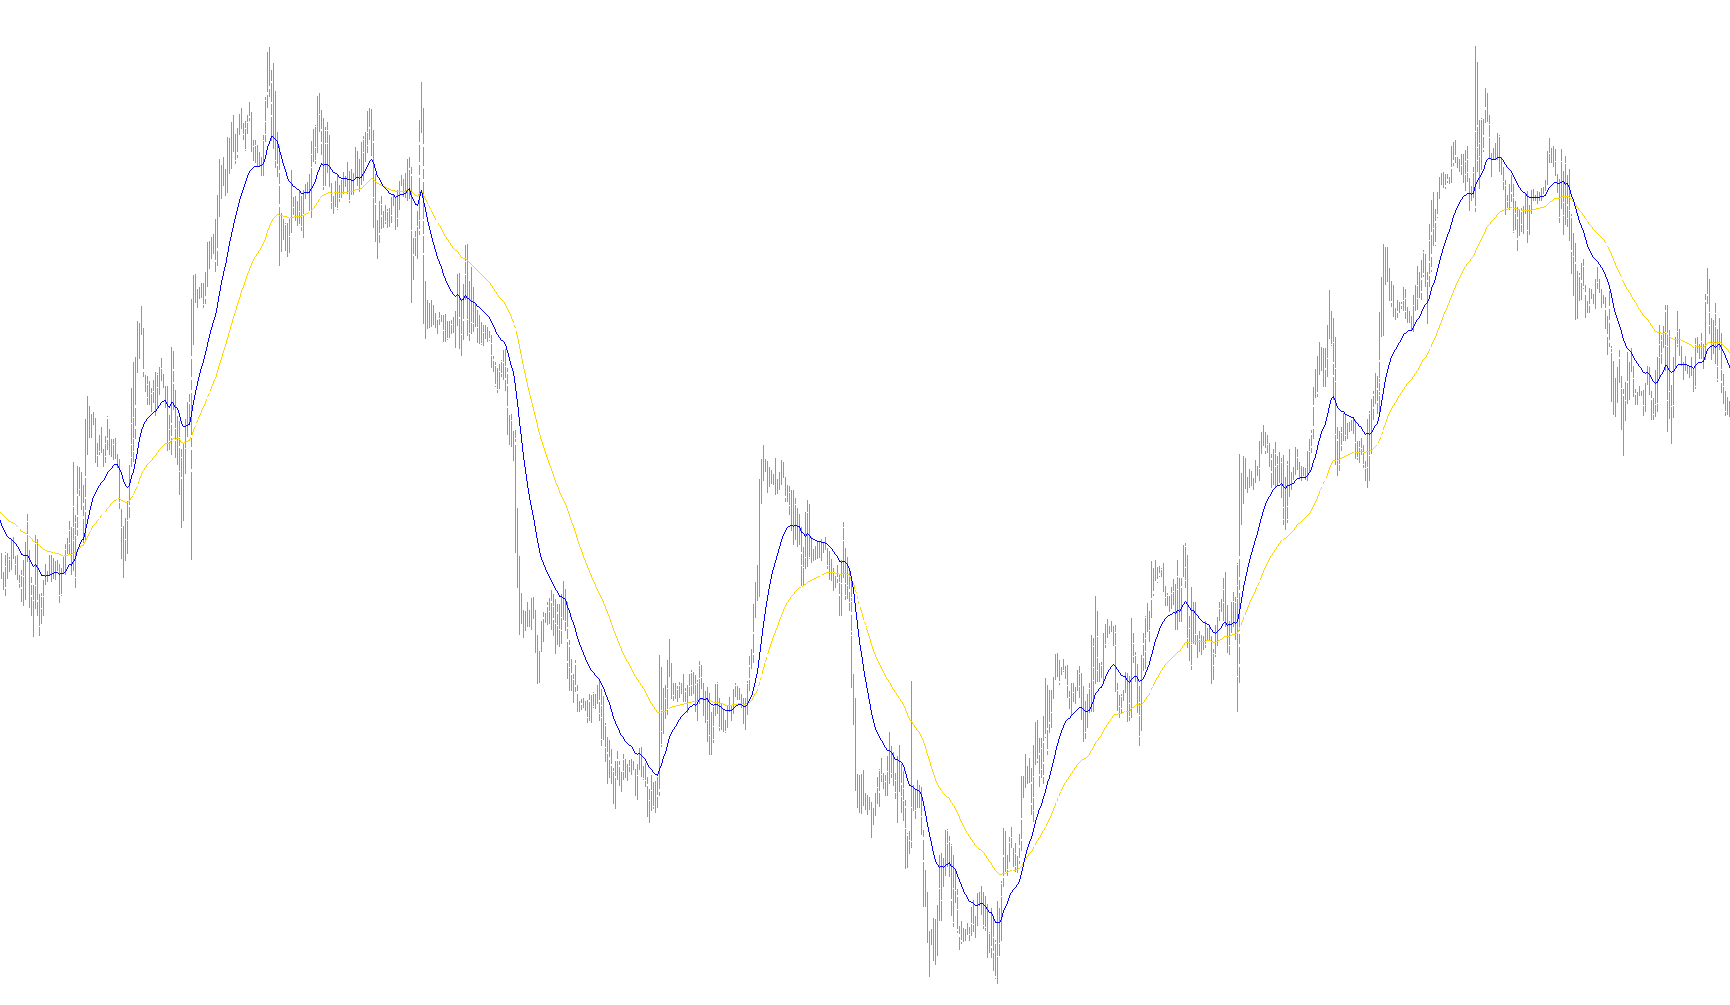
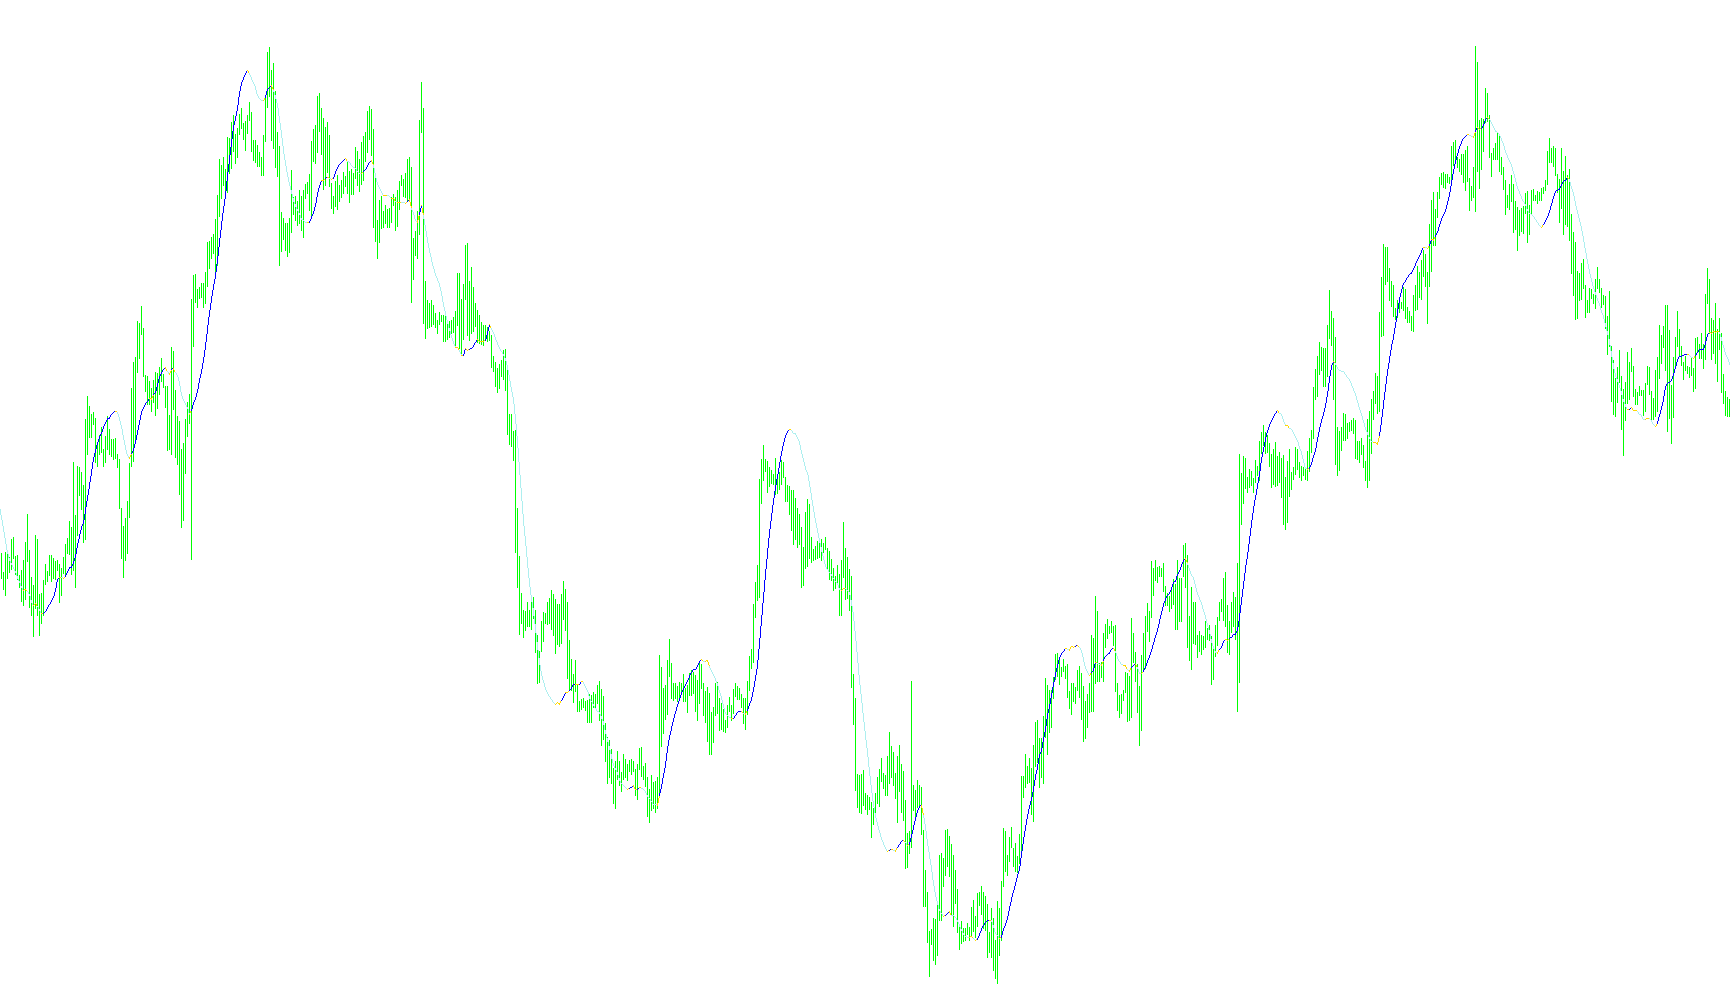
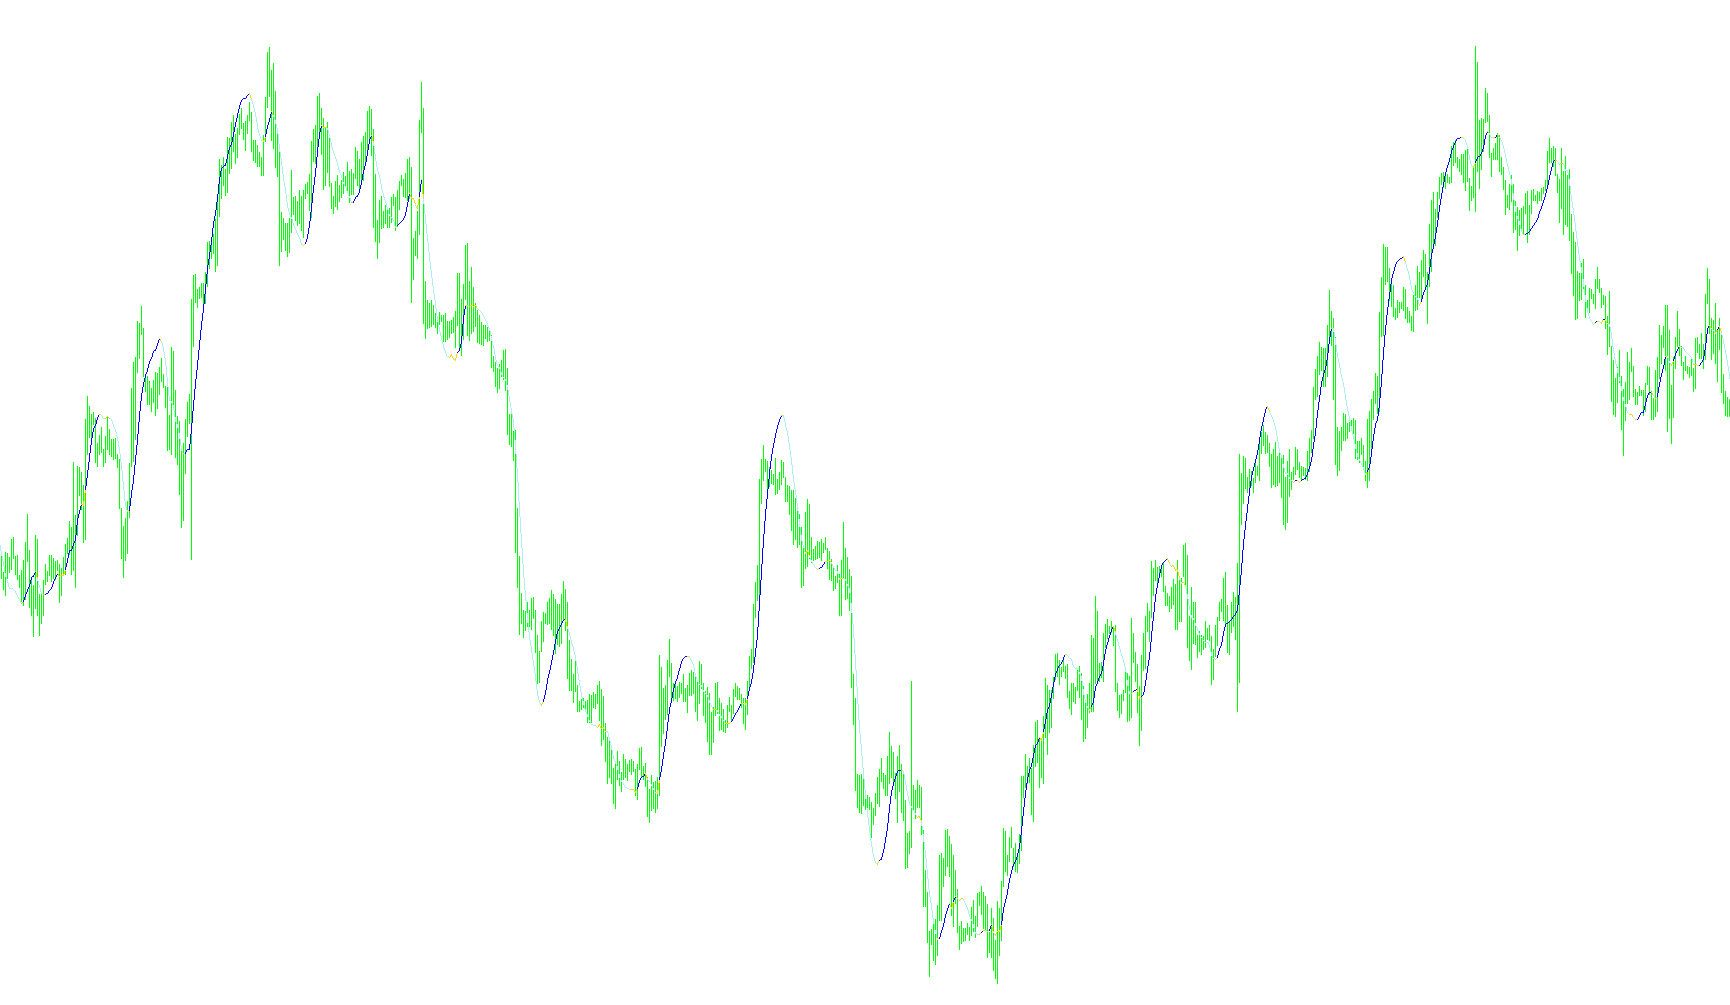
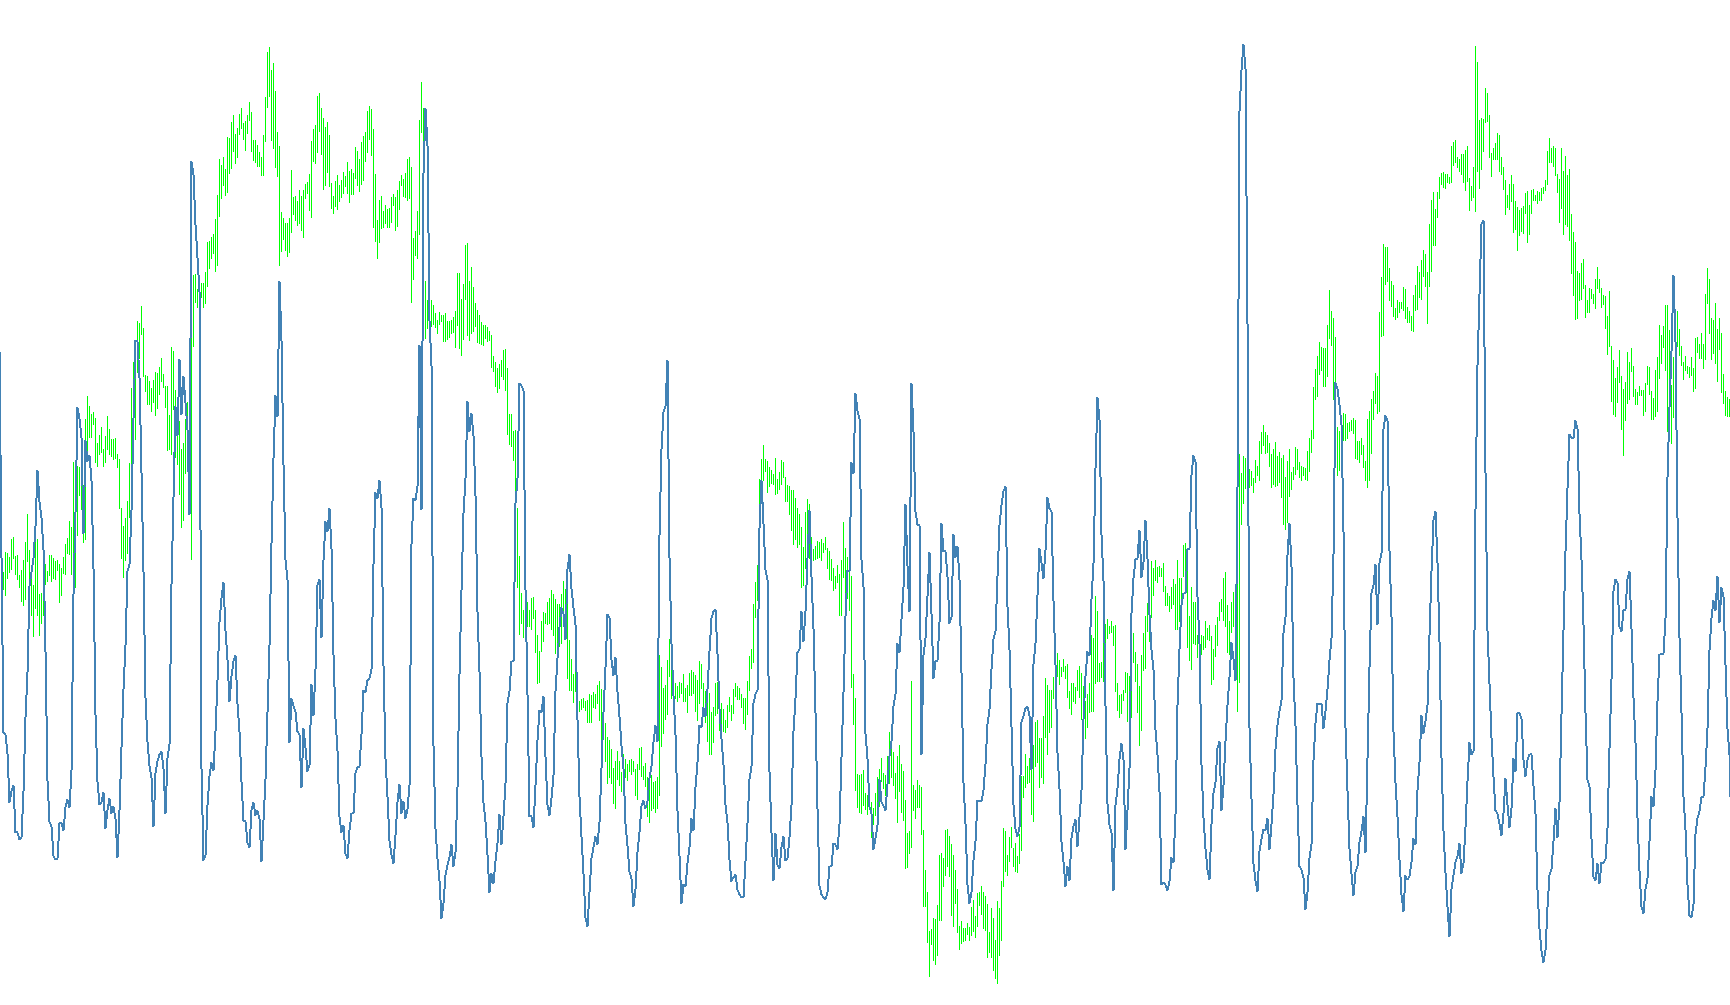
This indicator dynamically maps market direction by calculating a smoothed price baseline adjusted by either ATR-based volatility or Dual Thrust range expansions to identify trend flips.

TTM
Indicator

TTM

iMA

This indicator identifies significant price breakouts by comparing closing prices against exponential moving average boundaries divided into ternary segments.

TTM_v1
Indicator

TTM_v1

iMA

This indicator identifies bullish and bearish momentum by comparing price action against calculated price range thirds derived from Exponential Moving Averages of the high and low extremes.

tunnel
Indicator

tunnel

iMA

This indicator maps multiple Fibonacci-based price levels relative to a secondary EMA, generating real-time alerts when market prices intersect with these dynamic equilibrium zones.

tunnel_v1
Indicator

tunnel_v1

iMA

This indicator calculates dynamic support and resistance levels by projecting Fibonacci retracement distances from a secondary Exponential Moving Average base.

tunnel_v2
Indicator

tunnel_v2

iMA

This indicator projects symmetrical Fibonacci retracement levels based on a secondary Exponential Moving Average to identify price volatility boundaries and potential reversal points.

Indicator

Turbo_PT_Scalper

iMA
turn_area
Indicator

turn_area

iMAiRSI

This indicator visualizes the dynamic divergence between an Exponential Moving Average and a scaled Relative Strength Index to identify potential trend exhaustion zones.

turn_area_chart
Indicator

turn_area_chart

iMAiRSI

This indicator visualizes a dynamic trading corridor by projecting RSI-based momentum deviations and upper/lower volatility thresholds onto a smoothed Exponential Moving Average baseline.

TZ Trend 30 min
Indicator

TZ Trend 30 min

iMA

This indicator identifies market momentum by analyzing the sequential stacking of three distinct Exponential Moving Averages to distinguish between bullish, bearish, and neutral price structures.

t_ma
Indicator

t_ma

iMA

This indicator visualizes a primary Linear Weighted Moving Average alongside a secondary smoothed average derived from the mean of six consecutive LWMA nodes based on opening prices.

Indicator

UltimateMACD

iMAOnArrayiMA
Ultitimate Oscillator
Indicator

Ultitimate Oscillator

iMA

This indicator calculates the aggregate momentum of price action by summing three distinct Linear Weighted Moving Averages across 7, 14, and 28 period intervals.

Ultitimate Oscillator_v1
Indicator

Ultitimate Oscillator_v1

iMA

This indicator quantifies trend velocity by calculating the sum of three distinct Linear Weighted Moving Averages across short, medium, and long timeframes.

Ultitimate Oscillator_v2
Indicator

Ultitimate Oscillator_v2

iMA

This indicator calculates a composite momentum value by summing three distinct linear weighted moving averages to identify overarching trend cohesion.

Ultitimate_Oscillator
Indicator

Ultitimate_Oscillator

iMA

The indicator calculates a smoothed momentum value by averaging three distinct Linear Weighted Moving Averages over the 7, 14, and 28 periods.

Ultra
Indicator

Ultra

iATRiMAiRSI

This indicator synthesizes Fibonacci, Prime, and Standard pivot calculations with RSI momentum tracking and ATR-based volatility scaling to identify structural price levels.

ultra_oscillator
Indicator

ultra_oscillator

iMA

This indicator synthesizes three distinct periods of Linear Weighted Moving Averages to create a composite momentum trend line.

updown_resistance
Indicator

updown_resistance

iMA

Identifies structural price extremes by locating local maxima and minima within moving average curvature shifts to project dynamic horizontal supply and demand zones.

Urban_Towers
Indicator

Urban_Towers

iMA

This indicator identifies trend reversals by detecting price breakouts from a dynamic multi-moving average envelope supported by sequential high/low verification.

Urovny
Indicator

Urovny

iMA

This indicator plots a dynamic corridor by calculating Exponential Moving Averages on the high and low price points, adjusted by a user-defined volatility offset.
valasssp
Indicator

valasssp

iMACDiMAiRSIiStochastic

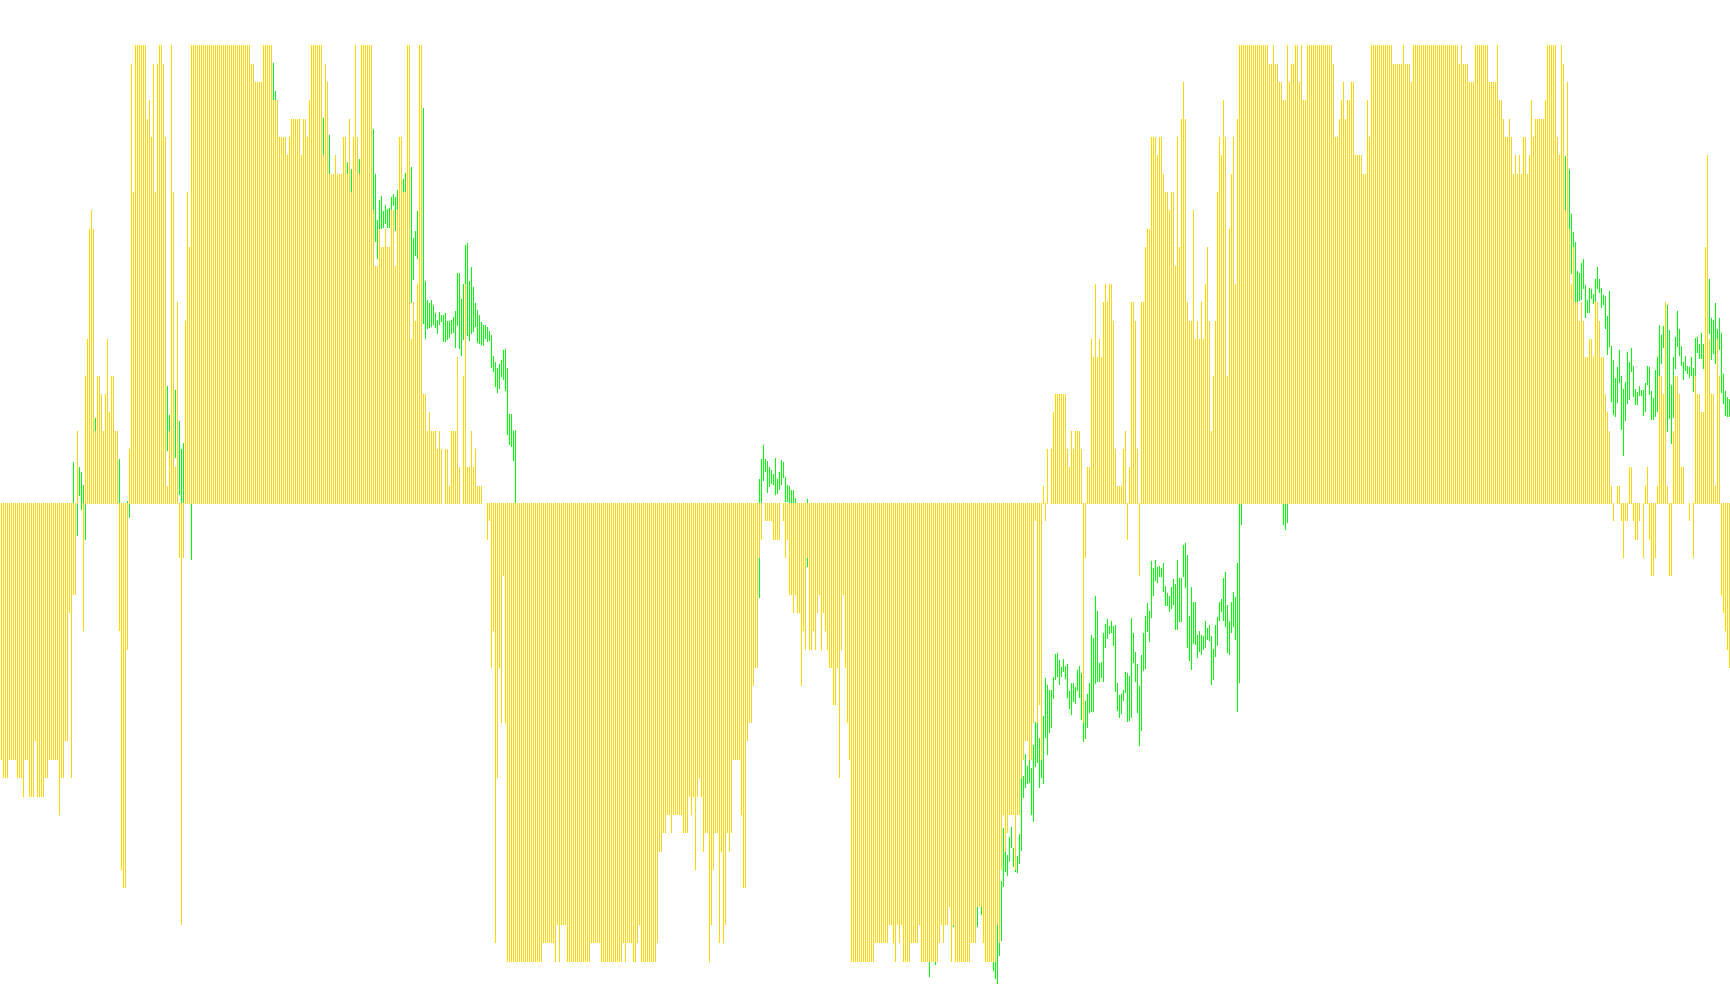
This indicator identifies high-probability trade entries by synchronizing EMA trends across M30, H1, H4, and D1 timeframes while validating momentum via RSI and MACD crossovers.
Indicator

vanman1.0

iMA
Variator
Indicator

Variator

iMA

This indicator identifies trend direction by measuring the cumulative price variation of a moving average and signaling reversals through bullish or bearish candle flips during active momentum states.

Vasily Pip Sniper bar v3.1 alert
Indicator

Vasily Pip Sniper bar v3.1 alert

iMAiMAOnArray

This indicator identifies trend reversals by calculating the differential between dual moving average deviations and dynamic momentum offsets.

Indicator

Vasily Pip Sniper bar v3.1 alert_001

iMAiMAOnArray
Vasily Pip Sniper bar v3.1
Indicator

Vasily Pip Sniper bar v3.1

iMAiMAOnArray

The algorithm identifies directional shifts by calculating the differential between nested moving average deviations across dynamic, timeframe-adaptive periods.

Vasily_Pip_Sniper_v3.1
Indicator

Vasily_Pip_Sniper_v3.1

iMAiMAOnArray

This indicator calculates the differential between multi-layered moving average deviations to identify momentum shifts across varying timeframes.

Vasily_Pip_Sniper_v3.1Ratio
Indicator

Vasily_Pip_Sniper_v3.1Ratio

iMAiMAOnArray

This indicator calculates the relative momentum between two moving averages by computing the percentage difference of their respective linear regressions.

Vasily_Pip_Sniper_v3.1Ratio2xx
Indicator

Vasily_Pip_Sniper_v3.1Ratio2xx

iMAiMAOnArray

This indicator calculates the percentage divergence between smoothed moving averages and their derived linear components to identify momentum shifts across multiple timeframes.

VAZ2107U
Indicator

VAZ2107U

iMA

Identifies high-probability entry points by synchronizing 7/21 SMA crossovers with Gann HiLo Activator trend confirmation and open price positioning.

Vegas Currency Daily
Indicator

Vegas Currency Daily

iMA

This indicator projects symmetrical Fibonacci retracement levels around an Exponential Moving Average to identify potential price reversal and liquidity zones.

Vegas1HR
Indicator

Vegas1HR

iMA

This indicator projects dynamic Fibonacci retracement levels based on the deviation from a primary 169-period Exponential Moving Average to identify structural support and resistance zones.

Vegas1HR_v1
Indicator

Vegas1HR_v1

iMA

This indicator projects a multi-layered Fibonacci retracement framework centered around a 169 EMA to identify high-probability price reversal and support/resistance levels.

Vegas1HR_v2
Indicator

Vegas1HR_v2

iMA

This indicator projects dynamic price zones based on a secondary EMA baseline using Fibonacci sequence offsets to identify potential liquidity areas and mean reversion levels.

Vegas1HR_v3
Indicator

Vegas1HR_v3

iMA

This indicator projects symmetric Fibonacci-based price levels around a primary Exponential Moving Average to identify potential liquidity zones and structural pivot points.

vForce_Like_Indy
Indicator

vForce_Like_Indy

iBearsPoweriADXiRSIiStochastic

This indicator identifies high-probability trend reversals by synchronizing bullish and bearish signals across Stochastic, RSI, ADX, MACD, Bull/Bear Power, Rate of Change, and Bollinger Bands.

VininI LRMA color
Indicator

VininI LRMA color

iMA

This indicator calculates a weighted fusion of Simple and Linear Weighted Moving Averages to generate directional momentum signals based on slope fluctuations.

VininI_CMA
Indicator

VininI_CMA

iMAiStdDev

The algorithm dynamically adjusts price smoothing by weighting the distance between a moving average and historical volatility using a coefficient-based standard deviation filter.

VininI_HMA_sound&Alert
Indicator

VininI_HMA_sound&Alert

iMAiMAOnArray

This indicator calculates the dynamic volatility of a Hull Moving Average by identifying its rate of change to detect momentum shifts and trend reversals.

VininI_HMA_Sound&Alert_en
Indicator

VininI_HMA_Sound&Alert_en

iMAiMAOnArray

This indicator identifies momentum shifts by calculating the directional velocity of a Hull Moving Average to highlight trend reversals via price slope transitions.

VininI_Trend
Indicator

VininI_Trend

iMA

Calculates a relative sentiment score by quantifying the frequency of price closes relative to a series of multiple moving averages.

VininI_Trend_LRMA
Indicator

VininI_Trend_LRMA

iMAiMAOnArray

This indicator calculates a weighted momentum score by comparing a primary Linear Regression Moving Average against a multi-step array of MA periods to determine trend dominance.

Vinin_LRMA_Color_Sound
Indicator

Vinin_LRMA_Color_Sound

iMA

The indicator calculates a weighted difference between Simple Moving Averages and Linear Weighted Moving Averages to visualize directional trend shifts via dynamic color transitions.

Vitesse
Indicator

Vitesse

iMAiMAOnArray

This indicator quantifies market momentum by calculating the smoothed percentage rate of change between consecutive simple moving averages.

Volatility 3 pairs
Indicator

Volatility 3 pairs

iMA

Quantifies the spread between dual moving averages across GBPUSD, USDJPY, and GBPJPY to highlight relative price momentum and volatility shifts.

Volatility2
Indicator

Volatility2

iMA

Calculates the percentage variance between high and low simple moving averages to quantify market price fluctuations.

Volatility4
Indicator

Volatility4

iMA

Quantifies price action intensity by calculating the scaled variance between moving averages of high and low price extremes.

Indicator

Volatility_Pivot_AplPrice_mtf

iATRiMAiMAOnArray
Indicator

VoltyChannel_Stop

iATRiMA