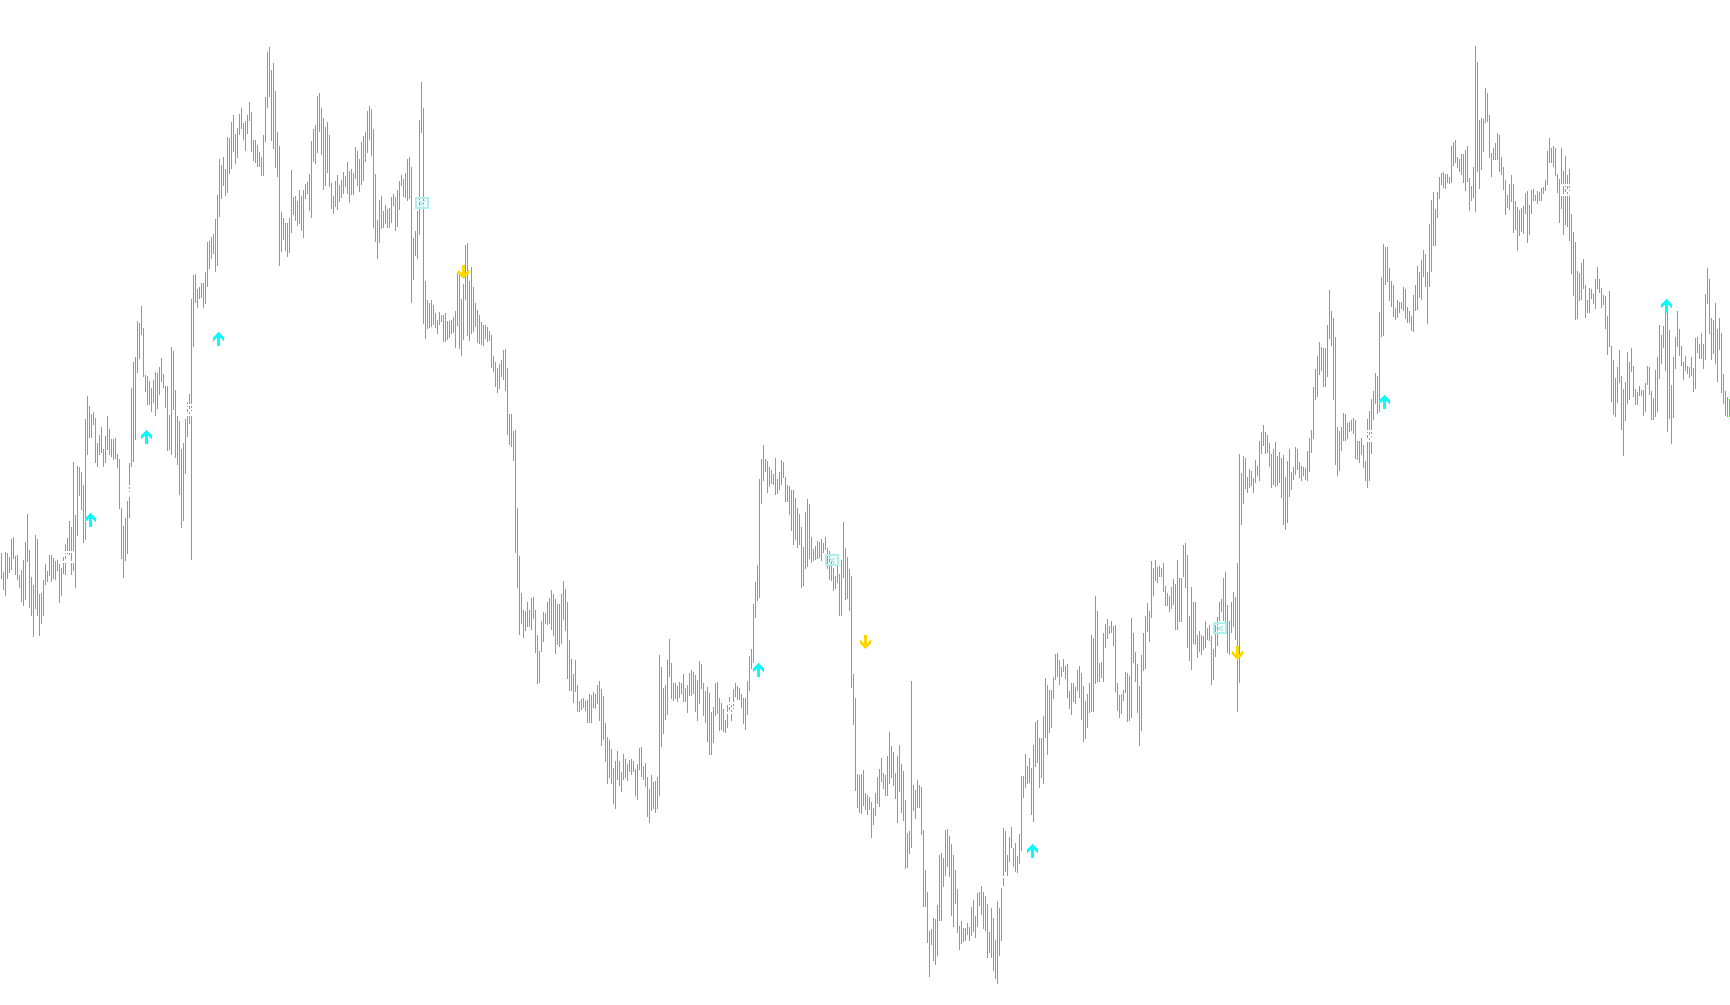
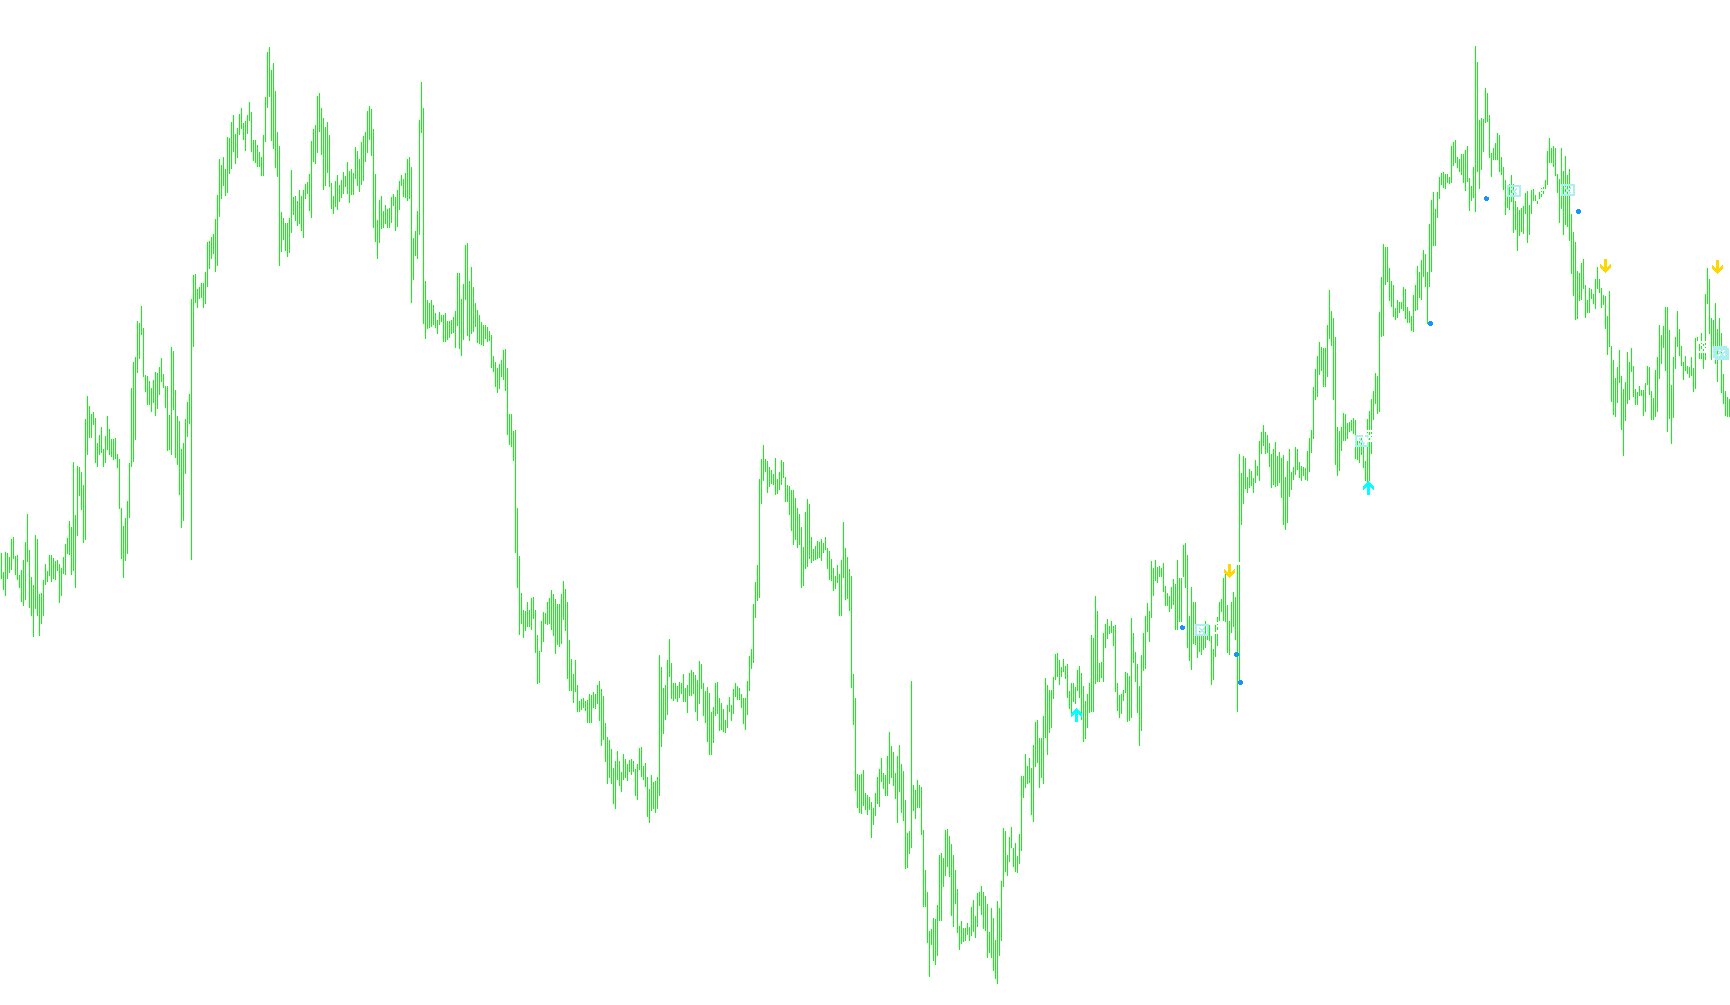
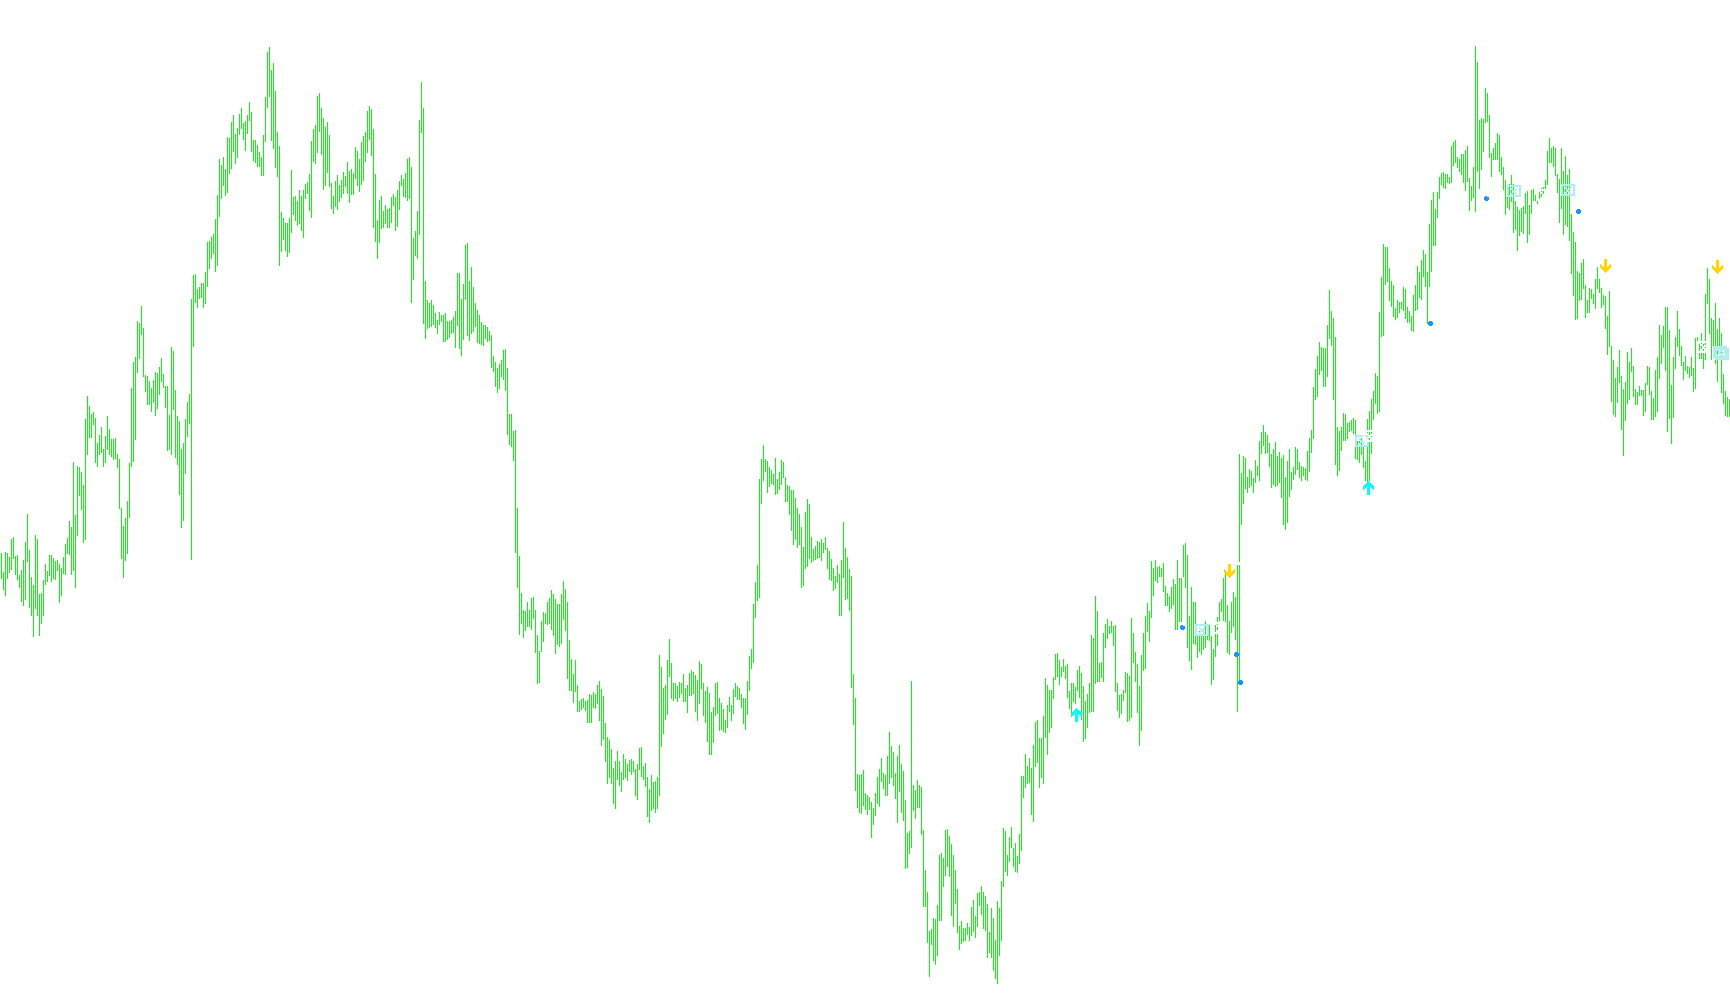
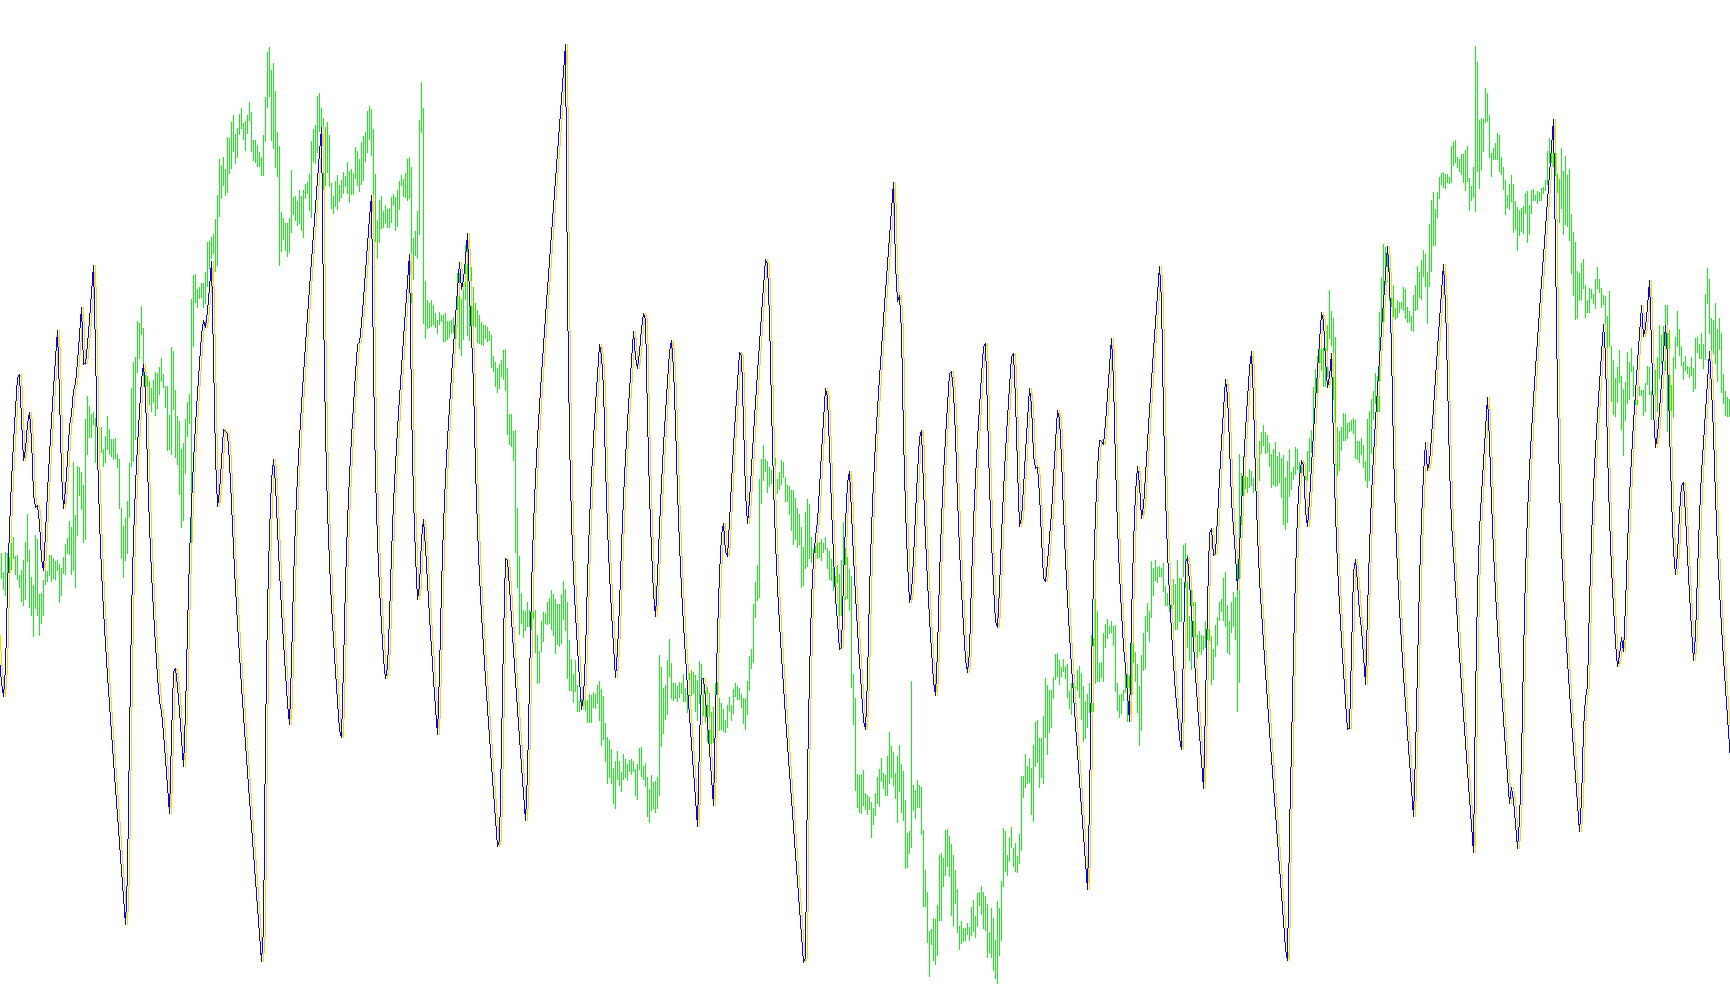
xpMA_v1
Indicator

xpMA_v1

iMAiMAOnArray

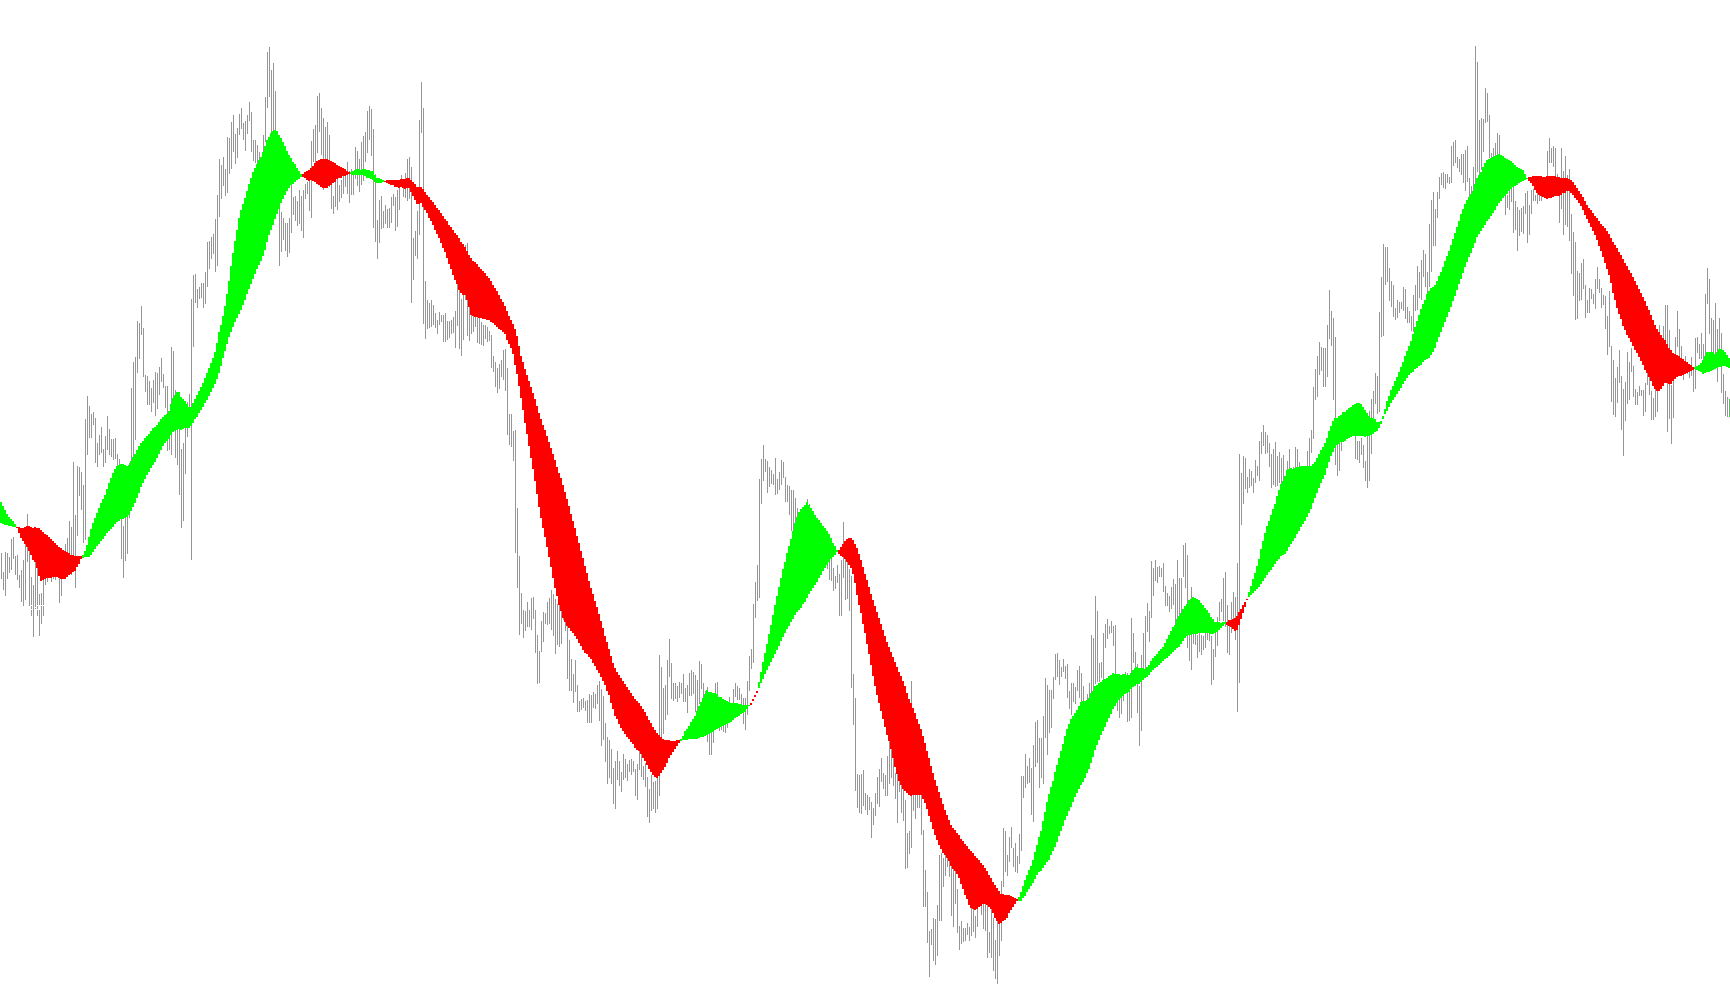
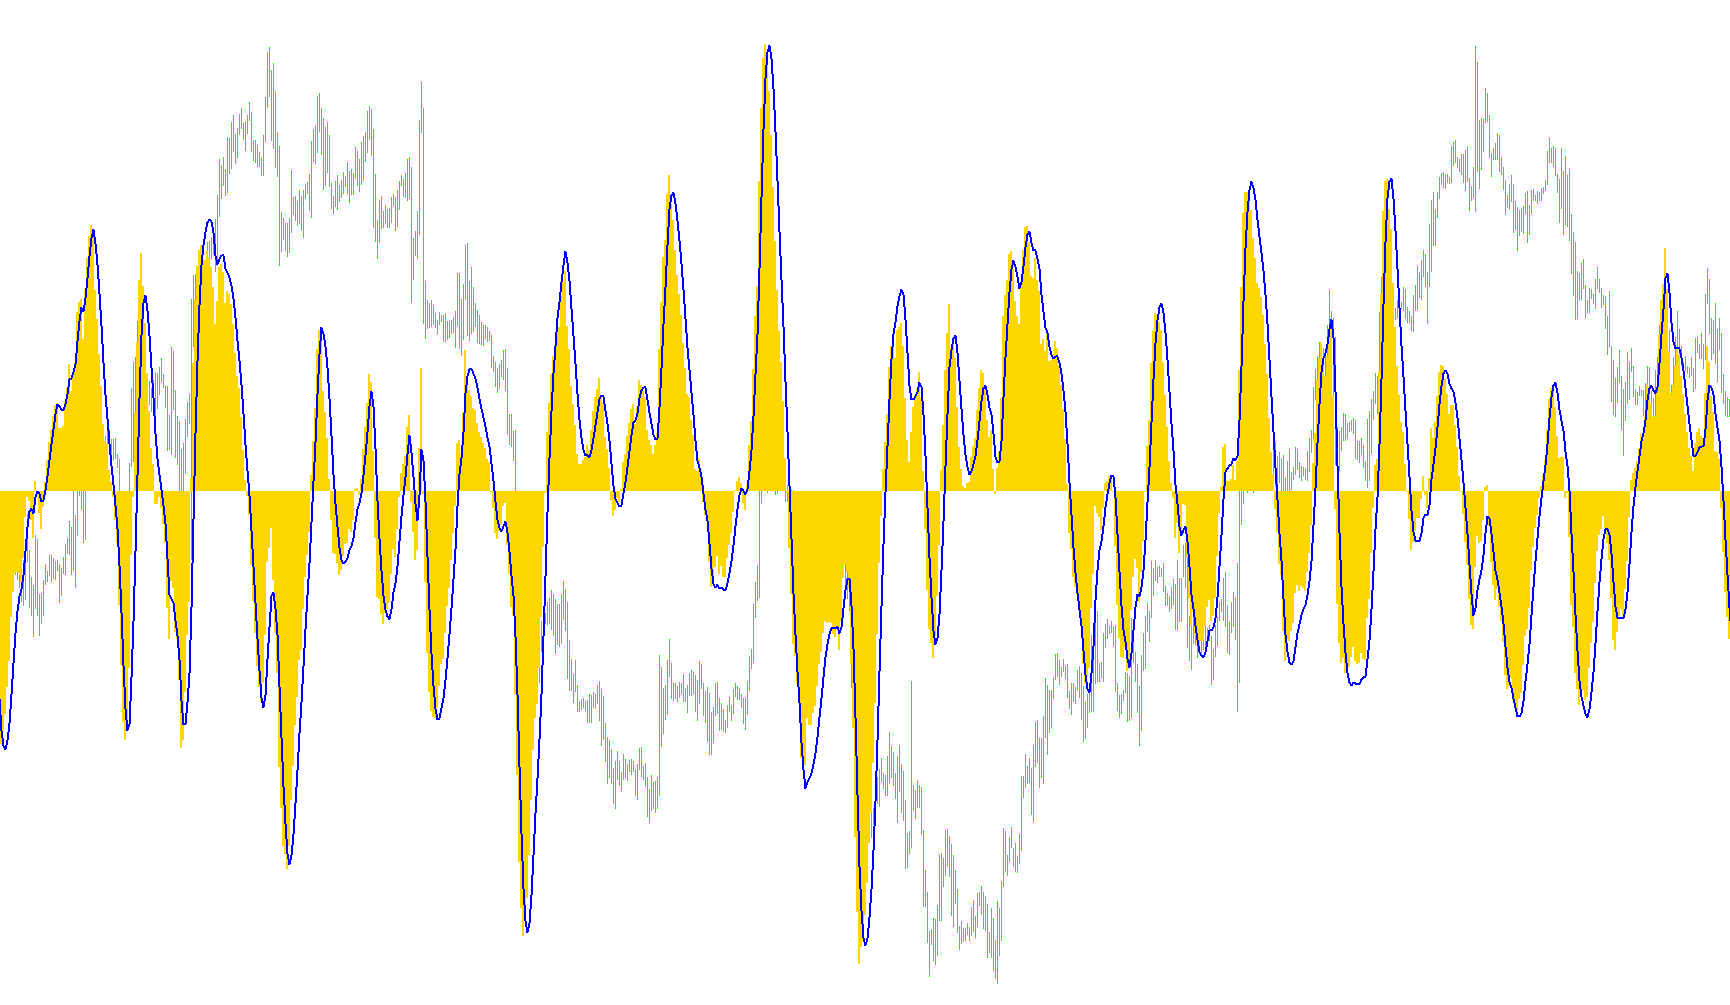
This indicator calculates advanced moving averages including DEMA, TEMA, and T3 models to visualize directional price momentum via dynamic color-coded trend shifts.

xpMA_v2
Indicator

xpMA_v2

iMAiMAOnArray

This indicator synthesizes multiple moving average methodologies, including DEMA, TEMA, and T3, to visualize directional velocity through dynamic trend-following buffers.

xpMA_v2FATL
Indicator

xpMA_v2FATL

iMAiMAOnArray

This indicator calculates diverse moving average methodologies including DEMA, TEMA, T3, Jurik, and FATL to visualize price momentum shifts and directional trend reversals through dynamic buffer plotting.

xpMA_v2JMA
Indicator

xpMA_v2JMA

iMAiMAOnArray

This indicator dynamically computes diverse moving average types, including Jurik and T3, to visualize directional momentum shifts through comparative price trajectory analysis.

xpMA_v2SATL
Indicator

xpMA_v2SATL

iMAiMAOnArray

This indicator computes various advanced moving average types, including DEMA, T3MA, and JMA, to visualize directional trend shifts via price velocity analysis.

xpMA_v2SATLm
Indicator

xpMA_v2SATLm

iMAiMAOnArray

This indicator synthesizes various complex moving average models, including T3, Jurik, and SATL, to visualize momentum shifts through directional trend coloring.

xpMA_v2_SATL_FATL
Indicator

xpMA_v2_SATL_FATL

iMAiMAOnArray

This indicator calculates a versatile array of moving averages, including complex variations like T3 and Jurik, to visualize price momentum shifts and directional trajectory.

xpMA_v2_SATL_FATL_T3
Indicator

xpMA_v2_SATL_FATL_T3

iMAiMAOnArray

A versatile technical indicator that synthesizes multiple moving average algorithms, including Jurik and T3, to visualize trend direction through directional shift detection.

xpMA_v3_modified
Indicator

xpMA_v3_modified

iMAiMAOnArray

This indicator synthesizes diverse moving average models including DEMA, TEMA, and T3 to identify trend shifts by comparing current values against a localized step-period mean.

xpMA_v4
Indicator

xpMA_v4

iMAiMAOnArray

This indicator identifies directional trend shifts by comparing multi-variant moving average values against a localized step-period mean to trigger momentum-based signals.

xpMA_v5
Indicator

xpMA_v5

iMAiMAOnArray

This indicator evaluates price action against various specialized moving average algorithms to generate visual reversal signals and trend shifts based on localized momentum deviations.

xpMA_With_Email_Alert
Indicator

xpMA_With_Email_Alert

iMAiMAOnArray

This indicator evaluates price action against various advanced moving average types and utilizes a local mean comparison to trigger directional trend shifts via visual markers and alerts.

Yaanna
Indicator

Yaanna

iBandsiMA

This indicator quantifies the relative percentage proximity of the current closing price within the spatial bounds defined by a dual Bollinger Band structure.

YaannaSignal
Indicator

YaannaSignal

iBandsiMA

This indicator identifies potential reversal points by calculating the percentage of price position relative to the Bollinger Bands range and monitoring for significant overextended movements.

YangTraderMain
Indicator

YangTraderMain

iMAiMAOnArray

This indicator calculates a smoothed derivative of moving averages to identify price momentum shifts and generate directional signals based on specific threshold breaches.

YANSTEST 6wait
Indicator

YANSTEST 6wait

iMAiSAR

This indicator identifies high-probability trend reversals by synchronizing EMA crossover events with Parabolic SAR positional shifts and momentum filters.

YANSTEST 6wait_v1
Indicator

YANSTEST 6wait_v1

iMAiSAR

This indicator identifies high-probability momentum shifts by validating EMA crossovers and Parabolic SAR flips against specific trend duration thresholds.

YANS_IND2_01
Indicator

YANS_IND2_01

iMAiSAR

This indicator identifies trend reversal signals by detecting precise crossovers between the Parabolic SAR and 40-period EMA, validated by a trailing 10-period EMA momentum shift.

YANS_IND2_01_v1
Indicator

YANS_IND2_01_v1

iMAiSAR

This indicator identifies trend shifts by detecting Parabolic SAR crossovers relative to the EMA40, filtered by the proximity of the previous EMA10 intersection.

YANS_IND_04
Indicator

YANS_IND_04

iMAiSAR

This indicator identifies momentum shifts by synchronizing moving average crossovers with Parabolic SAR trend flips and proximity thresholds.

YANS_IND_04_v1
Indicator

YANS_IND_04_v1

iMAiSAR

This indicator identifies trend reversals and momentum shifts by synchronizing 10/40 Exponential Moving Average crossovers with Parabolic SAR flip dynamics and threshold proximity.

Yoni Yum
Indicator

Yoni Yum

iMAiMAOnArray

This indicator synthesizes a MACD trend filter with Ehlers' Fisher Transformation and stochastic modulation to eliminate signal noise and identify momentum shifts.

yRDS2689SignalAlerts
Indicator

yRDS2689SignalAlerts

iCCIiWPRiMA

This indicator identifies dynamic support and resistance zones by synthesizing WPR, CCI, and EMA trends across multiple timeframes to generate real-time level breach alerts.

ytg_DveMashki_ind
Indicator

ytg_DveMashki_ind

iMA

This indicator visualizes the distance between two distinct moving averages using high-thickness histograms to identify trend strength and price momentum.

ytg_DveMashki_ind_w_Signals
Indicator

ytg_DveMashki_ind_w_Signals

iMAiMAOnArray

This indicator calculates the divergence between two moving averages to derive a momentum map, subsequently applying secondary smoothing filters to identify trend strength and crossovers.

ytg_MA_Open_V0
Indicator

ytg_MA_Open_V0

iMA

This indicator detects potential reversal or trend entries by identifying specific price action patterns where the candle open breaks a dynamic threshold of the Moving Average while the low and high remain constrained within a defined proximity zone.

ZCOMForex_daily_trend
Indicator

ZCOMForex_daily_trend

iMAiStochastic

This indicator visualizes concurrent bullish or bearish bias across four specific currency pairs by identifying alignment between Smoothed Moving Average crossovers and Stochastic oscillator thresholds.

ZCOMFX daily trend v2
Indicator

ZCOMFX daily trend v2

iMAiStochastic

This indicator synthesizes smoothed moving averages and stochastic momentum across six concurrent currency pairs to visualize global trend alignment.
Zee Zee i
Indicator

Zee Zee i

iMA

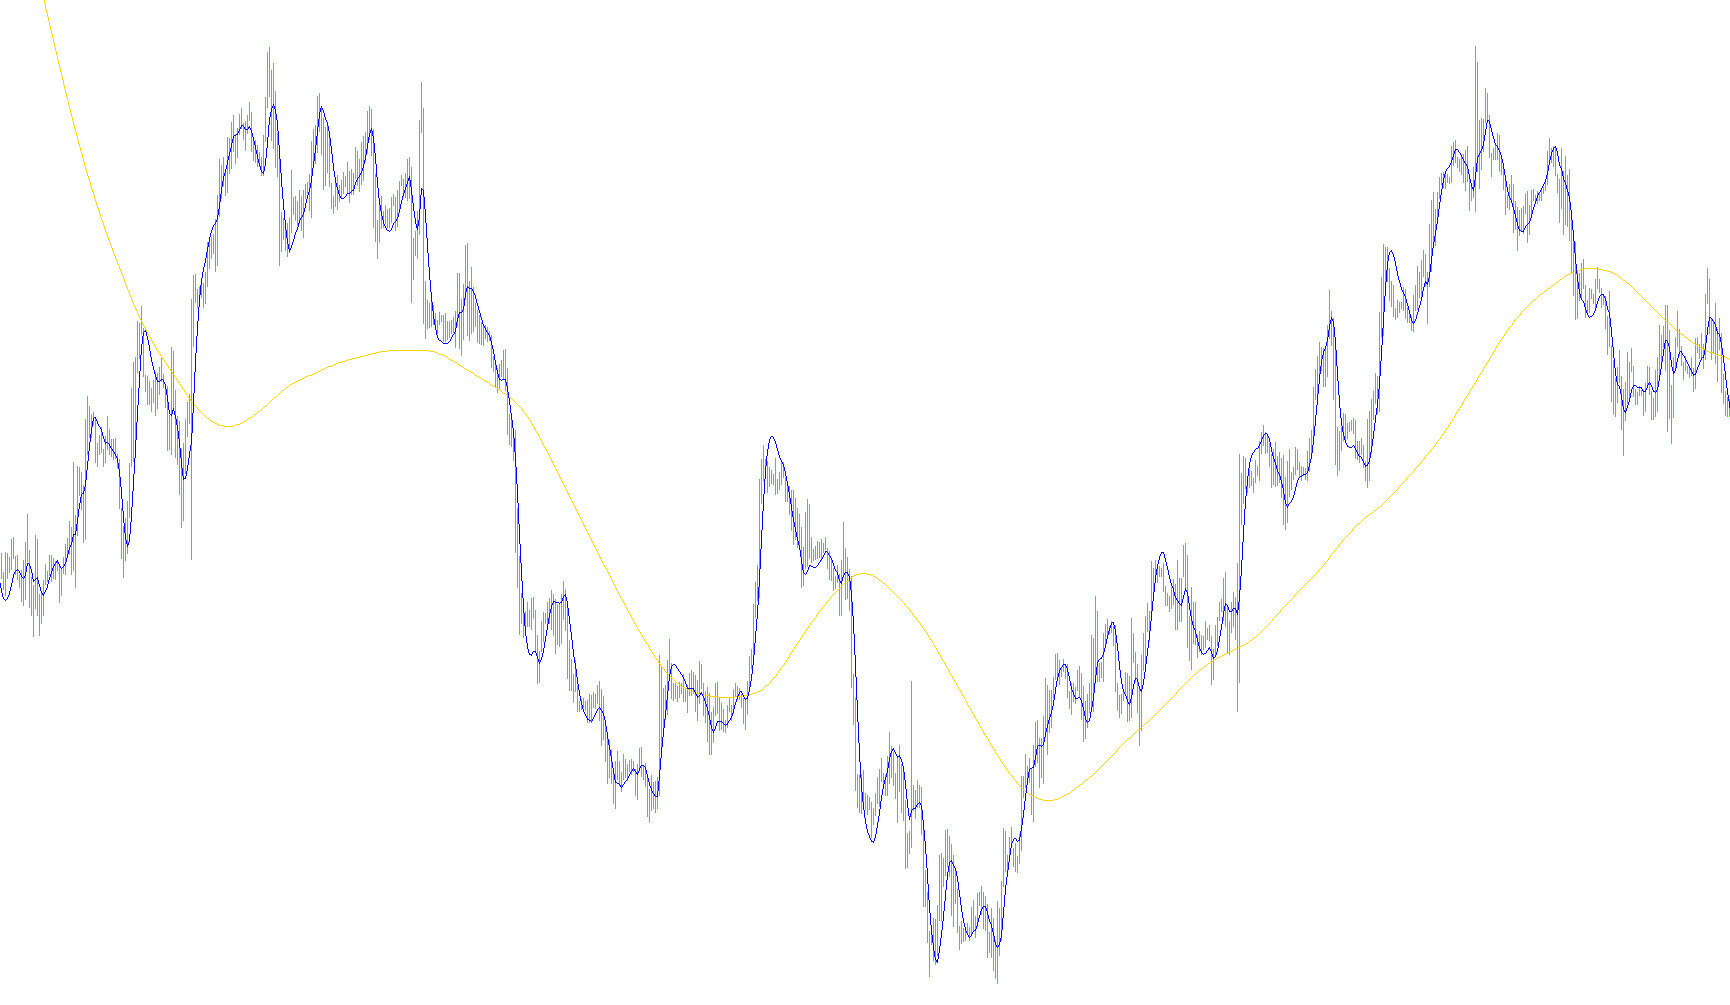
This indicator calculates price variance relative to a simple moving average by dividing the current typical price deviation by its historical standard deviation, highlighting extreme momentum extremes.

ZeroLAG MA
Indicator

ZeroLAG MA

iMAiMAOnArray

This indicator calculates a responsive moving average by offsetting the primary average against its own smoothed trajectory to minimize phase shift.
ZeroLag MACD Colored
Indicator

ZeroLag MACD Colored

iMAiMAOnArray

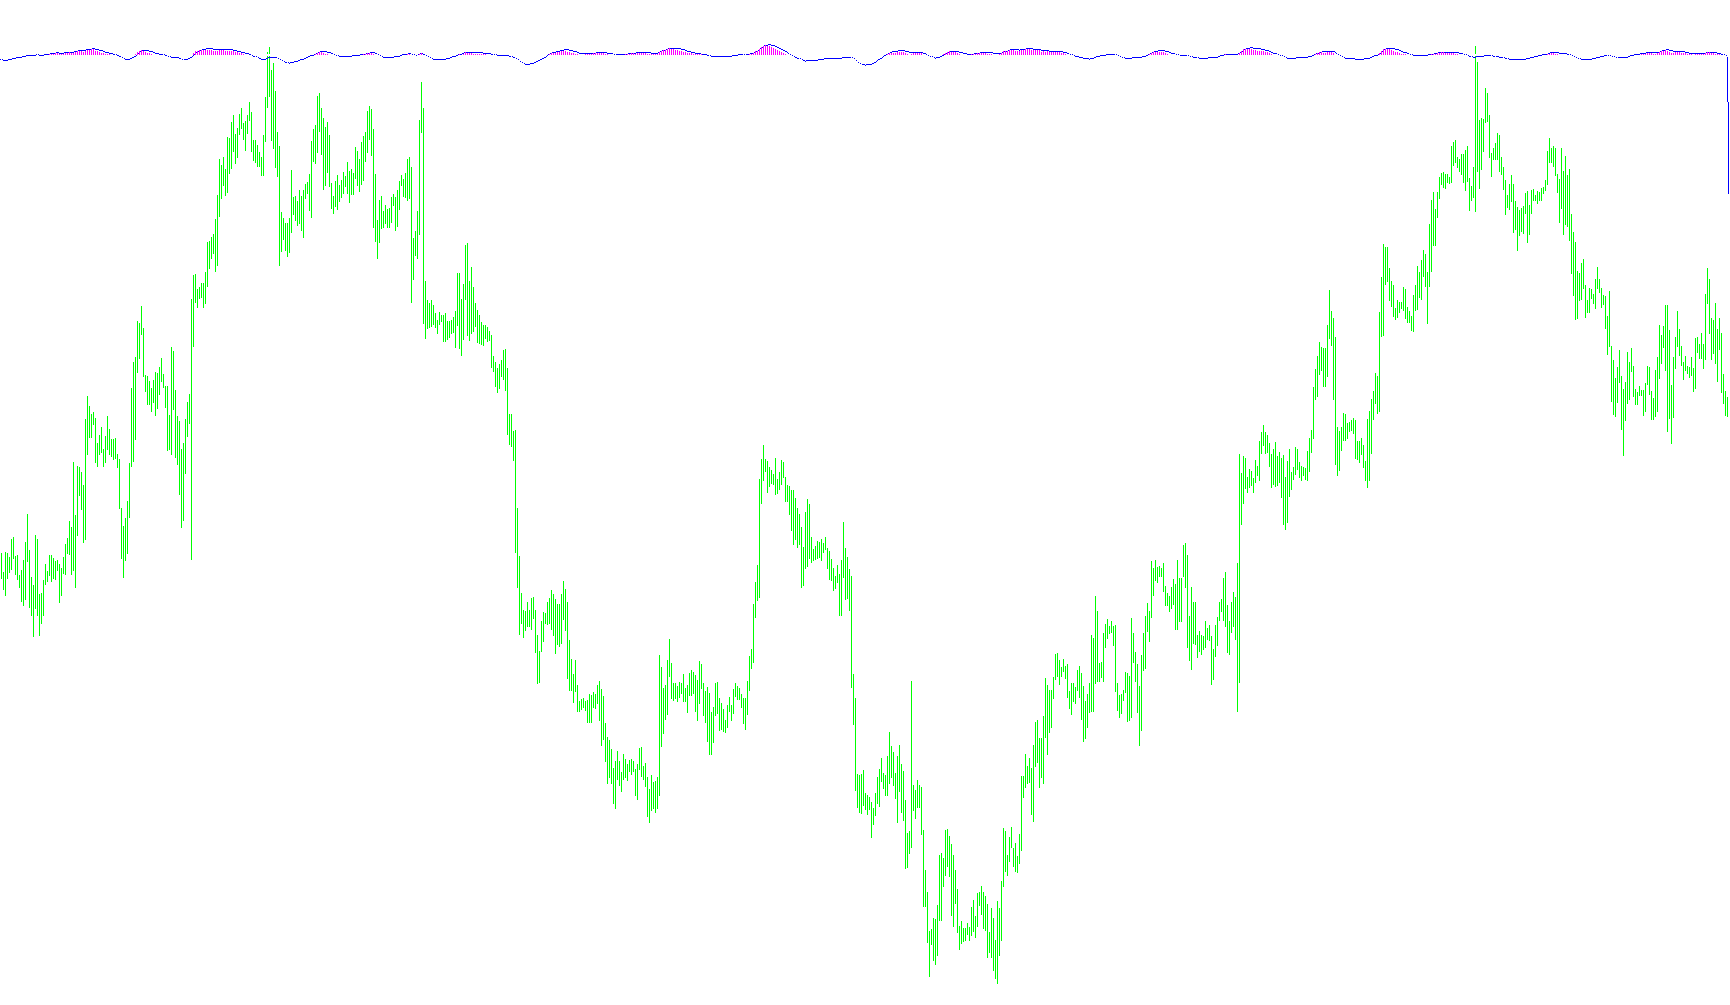
This indicator calculates a high-responsiveness MACD by applying a zero-lag compensation formula to exponential moving averages and visualizes trend reversals through color-coded histogram shifts.
ZeroLag MACD
Indicator

ZeroLag MACD

iMAiMAOnArray

This indicator calculates a momentum difference by applying an additive smoothing correction to both fast and slow exponential moving averages to eliminate standard lagging effects.

ZeroLag MACD_002
Indicator

ZeroLag MACD_002

iMAiMAOnArray

This indicator identifies trend shifts by calculating the difference between dual zero-lag exponential moving averages, which eliminate standard smoothing delays through recursive price feedback.

ZeroLag MACD_005
Indicator

ZeroLag MACD_005

iMAiMAOnArray

This indicator calculates price momentum by applying a recursive zero-lag formula to both the primary MACD histogram and its underlying signal line to eliminate smoothing delays.

ZeroLag MACD_v1
Indicator

ZeroLag MACD_v1

iMAiMAOnArray

This indicator eliminates signal latency by calculating the variance between double-weighted exponential averages to isolate immediate price velocity.

ZeroLag Tema 2
Indicator

ZeroLag Tema 2

iMA

This indicator synthesizes high-frequency trend identification by applying a zero-lag triple exponential moving average to both typical and Heiken-ashi price derivatives.

ZeroLAG_MA
Indicator

ZeroLAG_MA

iMAiMAOnArray

This indicator calculates a zero-lag moving average by applying a complementary difference between two nested moving averages to minimize phase shift.

ZeroLag_MACD_Colored
Indicator

ZeroLag_MACD_Colored

iMAiMAOnArray

This indicator calculates a dual-layered momentum difference using non-lagging exponential averages and visualizes directional shifts through contrasting histogram color transitions.

ZeroLag_MACD_OsMA
Indicator

ZeroLag_MACD_OsMA

iMAiMAOnArray

This indicator synthesizes a zero-lagged Moving Average Convergence Divergence with an overlaid OnBalanceMomentum (OSMA) component to identify rapid trend shifts and momentum extremes.

Indicator

ZFXiSwap2

iMA
ZMFX_Forex_Trend_v3
Indicator

ZMFX_Forex_Trend_v3

iCCIiMAiRSIiStochastic

This indicator synchronizes real-time trend analysis across multiple currency pairs by evaluating concurrent EMA crossovers, Stochastic oscillations, CCI levels, RSI momentum, and MACD signal shifts.

zscore
Indicator

zscore

iMAiStdDev

This indicator quantifies price eccentricity by calculating the number of standard deviations the current closing price sits away from its 60-period moving average.

zscore2x_mtf
Indicator

zscore2x_mtf

iMAiStdDev

This indicator calculates the relative distance of current price from moving averages normalized by standard deviation across multiple timeframes to identify overextended market conditions.

zscore_mtf
Indicator

zscore_mtf

iMAiStdDev

This indicator quantifies price extremes by calculating the distance between the closing price and its moving average, normalized by the standard deviation over a multi-timeframe scale.

ZZ_YZ_MDAC_ELDER 1-1000
Indicator

ZZ_YZ_MDAC_ELDER 1-1000

iMAiMAOnArray

This indicator visualizes MACD momentum by dynamically shifting color coding to highlight directional alignment and velocity shifts between the main line and its signal average.

Indicator

[ea]BollTrade_Ron_MT4_v04 OrderReliable News

iMAiStdDev
[i] nonlagzigzag_v2
Indicator

[i] nonlagzigzag_v2

iMA

This indicator identifies structural price extremes by applying a non-lagging moving average smoothed with a dynamic standard deviation filter to determine trend shifts and pivot points.

[i]2MA
Indicator

[i]2MA

iMA

The indicator identifies trend reversal signals by detecting bullish and bearish crossovers between a 15-period and a 100-period Exponential Moving Average calculated on the 4-hour timeframe.

[i]2MAsame
Indicator

[i]2MAsame

iMA

This indicator maps synchronized 2-period Simple Moving Averages across five distinct timeframes simultaneously to identify overarching trend convergence.

[i]2MAsame_v1
Indicator

[i]2MAsame_v1

iMA

This indicator projects concurrent 2-period Simple Moving Averages across M30, H1, H4, D1, and W1 timeframes onto the current chart to visualize multi-temporal price trends.