VoltyChannel_Stop_v2.1
Indicator

VoltyChannel_Stop_v2.1

iATRiMA

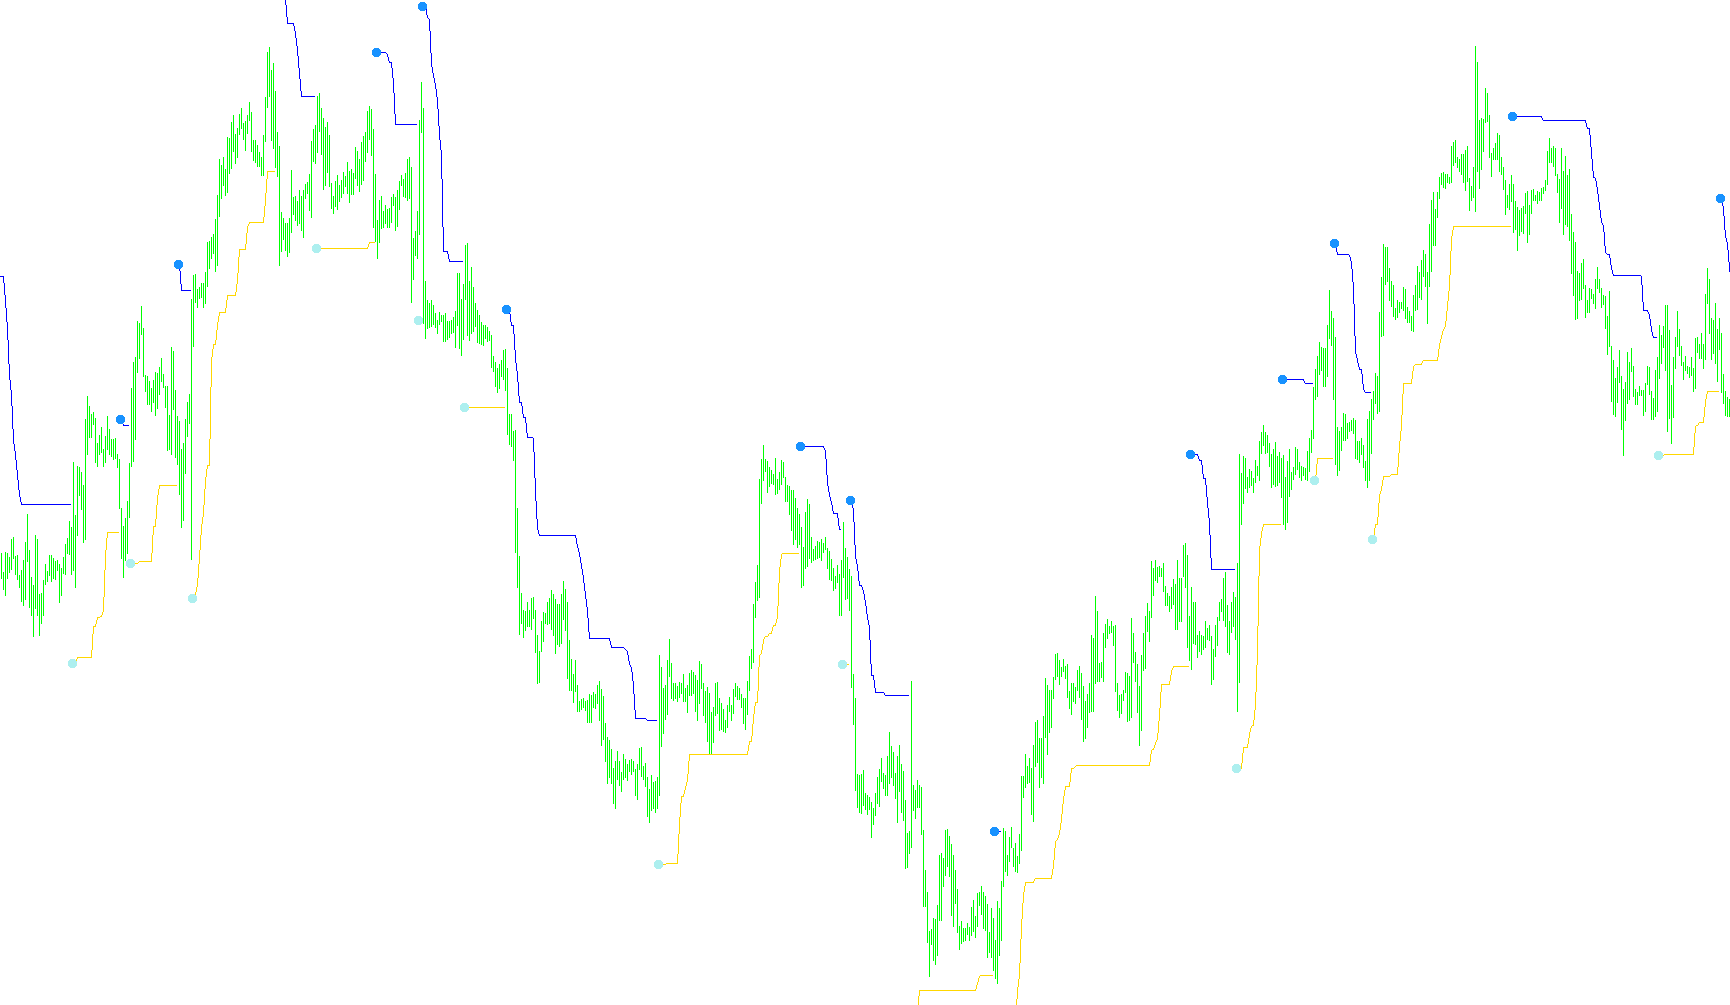
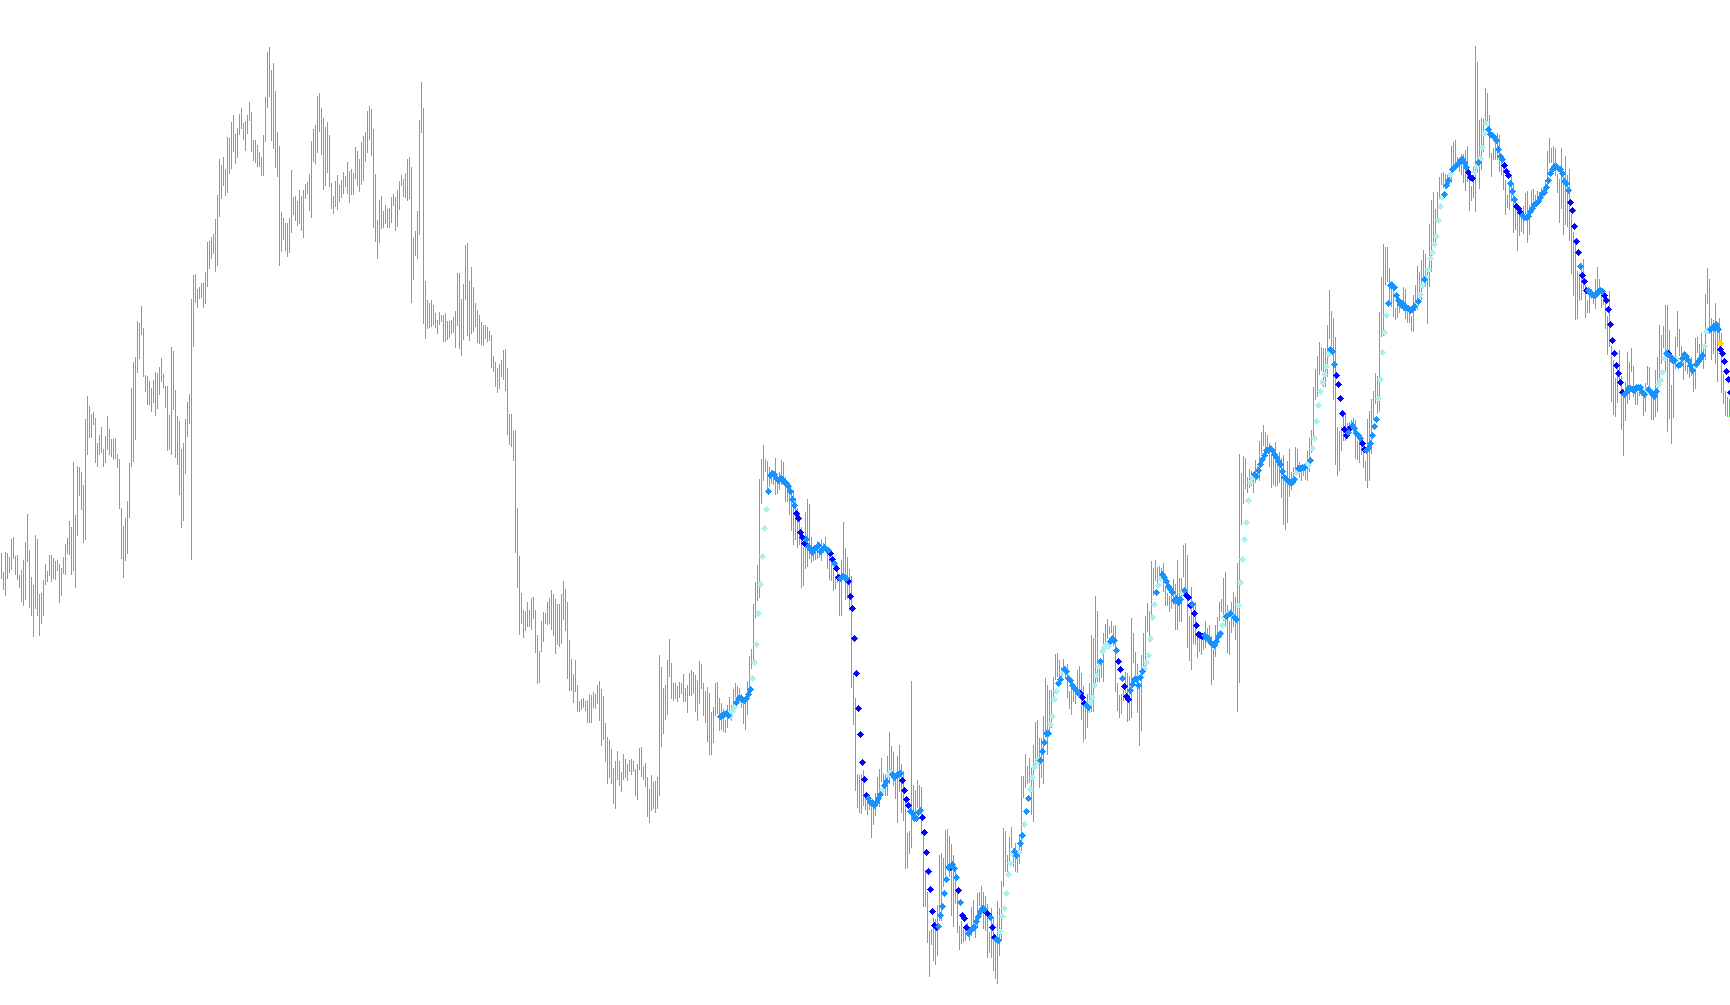
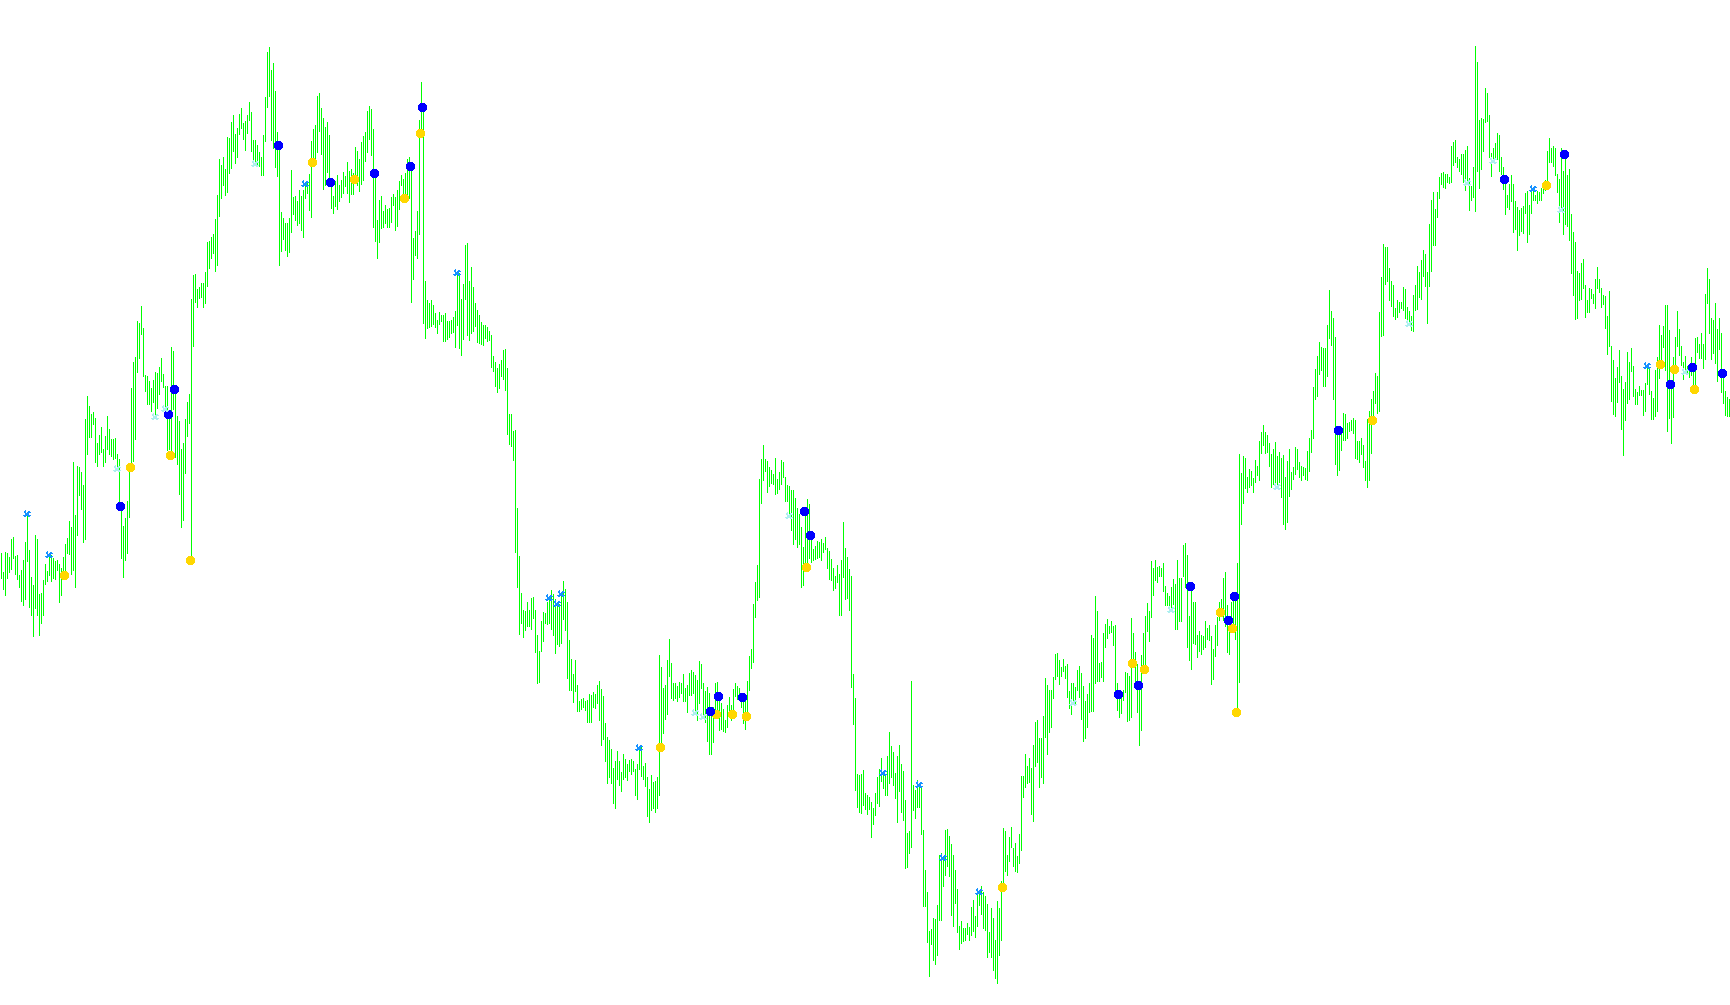
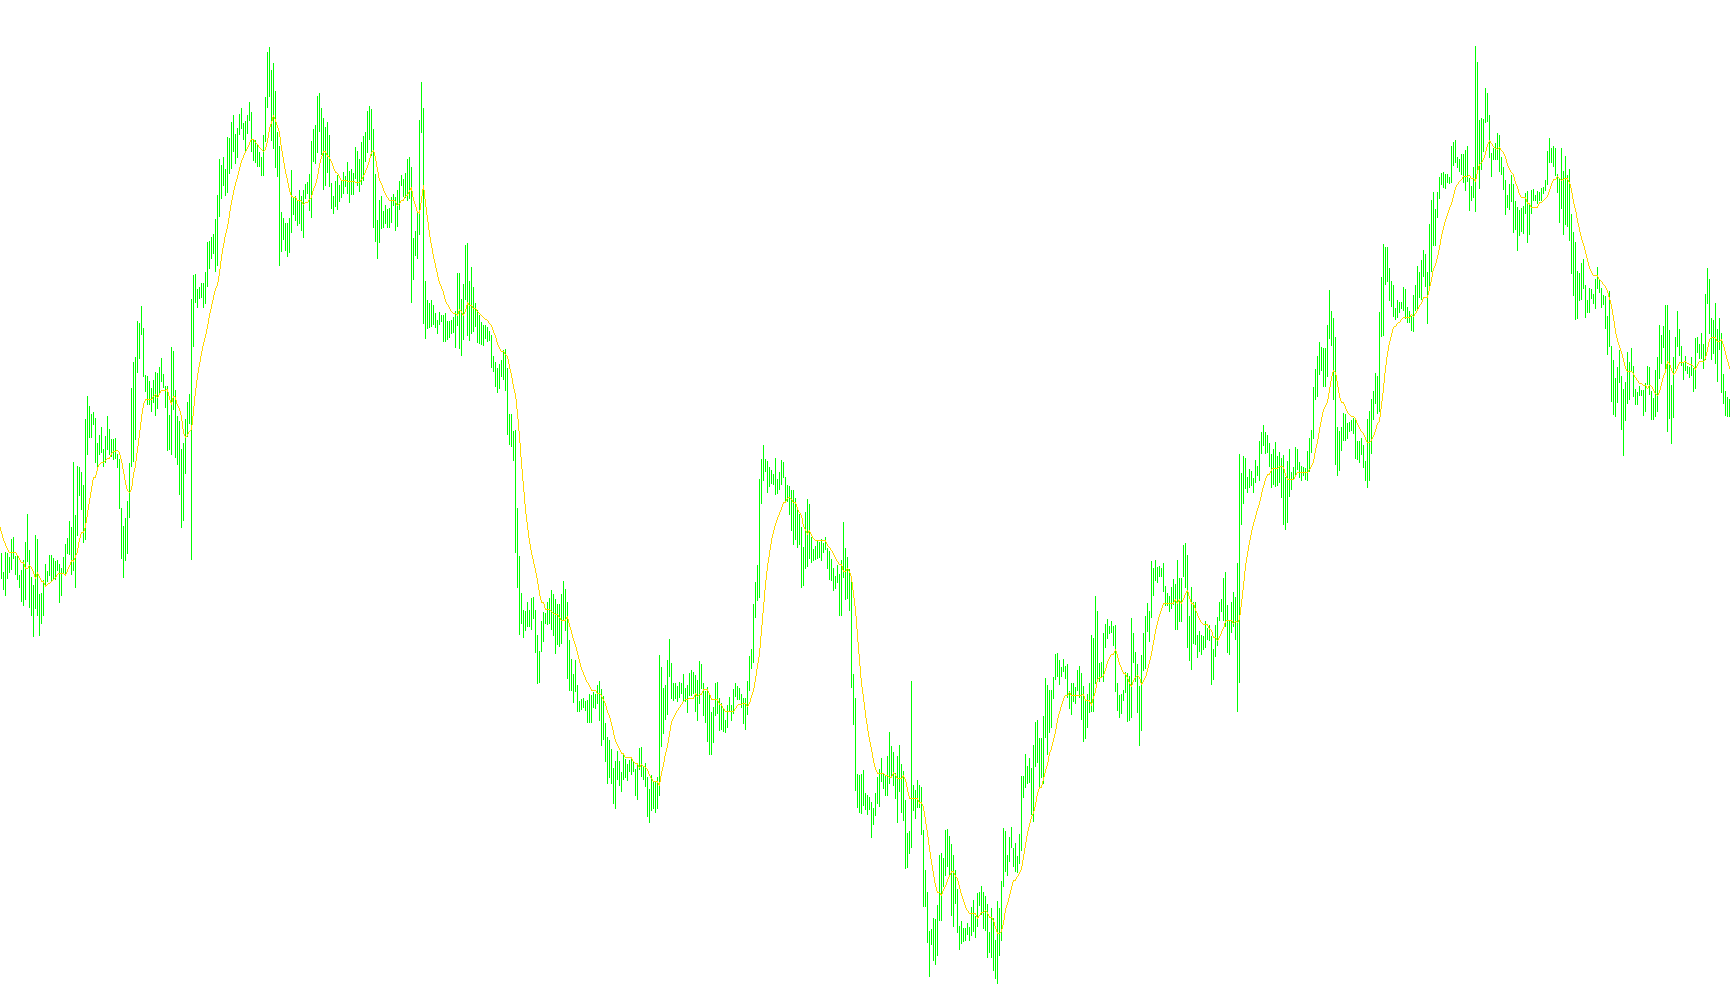
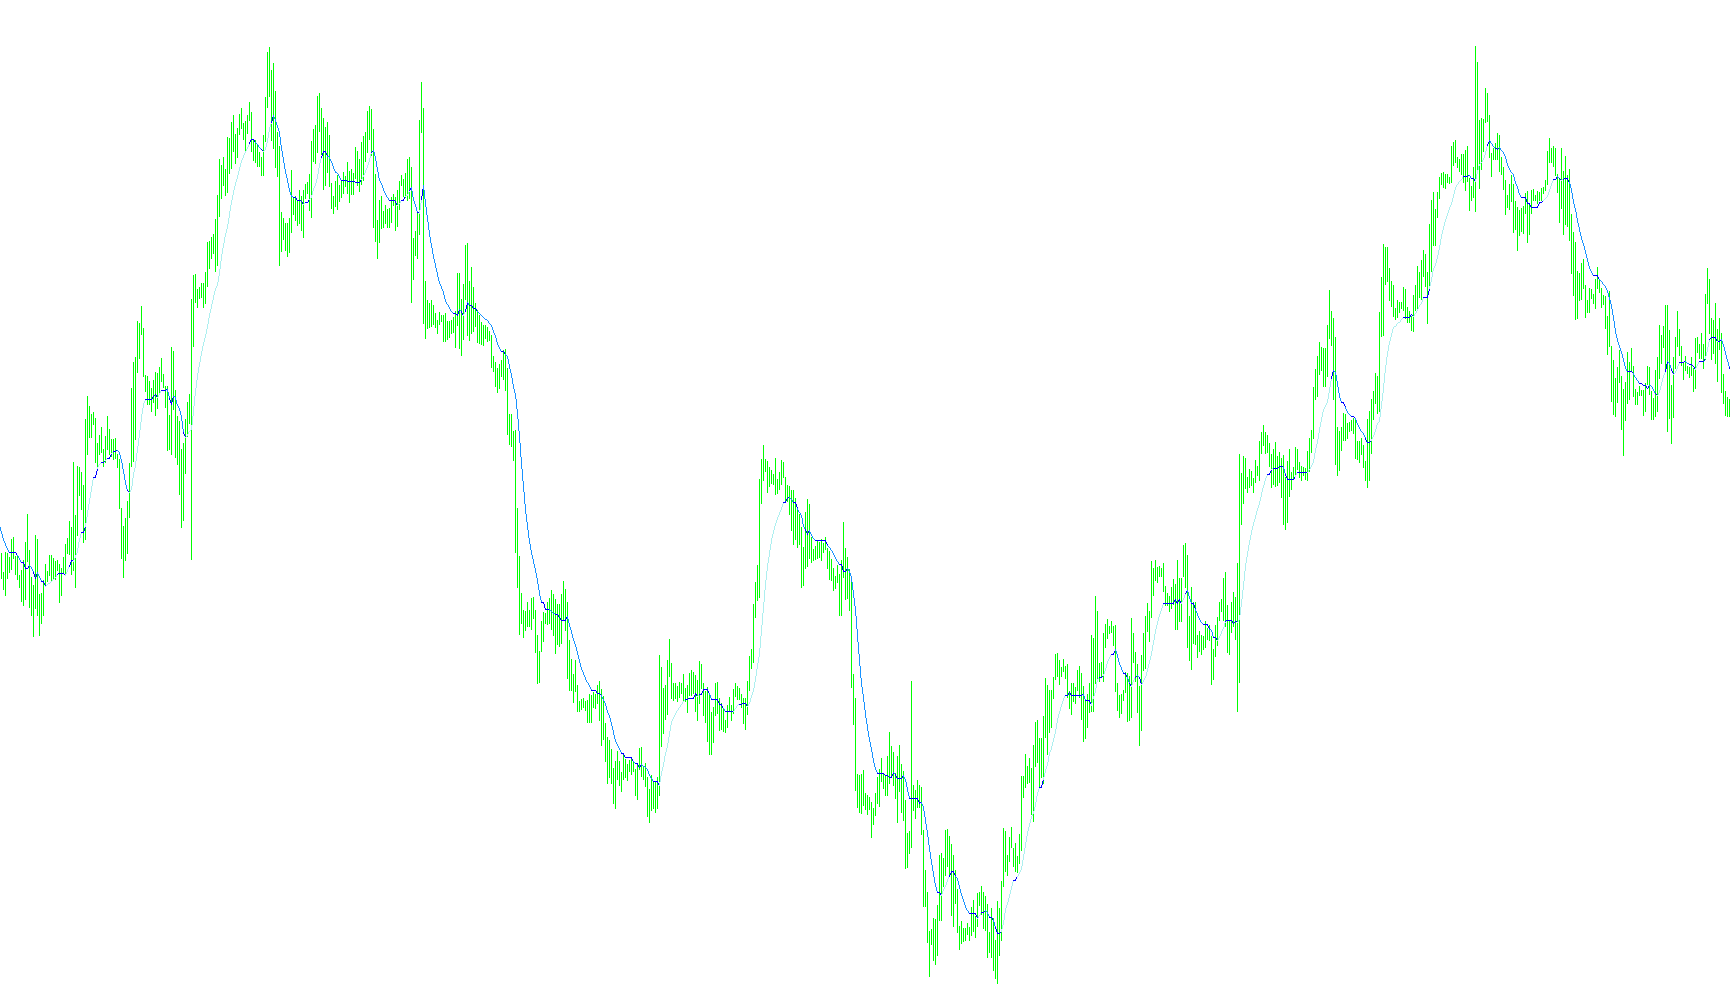
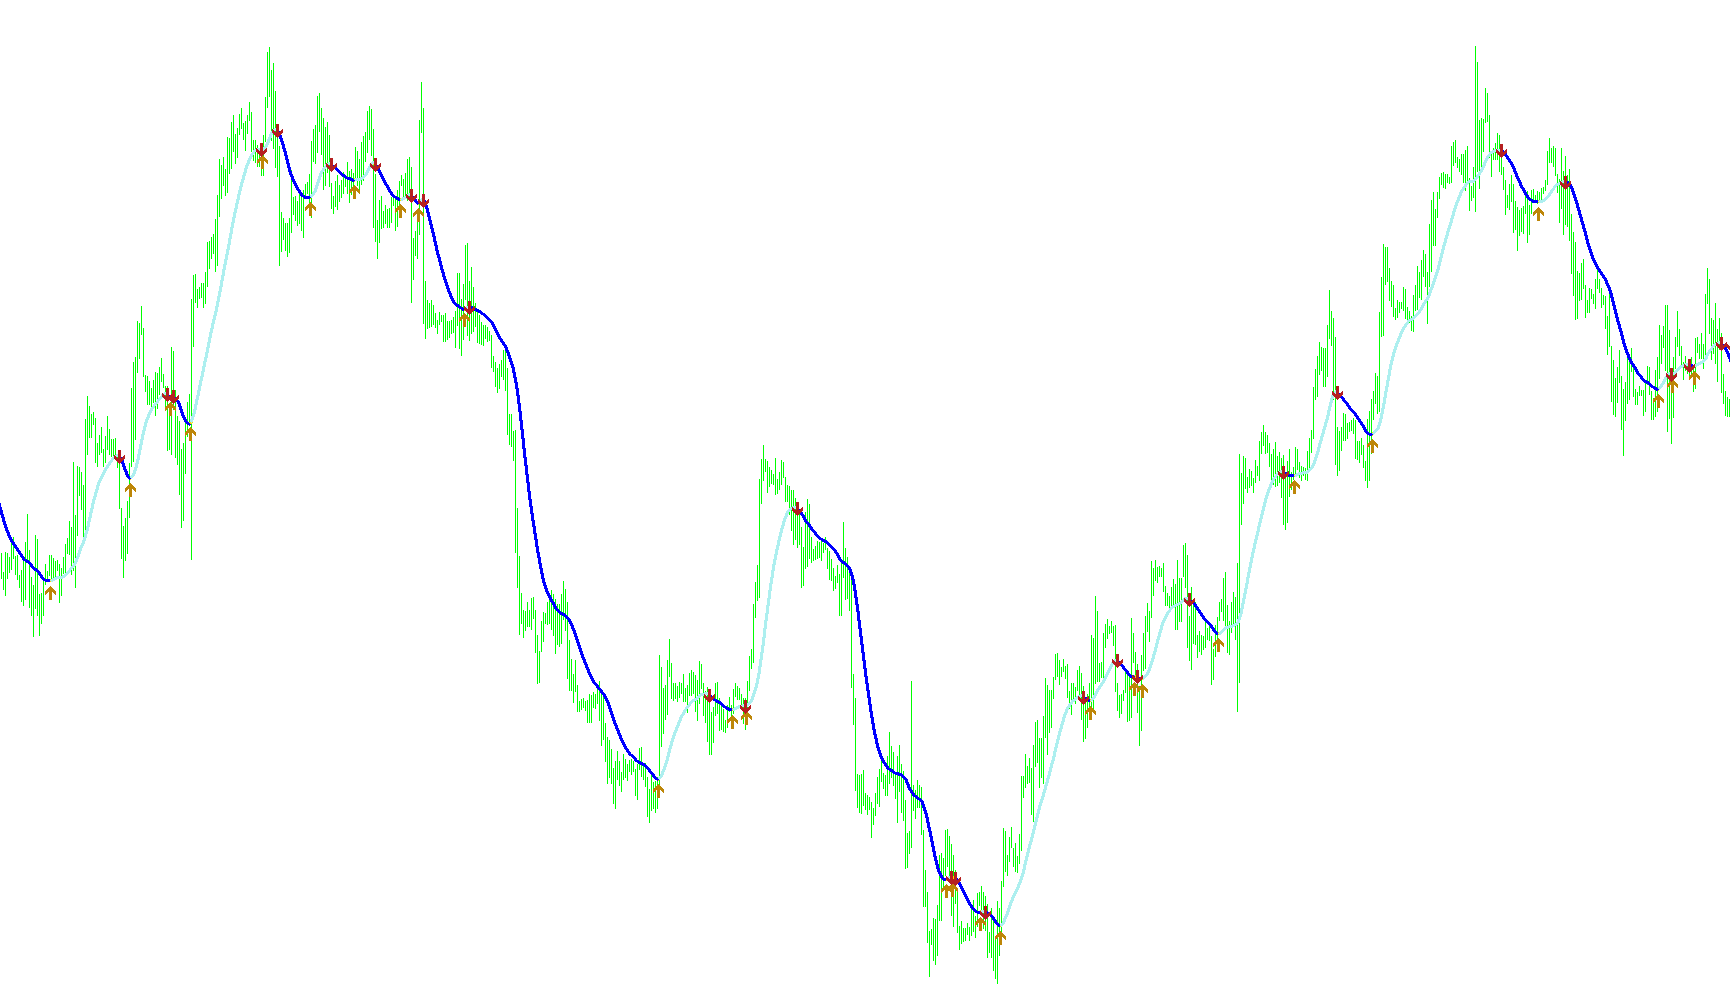
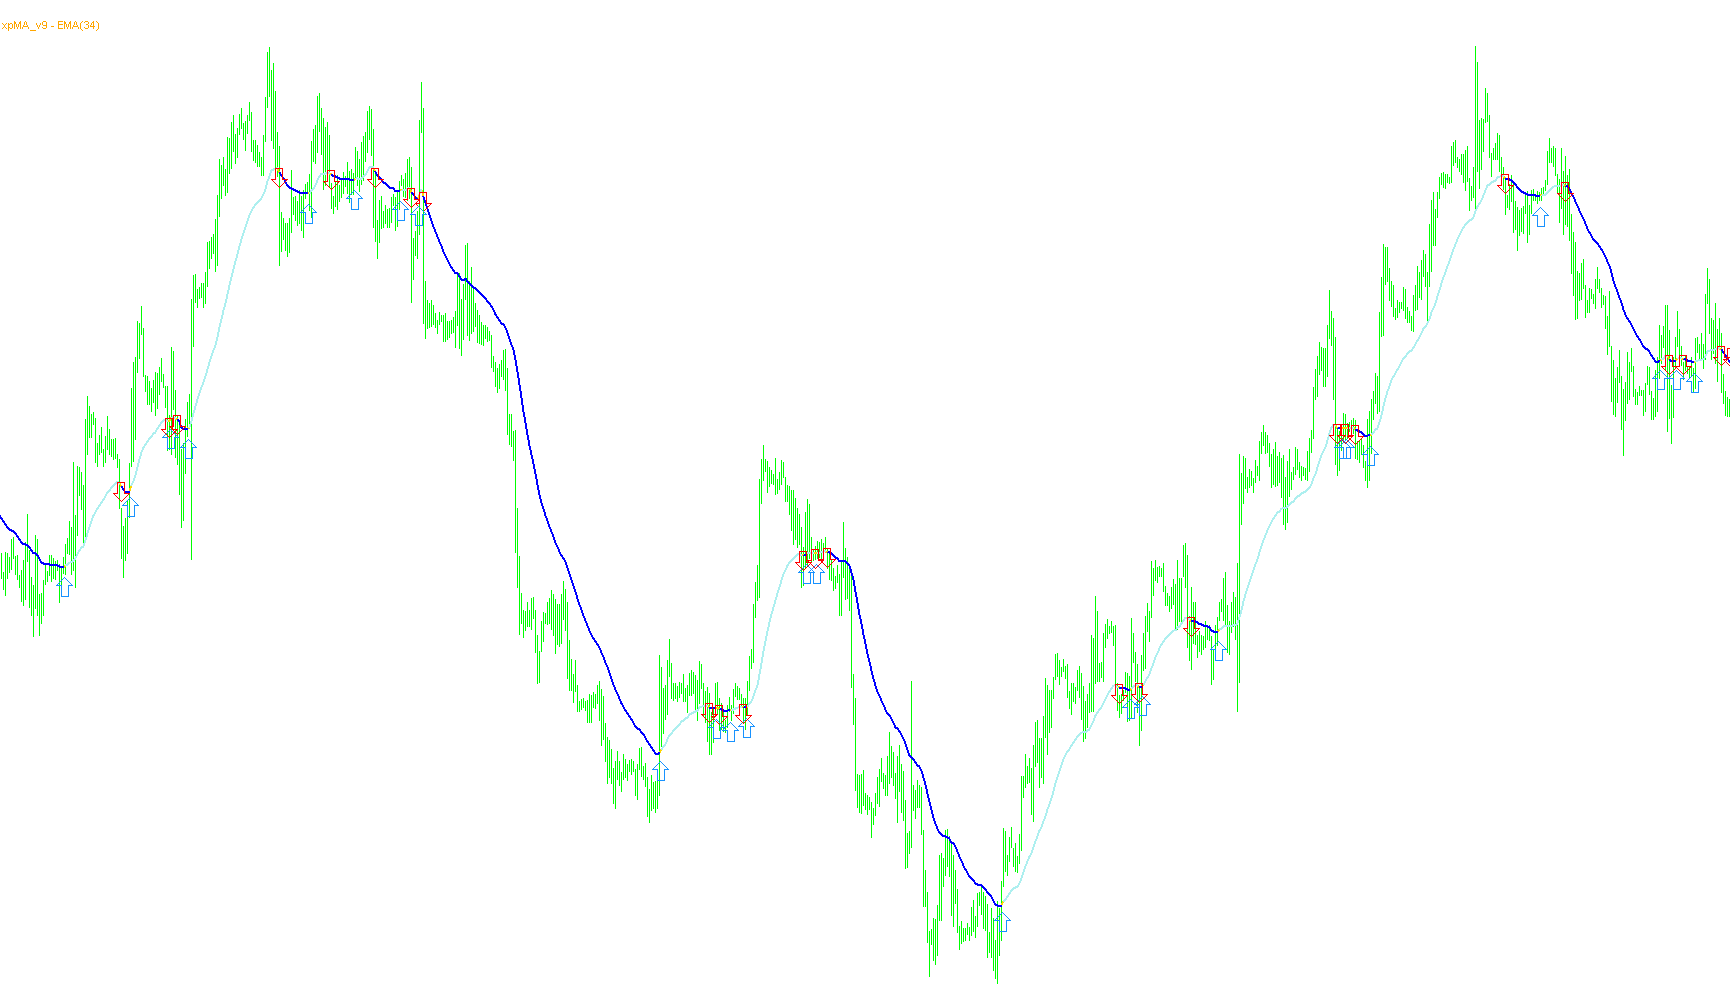
Identifies trend reversals and dynamic trailing stop levels by calculating price envelopes based on weighted moving averages and ATR-derived volatility multipliers.
VoltyChannel_Stop_v2.1M
Indicator

VoltyChannel_Stop_v2.1M

iATRiMA

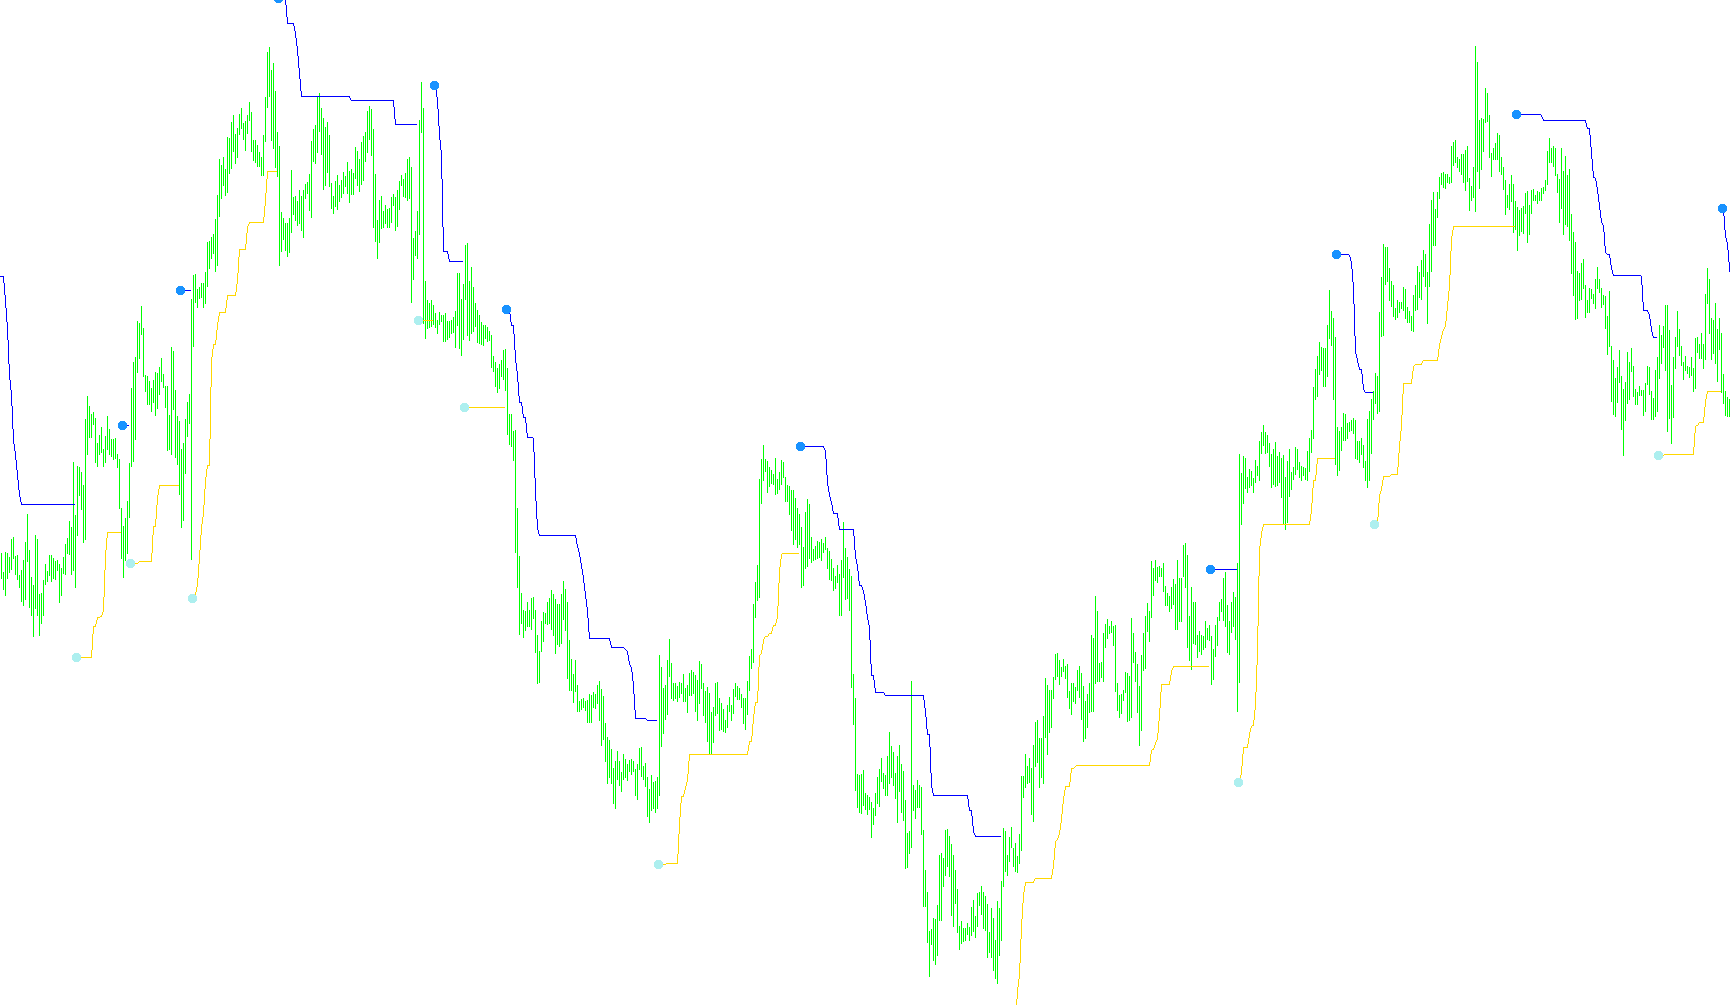
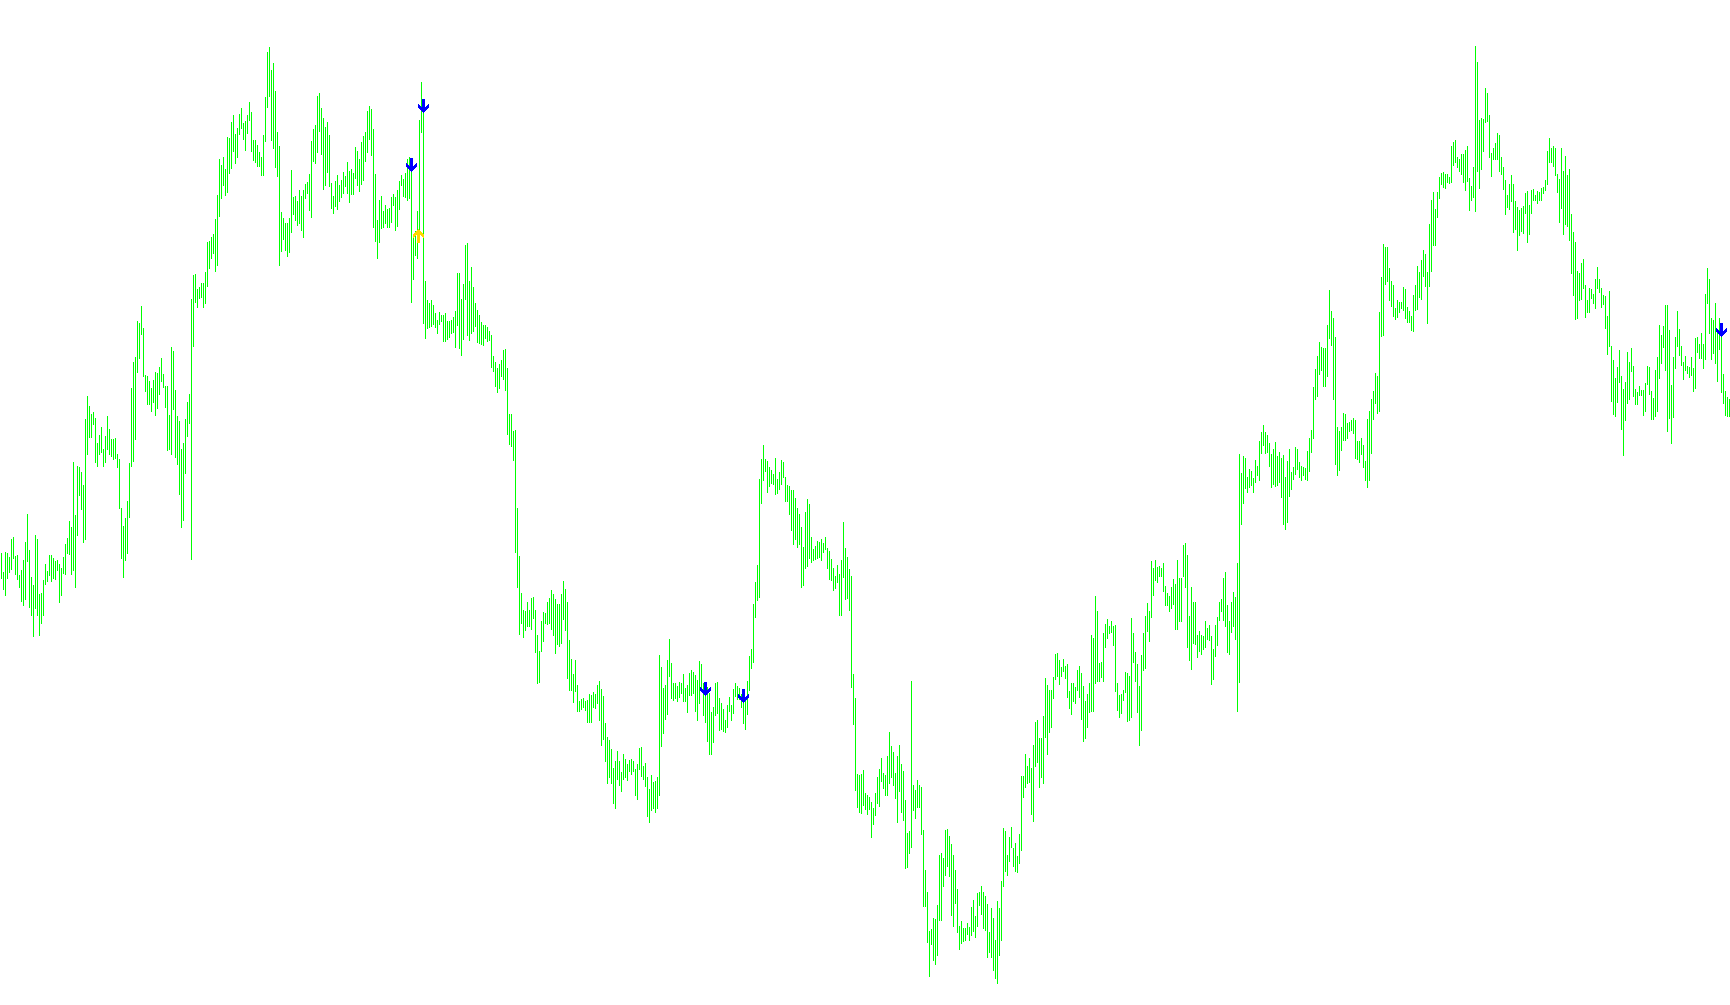
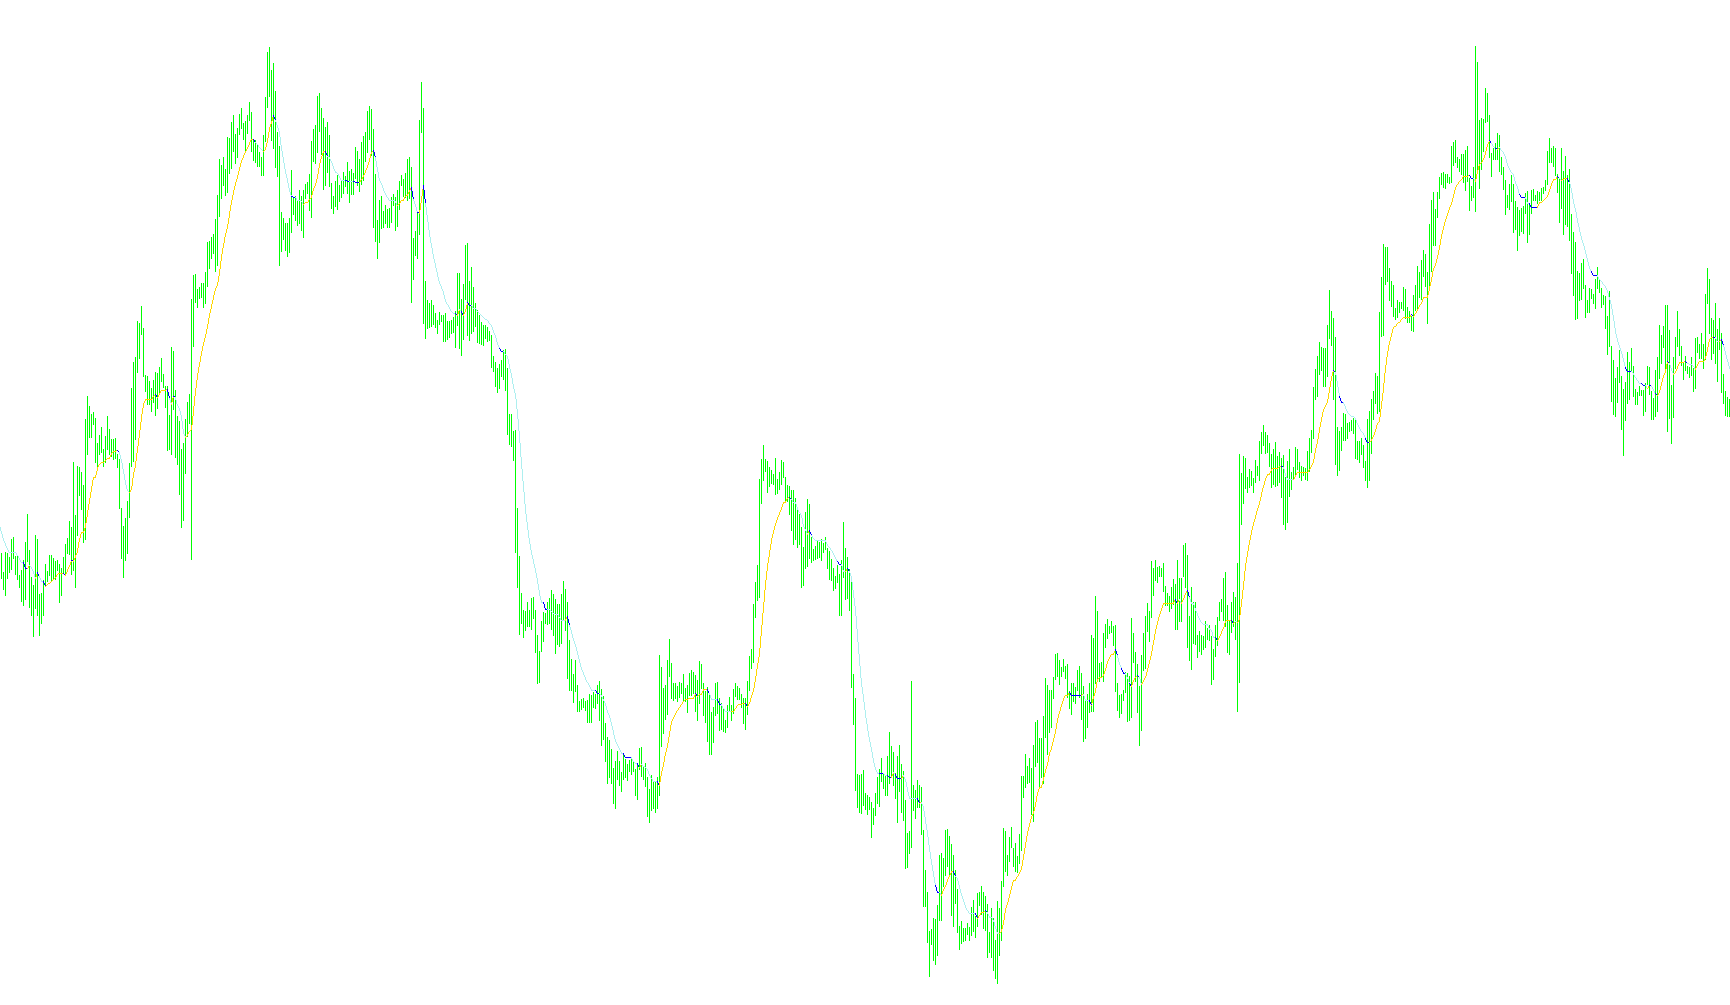
This indicator identifies trend shifts by monitoring price breaches of ATR-based volatility envelopes and generates dynamic trailing stop levels that adjust to market expansion.

VoltyChannel_Stop_v2.1M_v1
Indicator

VoltyChannel_Stop_v2.1M_v1

iATRiMA

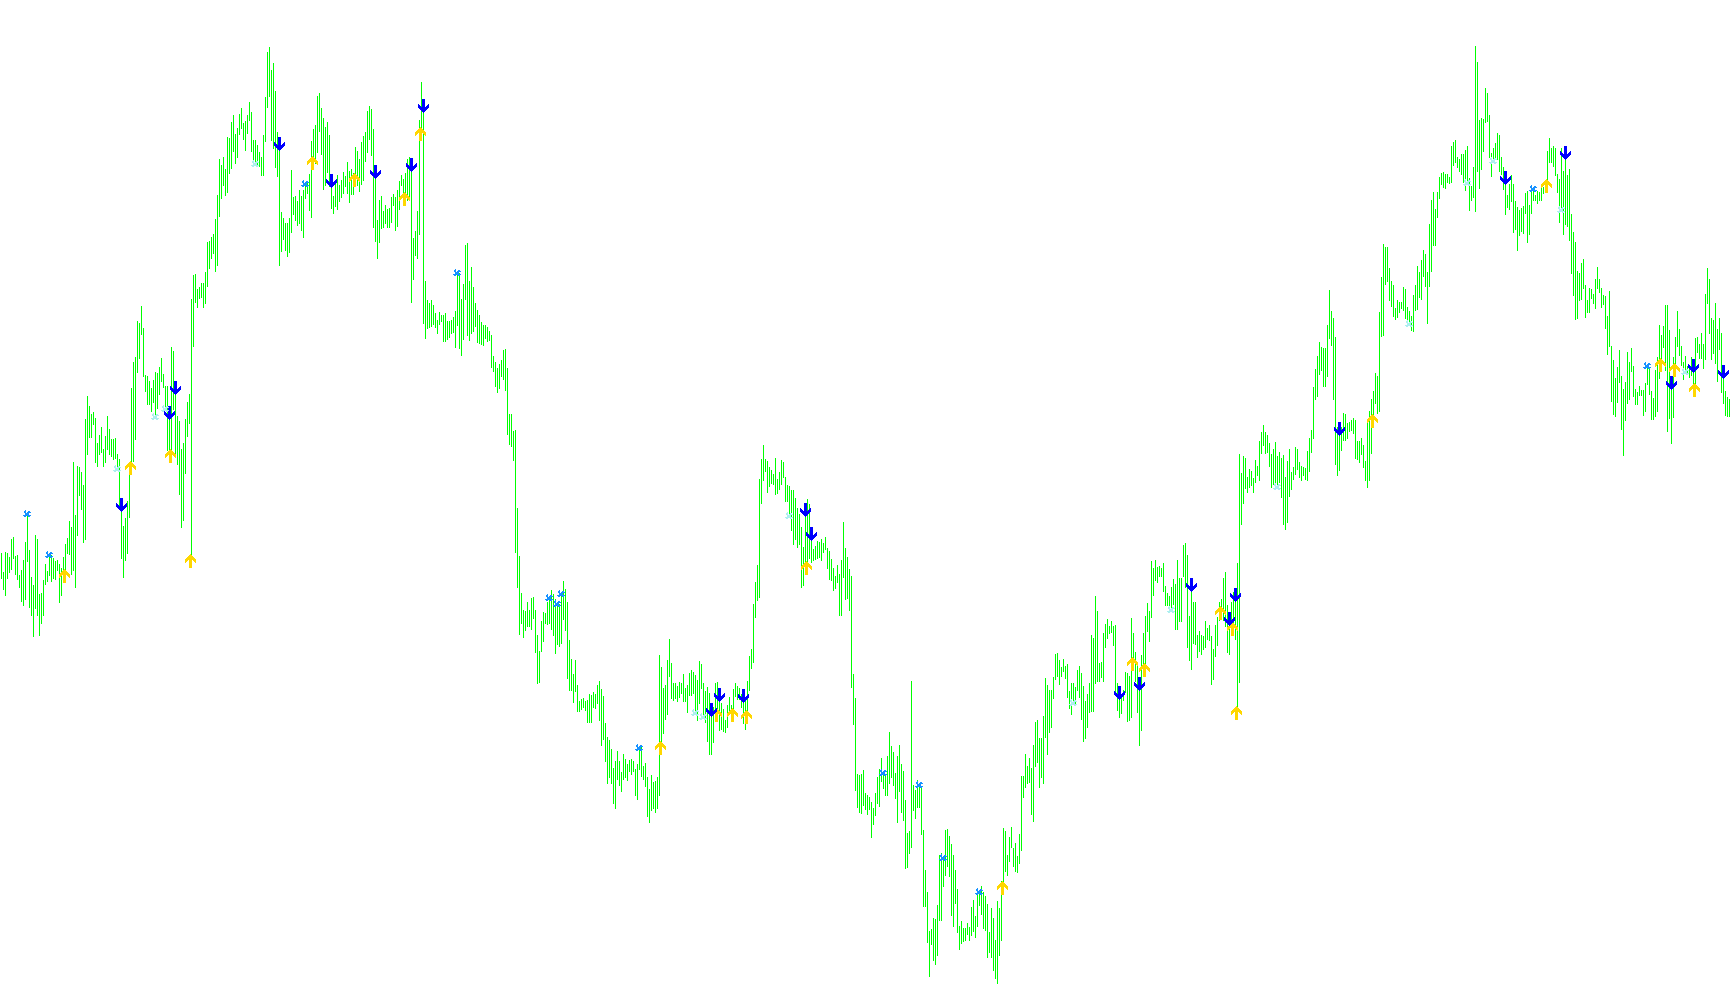
This indicator identifies trend reversals by monitoring price breaches of an ATR-based volatility envelope and projects non-repainting trailing stop levels based on momentum shifts.

VoltyChannel_Stop_v2.1_001
Indicator

VoltyChannel_Stop_v2.1_001

iATRiMA

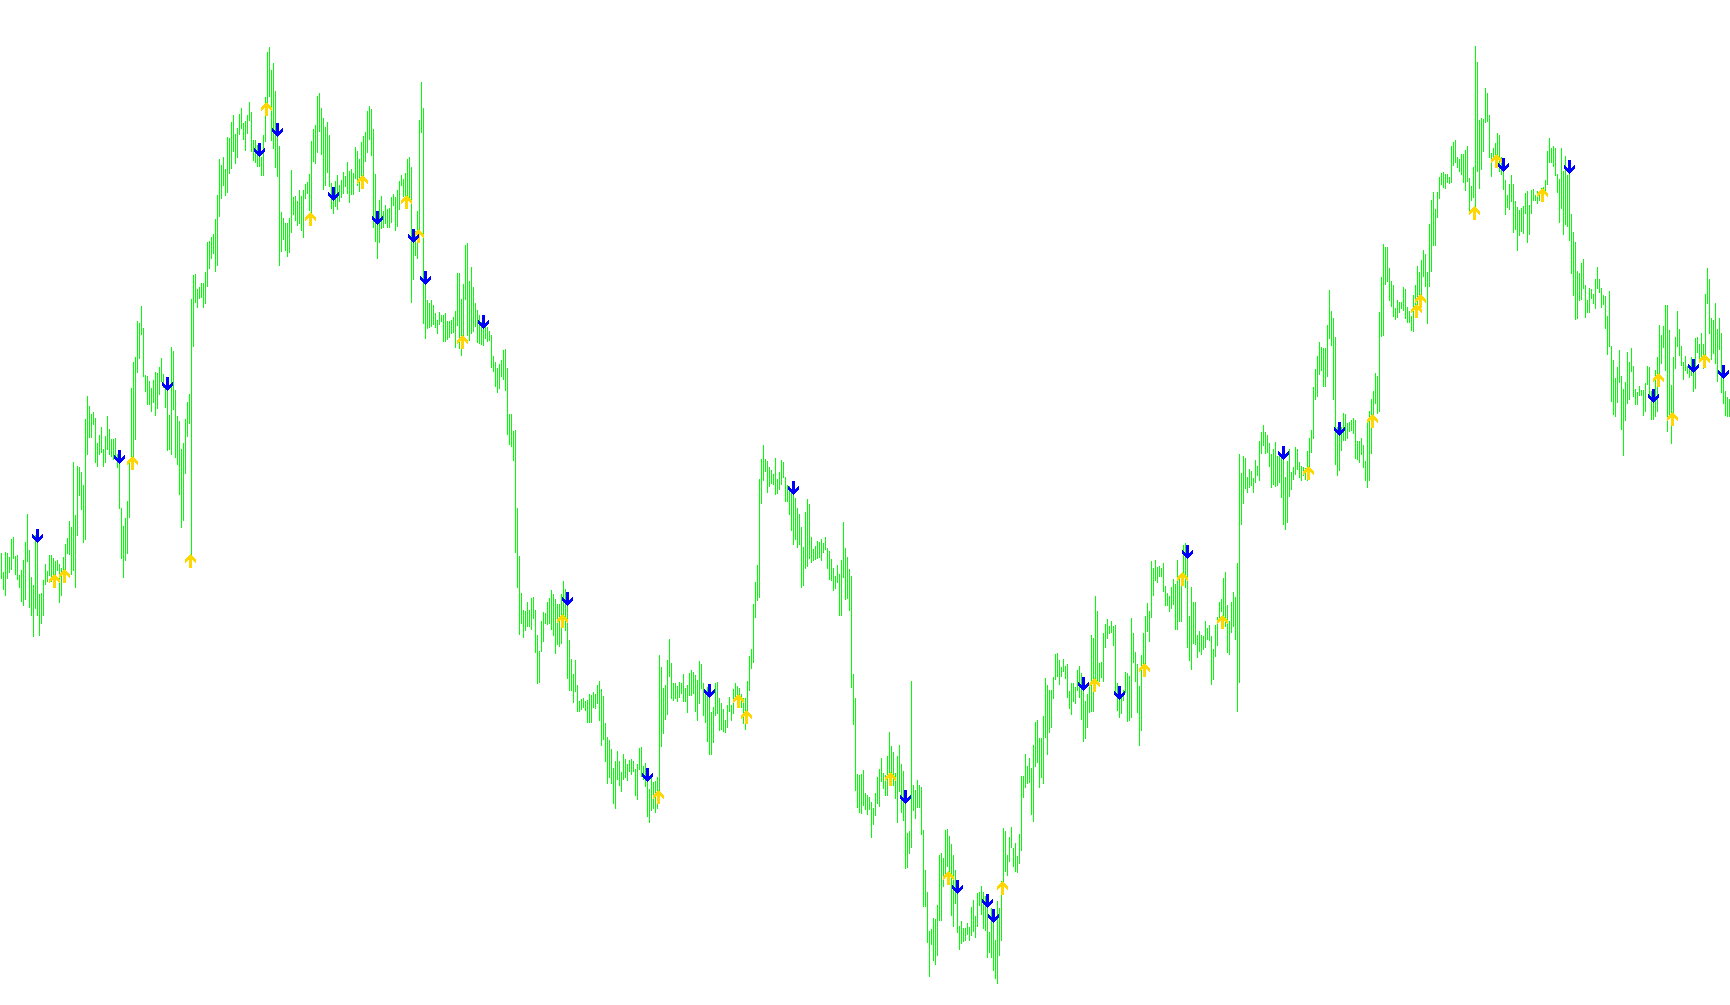
This indicator calculates trend reversals by tracking price breaches of ATR-based volatility bands and generates trailing stop levels that contract based on market fluctuations.

Vostro_+_2010
Indicator

Vostro_+_2010

iMA

This indicator identifies extreme price deviations from a rolling median price by normalizing the distance of highs and lows against localized volatility, filtered through a linear weighted moving average.

VQ bars
Indicator

VQ bars

iMA

This indicator quantifies price velocity relative to high-low variance and filters cumulative momentum fluctuations to determine structural trend direction.

Indicator

VQ

iMA
Indicator

VQ1

iMA
Indicator

VQ2

iMA
VQ_bars
Indicator

VQ_bars

iMA

This indicator calculates a weighted volatility quotient based on relative price positioning between high, low, open, and close averages to determine directional momentum trends.

Indicator

VQ_v1

iMA
Indicator

VQ_v2

iMA
VR---MOVING-AVERAGE
Indicator

VR---MOVING-AVERAGE

iMA

This indicator calculates and overlays three distinct moving averages with period scales dynamically adjusted based on the current chart timeframe to maintain structural consistency.

vr_moving_average
Indicator

vr_moving_average

iMA

This indicator identifies directional shifts by bifurcating a standard moving average into two distinct trend lines based on local price trajectory reversals.

VSA_ TrendDiamonds
Indicator

VSA_ TrendDiamonds

iBandsiMAiSAR

This indicator identifies directional shifts by synchronizing Smoothed Moving Average slopes with Parabolic SAR position and expanding Bollinger Band volatility thresholds.

VSA_v2
Indicator

VSA_v2

iATRiMA

This indicator quantifies market sentiment by calculating the net difference between bullish and bearish volume flows, conditioned by moving average crossovers and ATR volatility expansions.

VWB
Indicator

VWB

iMA

This indicator projects dynamic Fibonacci-based expansion zones around a secondary Exponential Moving Average to identify multi-layered price exhaustion levels.

w35260_ws_MA_or_SDL
Indicator

w35260_ws_MA_or_SDL

iMA

This indicator synthesizes directional bias from dual-layered momentum indicators with moving average smoothing or slope-direction line scaling to identify trend transitions.

wajdyss_3MA_Indicator_V1
Indicator

wajdyss_3MA_Indicator_V1

iMA

This indicator identifies trend reversal opportunities by monitoring price momentum through the synchronized interaction of three distinct moving average layers.

wajdyss_MA_indicator_v2
Indicator

wajdyss_MA_indicator_v2

iMA

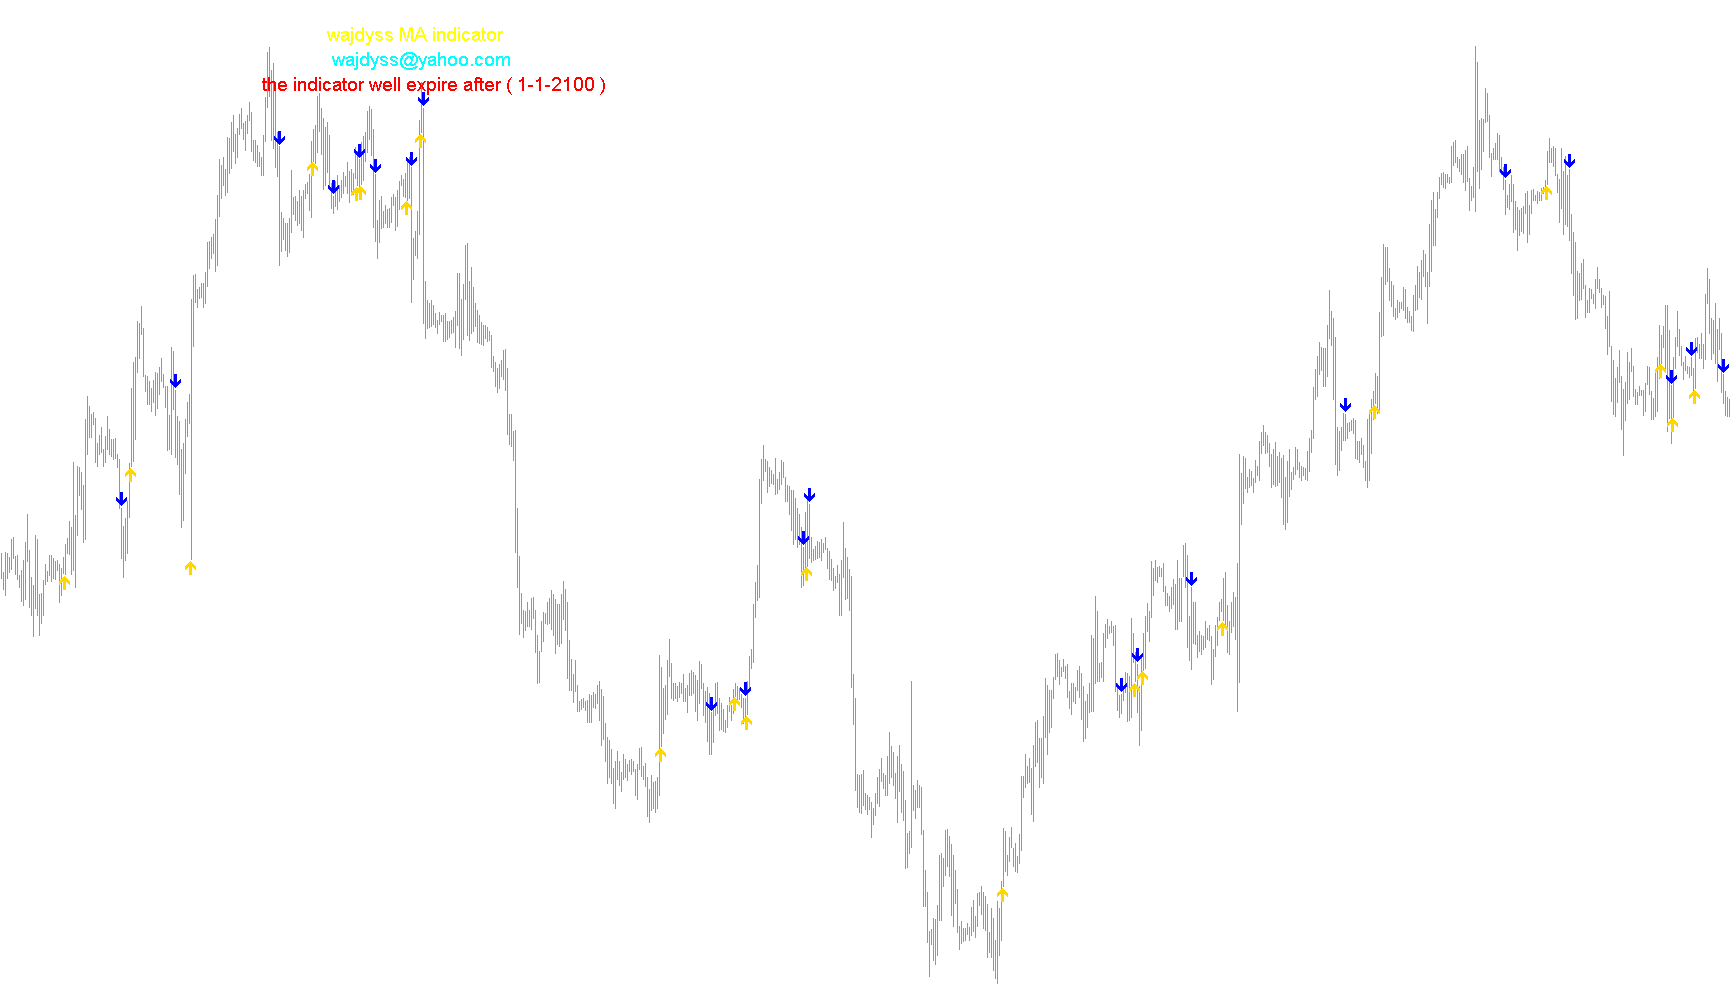
This indicator identifies trend reversal opportunities by detecting bullish and bearish crossovers between a fast and slow moving average while tracking historical signal reliability.

WAJDYSS_SSL_channel_chart_alert_indicator_v2
Indicator

WAJDYSS_SSL_channel_chart_alert_indicator_v2

iMA

This indicator identifies trend shifts by calculating dynamic upper and lower boundaries based on moving average extremes and generating visual signals upon channel crossovers.

WavyDash
Indicator

WavyDash

iMA

The algorithm identifies trend polarity by comparing price action against High/Low SMA bounds and projects subsequent value projections based on EMA-calculated distance variances.

WeightedCross
Indicator

WeightedCross

iMA

This indicator identifies trend shifts by calculating the intersection of two linearly weighted moving averages with specific price-action offsets to trigger directional alerts.

WelchBBWidth
Indicator

WelchBBWidth

iMA

This indicator identifies market regime shifts by calculating Bollinger Band width relative to historical extremes to detect squeeze zones and transitional volatility.

WildersDMI_v1.1
Indicator

WildersDMI_v1.1

iMA

This indicator calculates smoothed directional movement and trend strength by applying Wilder's smoothing technique to price range dynamics and relative bull/bear pressure.

WildersDMI_v1
Indicator

WildersDMI_v1

iMA

This indicator calculates directional movement and trend strength by applying Wilder's smoothing technique to the Plus/Minus Directional Indicators and Average Directional Index.

wma_cross
Indicator

wma_cross

iMA

This indicator identifies directional shifts by detecting crossovers between short-term and long-term linear weighted moving averages while providing specific exit signals based on medium-period reversals relative to the primary trend line.

wma_cross1
Indicator

wma_cross1

iMA

This indicator identifies trend reversals by detecting crossovers between fast and slow linear weighted moving averages while providing dynamic exit signals based on intermediate period convergence.

wma_cross2
Indicator

wma_cross2

iMA

This indicator identifies bullish and bearish momentum shifts through short-term moving average crossovers relative to a long-term trend, while simultaneously generating counter-trend exit signals using a medium-term median threshold.

wma_cross6
Indicator

wma_cross6

iMA

This indicator identifies trend reversals by detecting the specific moment short-term moving averages cross over large-period baselines with a customizable price delta buffer.

wma_cross_3ema
Indicator

wma_cross_3ema

iMA

This indicator identifies bullish and bearish reversals by detecting instances where a short-term moving average crosses simultaneously above or below both medium and long-term trend averages.

wma_cross_3emaRSI
Indicator

wma_cross_3emaRSI

iMAiRSI

This indicator identifies bullish and bearish reversals by detecting simultaneous crossovers of multiple moving average periods synchronized with Relative Strength Index threshold breaches.

wma_cross_confirm
Indicator

wma_cross_confirm

iMA

Identifies bullish and bearish entries via Linear Weighted Moving Average intersections while providing secondary exit signals based on medium-term trend deviations.

wma_cross_delta
Indicator

wma_cross_delta

iMA

This indicator identifies trend reversals by detecting specific price crossovers where a short-term moving average intersects a long-term moving average plus a defined pip delta.

WPROnChart
Indicator

WPROnChart

iWPRiMA

This indicator projects the Williams Percent Range (WPR) oscillator onto a price chart by calculating an offset based on the EMA of the median price.

X-Pair
Indicator

X-Pair

iMA

This indicator monitors concurrent moving average crossovers across multiple currency pairs and commodities to provide a unified real-time trend sentiment display.

X-Pair_v1
Indicator

X-Pair_v1

iMA

This indicator synchronizes real-time moving average crossovers across multiple currency pairs and commodities to provide a unified directional bias on a single dashboard.

X5
Indicator

X5

iMA

This indicator calculates the cumulative momentum of major fiat currencies by aggregating weighted moving average deviations across a basket of correlated currency pairs.

Indicator

Xard-MM2

iMAiRSI
xb4a
Indicator

xb4a

iMA

This indicator maps directional momentum by isolating price shifts in an exponential moving average to highlight structural reversals.

Xma[1]
Indicator

Xma[1]

iMA

This indicator calculates an adaptive moving average that only updates its value when the variance between consecutive price actions exceeds a predefined point threshold, effectively filtering out minor market noise.

Xma_3col[1]
Indicator

Xma_3col[1]

iMA

This indicator filters price volatility by maintaining a constant moving average value until the delta between consecutive periods exceeds a user-defined point threshold.

Xma_Coloured
Indicator

Xma_Coloured

iMA

This indicator identifies trend reversals by detecting price breaches of a smoothed moving average that only updates when the variance exceeds a specific sensitivity threshold.

Xma_Coloured[1]
Indicator

Xma_Coloured[1]

iMA

The algorithm identifies trend shifts by detecting price breaches of a calculated moving average signal that only updates when the difference between two consecutive moving averages exceeds a defined volatility threshold.

Xma_col[1]
Indicator

Xma_col[1]

iMA

This indicator identifies structural market shifts by detecting significant price deviations between consecutive moving averages to generate distinct trend direction signals.

xpMA
Indicator

xpMA

iMAiMAOnArray

This indicator synthesizes diverse moving average methodologies, including TEMA and Jurik, to identify trend reversals via price displacement relative to a dynamic step-period mean.

xpMA_001
Indicator

xpMA_001

iMAiMAOnArray

This indicator identifies momentum shifts by comparing dynamic moving average values against a localized mean to generate visual directional signals and alerts.

xpMA_002
Indicator

xpMA_002

iMAiMAOnArray

This indicator synthesizes diverse moving average methodologies, including T3 and Jurik, to generate directional trend reversals via dynamic price comparison and automated visual signaling.

xpMA_004
Indicator

xpMA_004

iMAiMAOnArray

This indicator identifies trend reversals by comparing a user-selectable moving average (including TEMA, DEMA, and Jurik) against a secondary short-term mean to generate visual entry signals.

xpMA_mod
Indicator

xpMA_mod

iMAiMAOnArray

This indicator identifies trend reversals by comparing price action against a customizable array of advanced moving averages, triggering visual signals when the current value crosses a localized mean threshold.