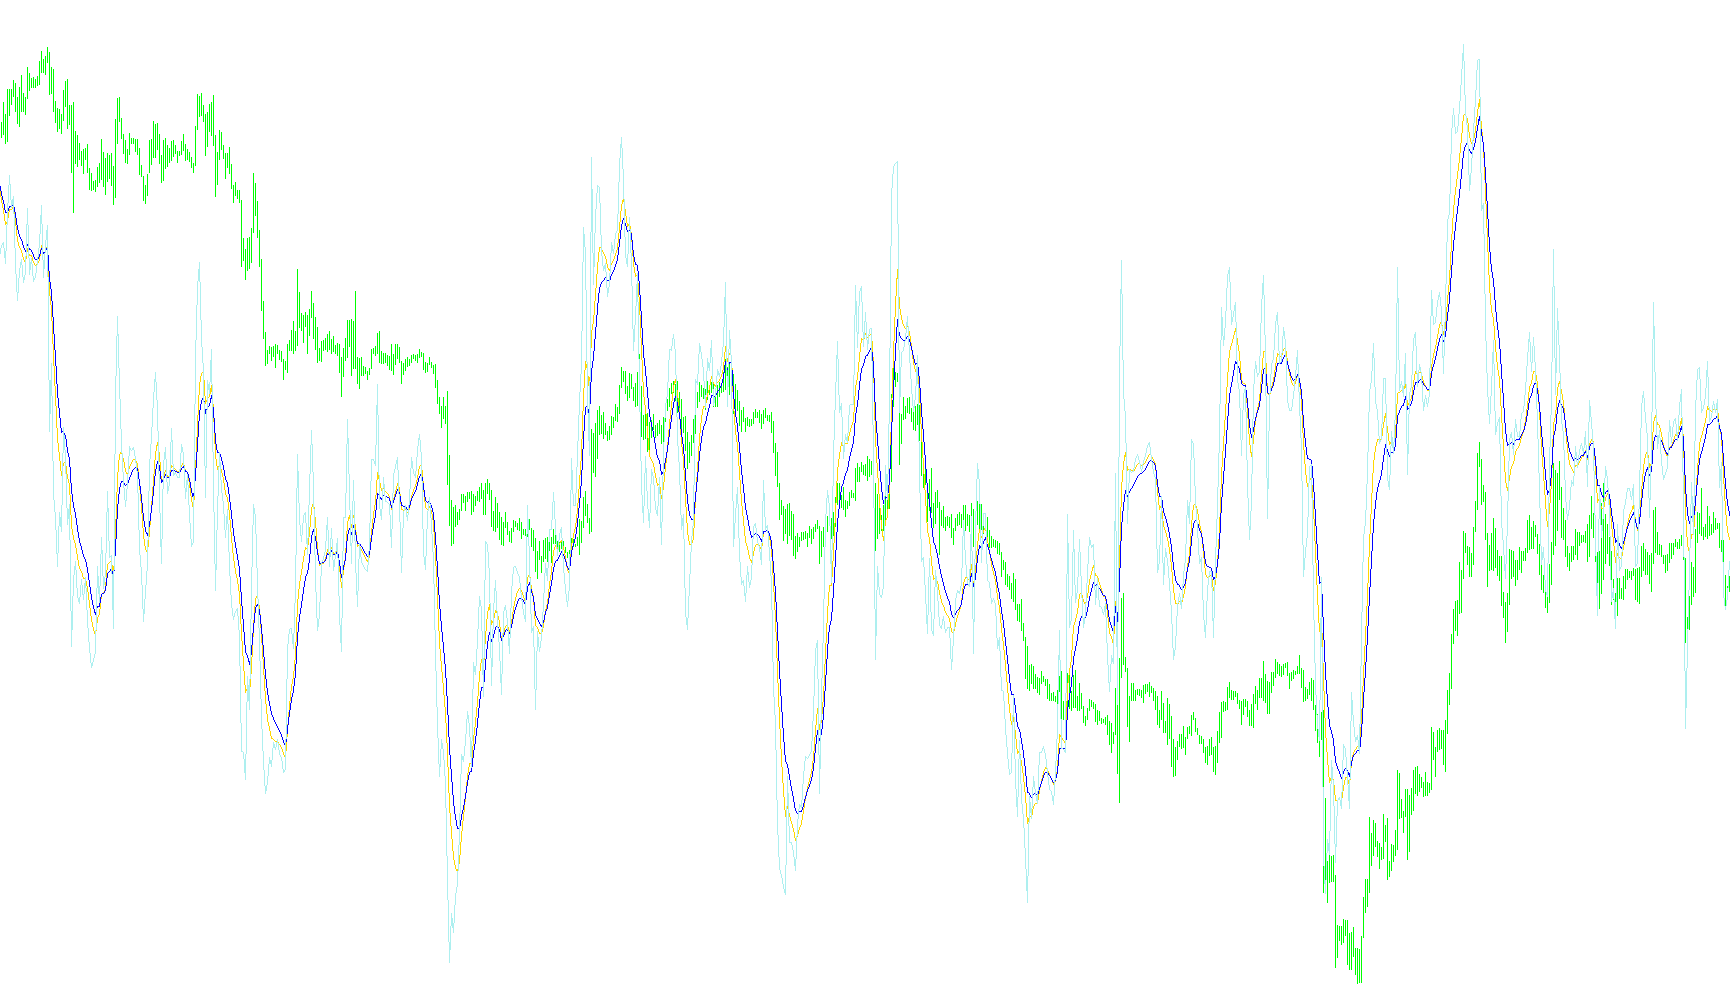
10Min_011a_v1
Indicator

10Min_011a_v1

iMACDiMAiRSIiStochastic

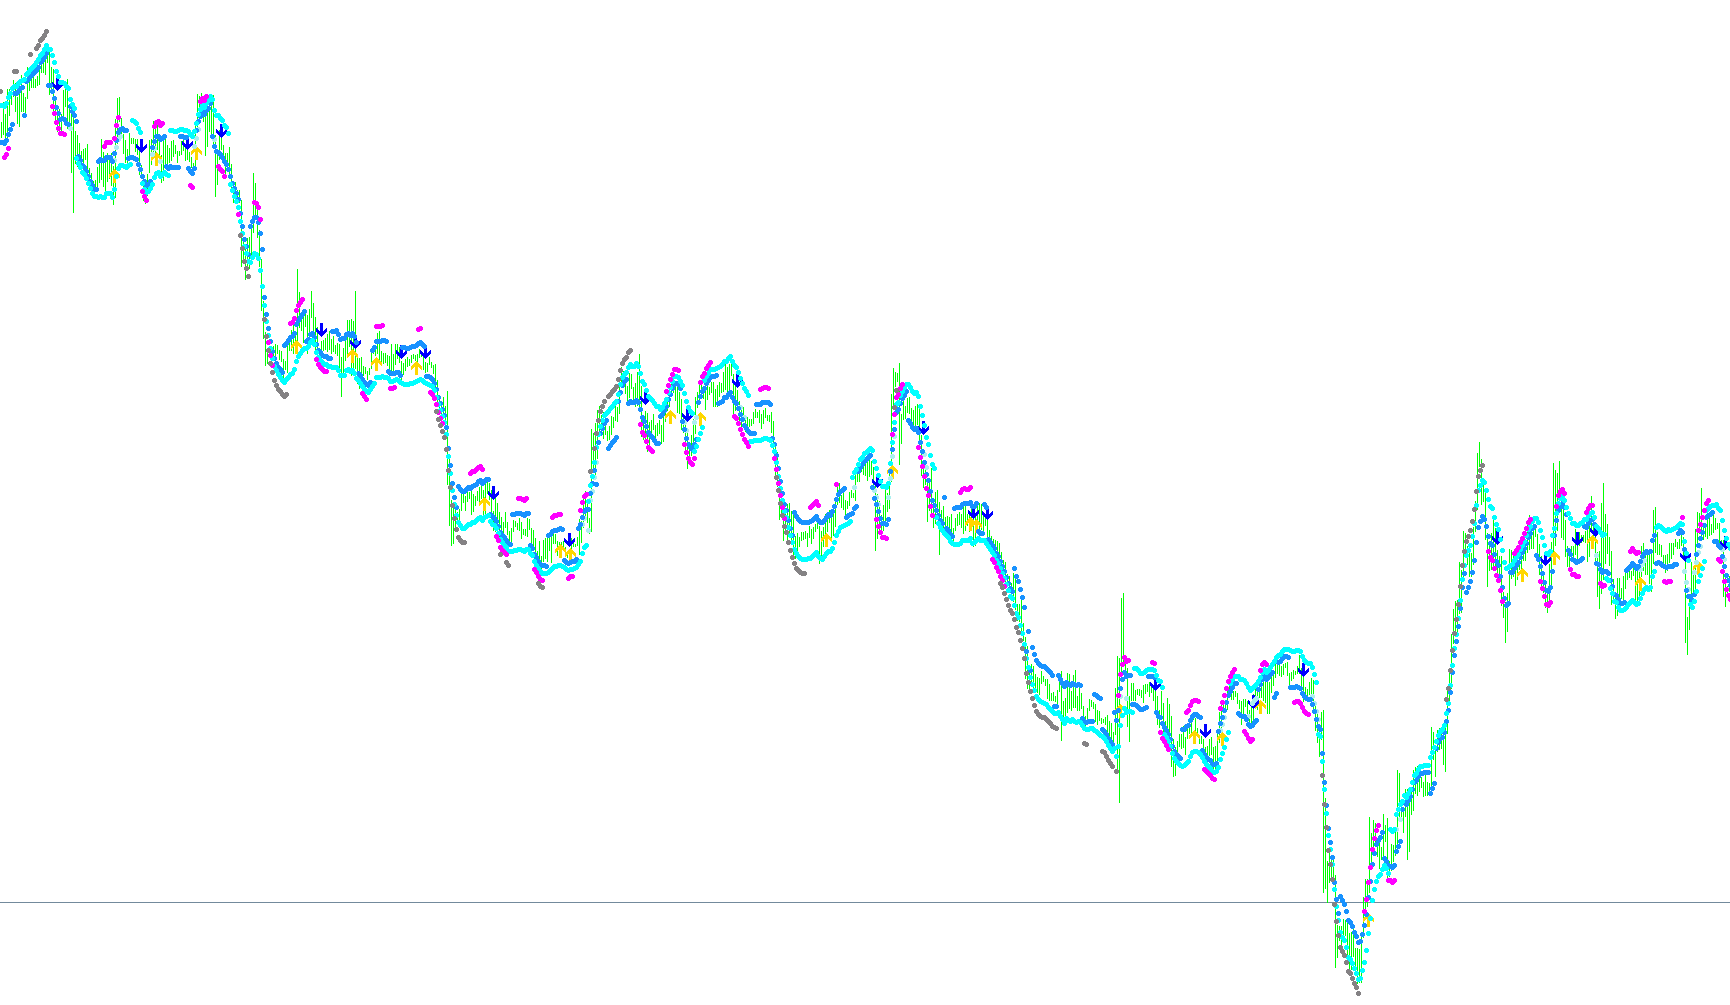
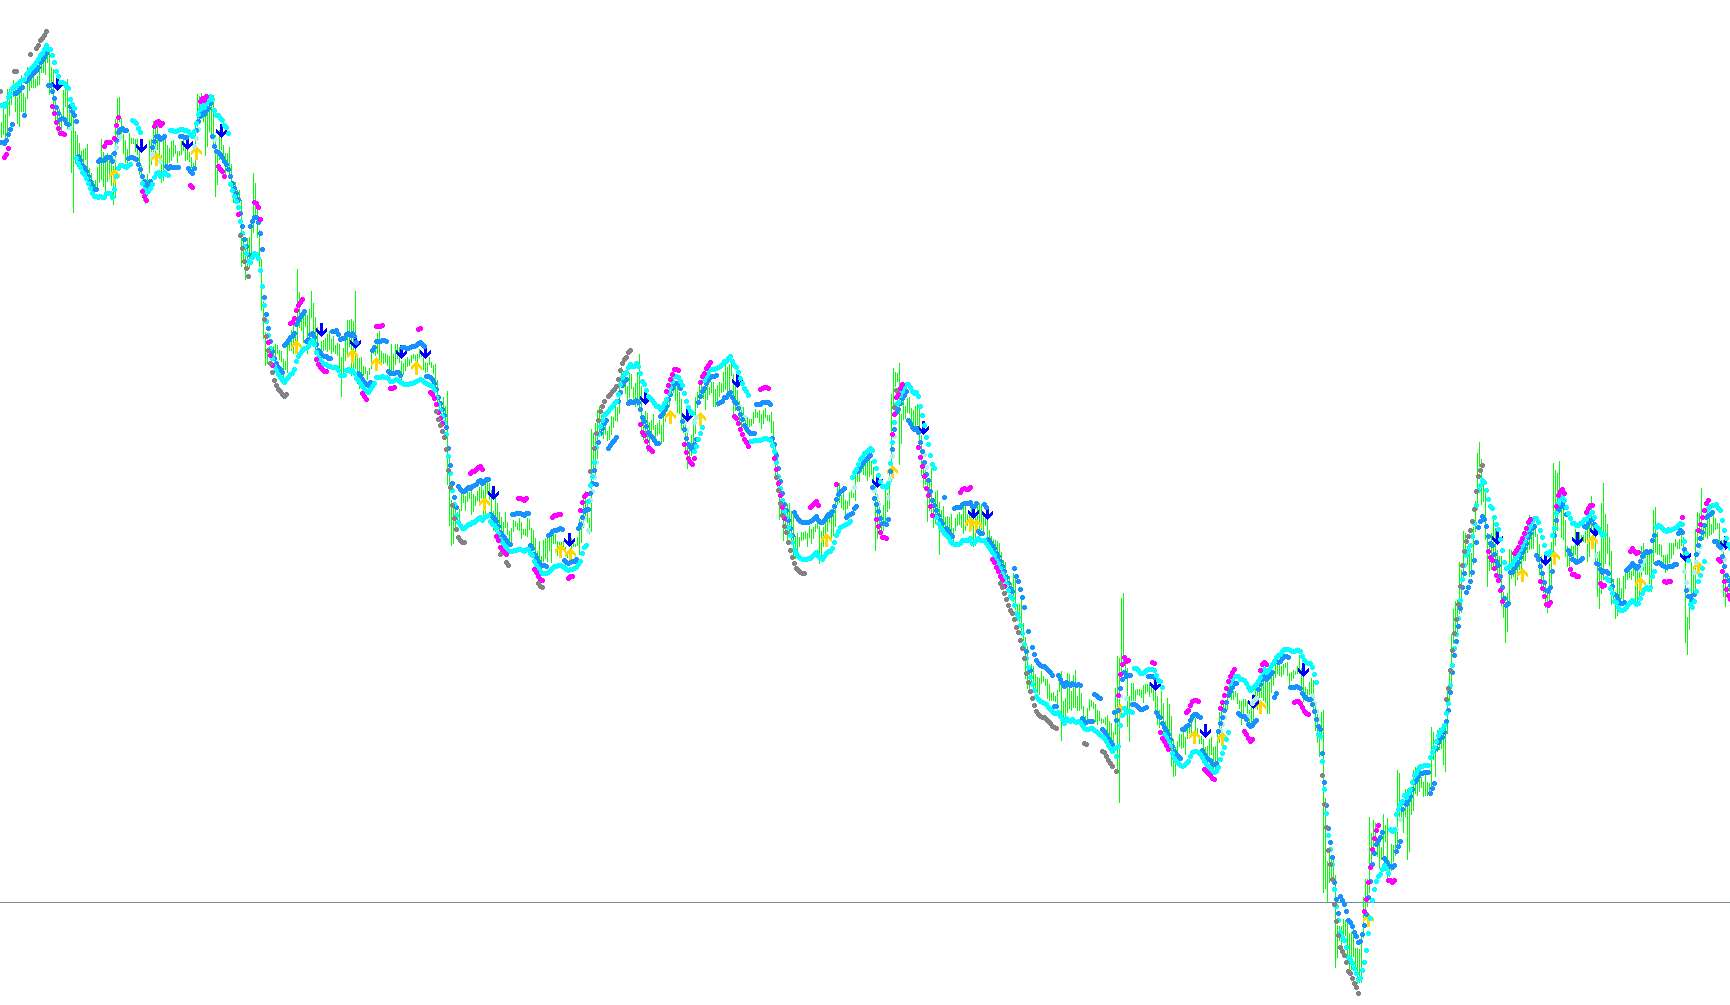
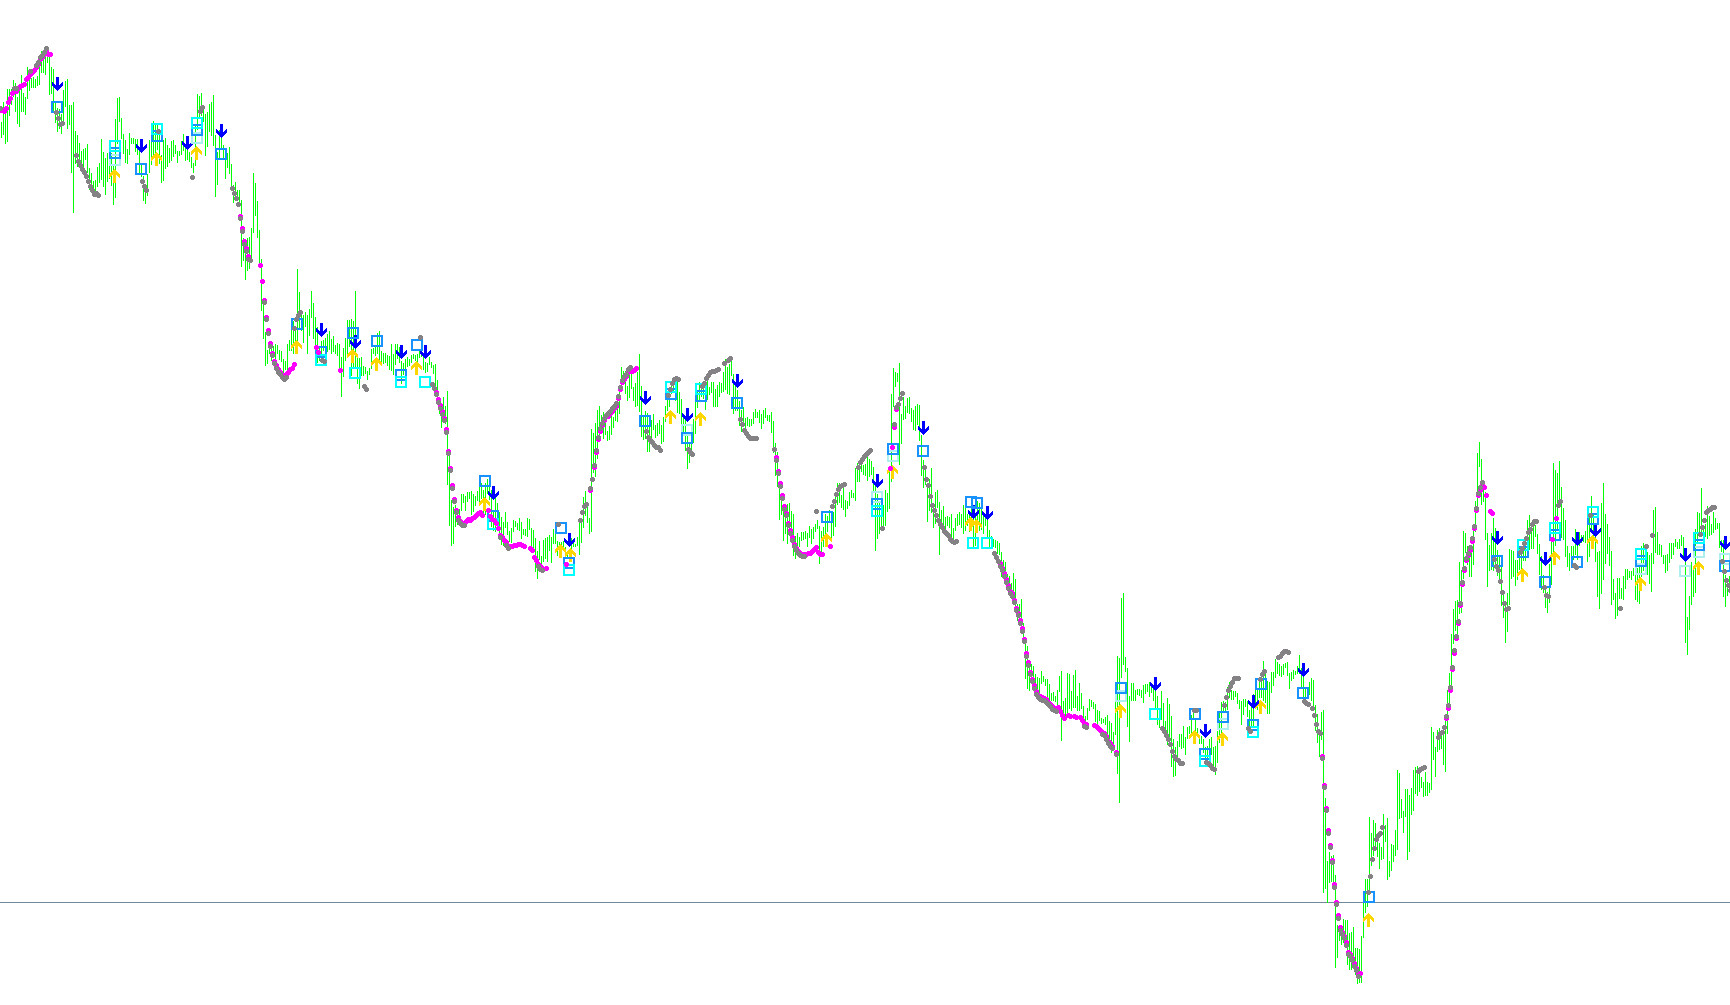
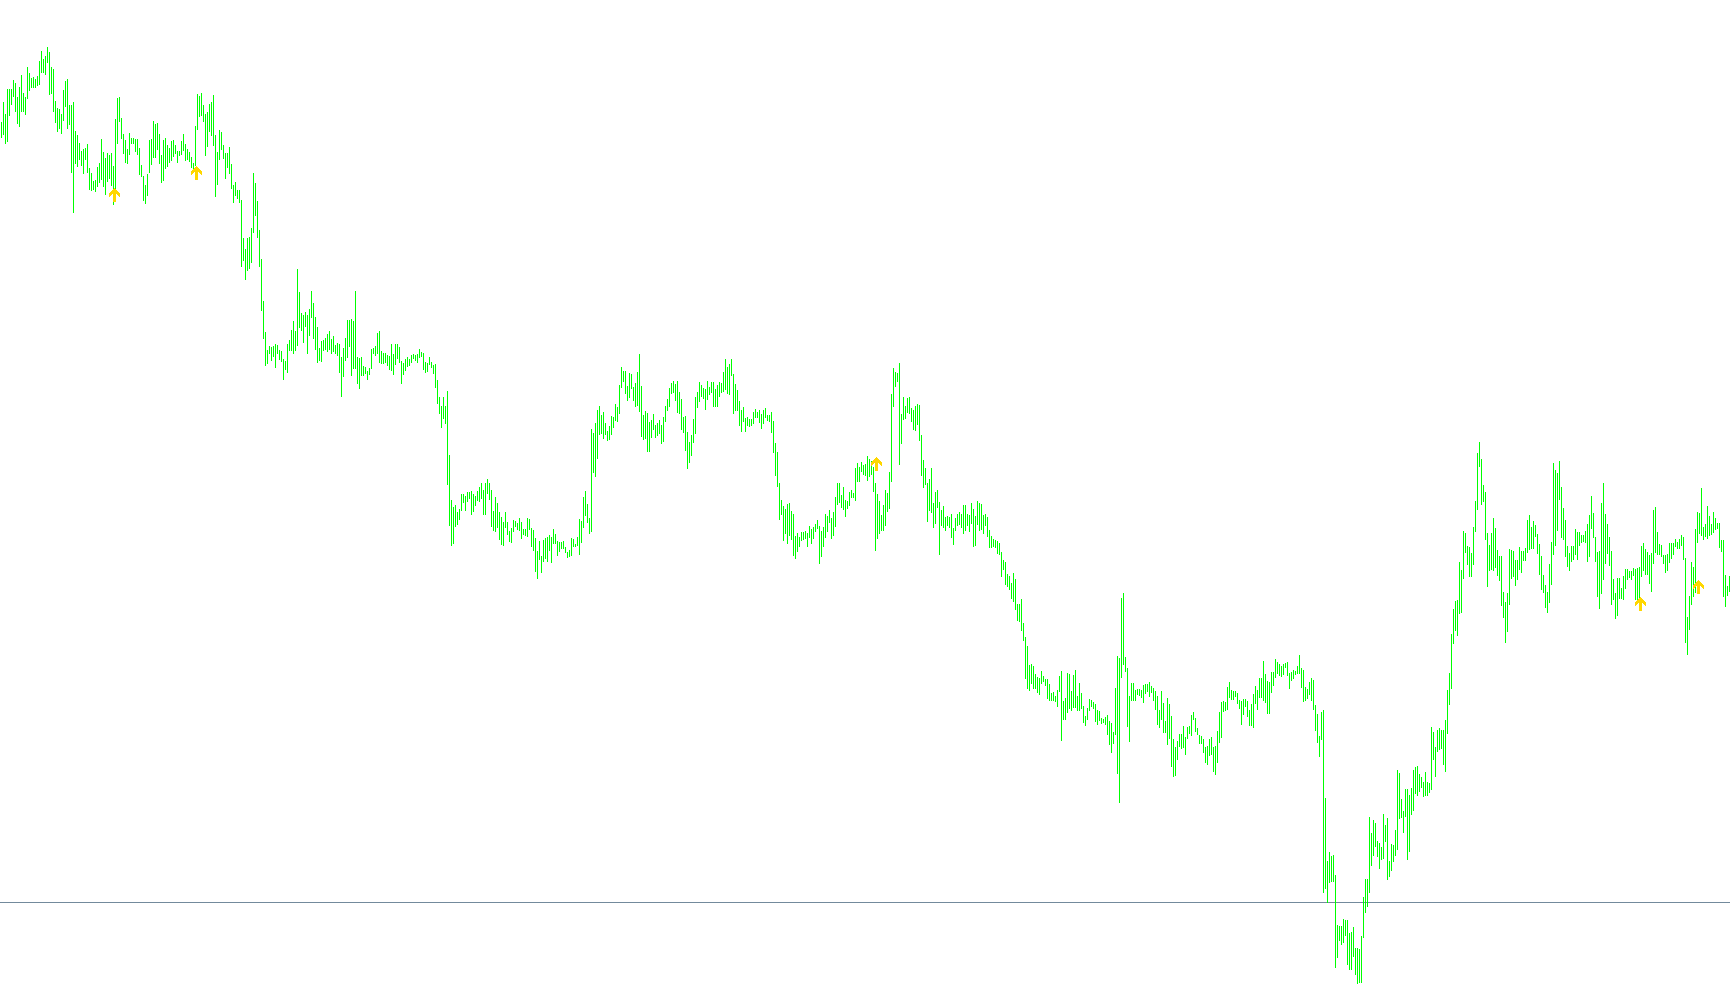
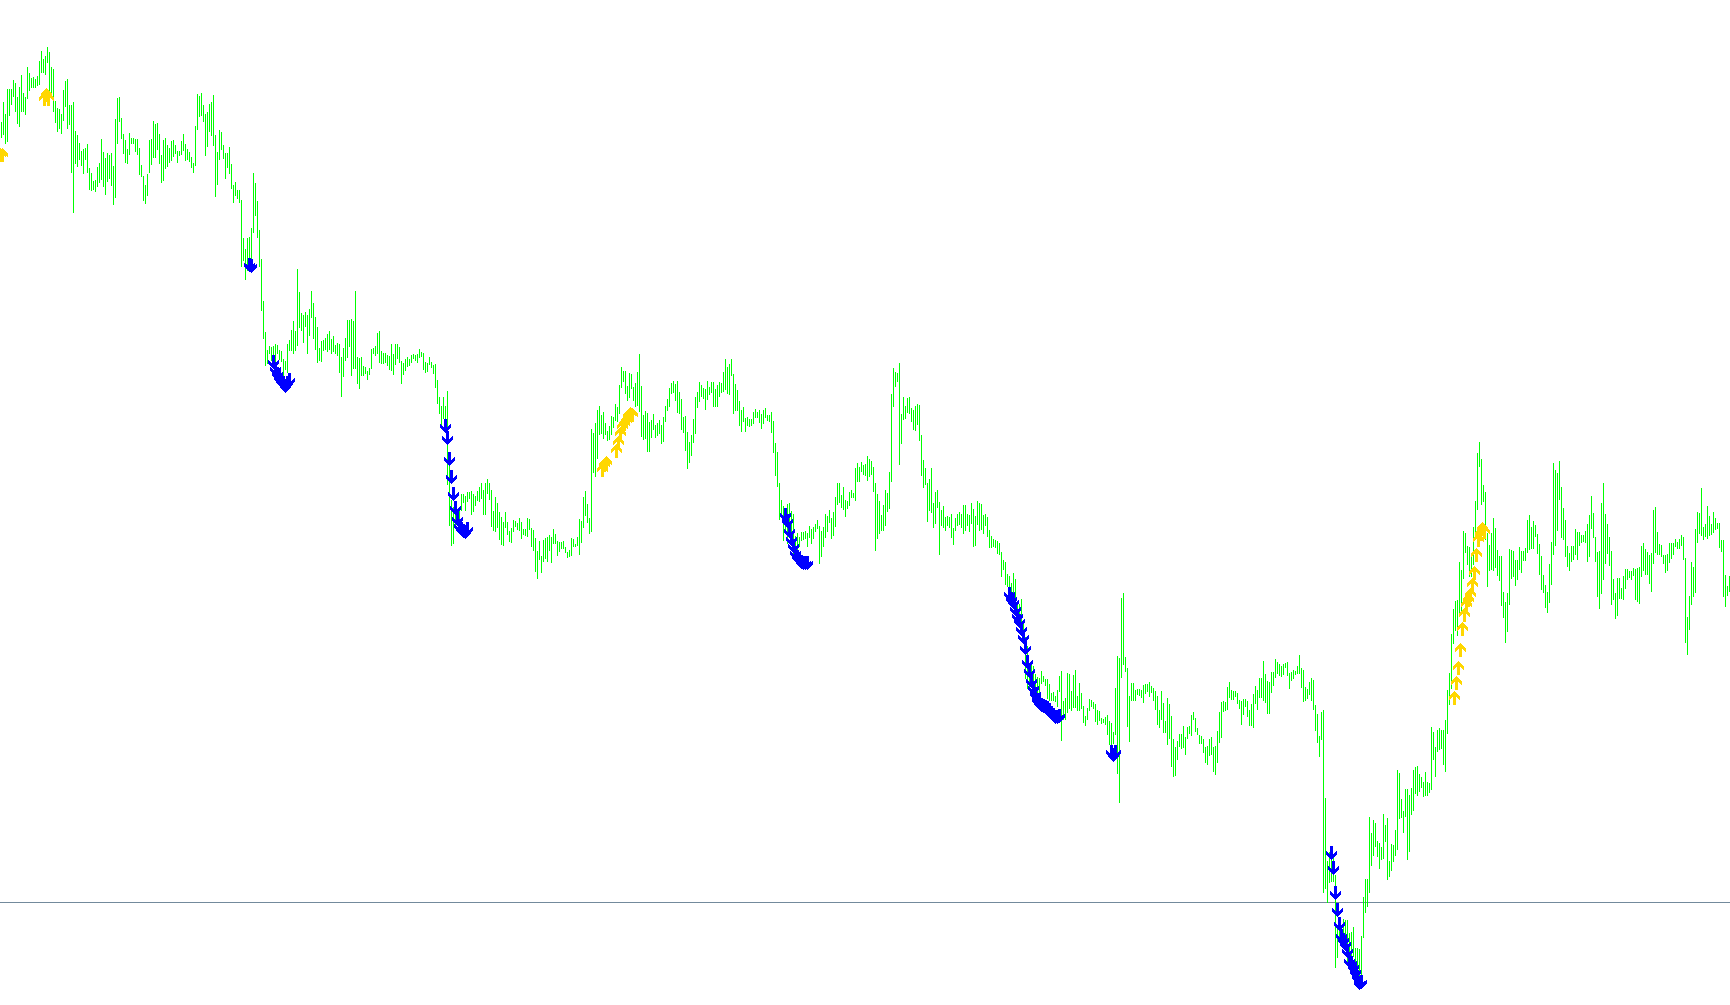
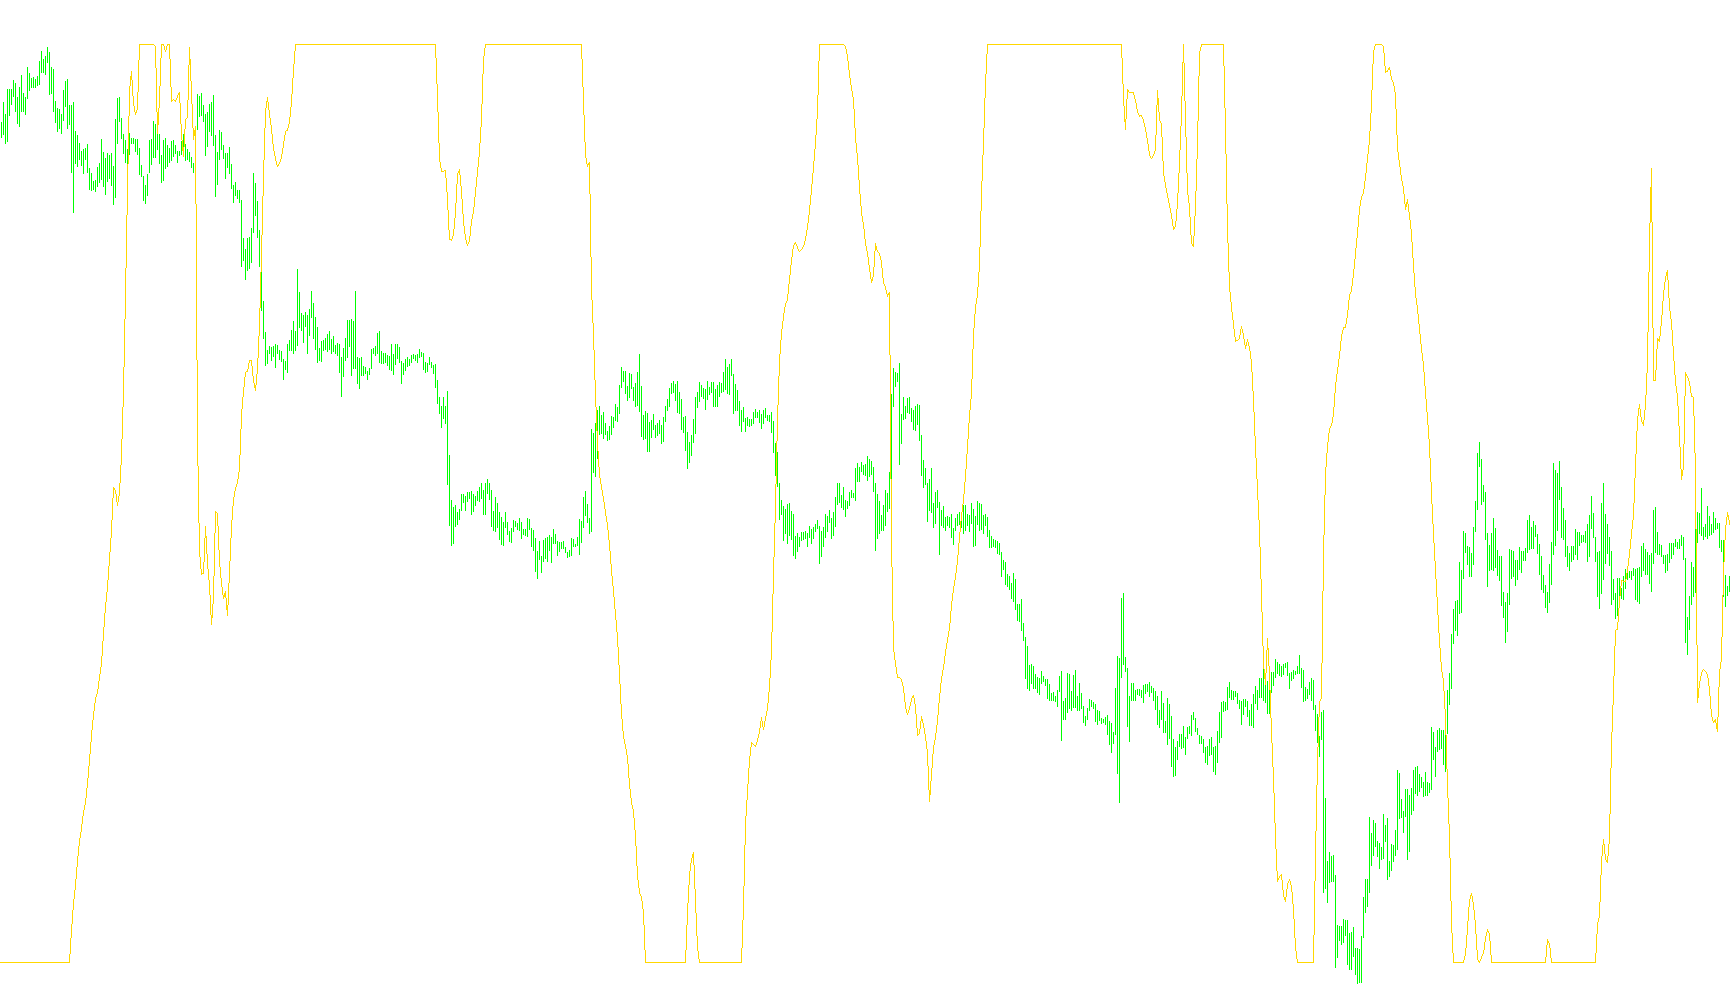
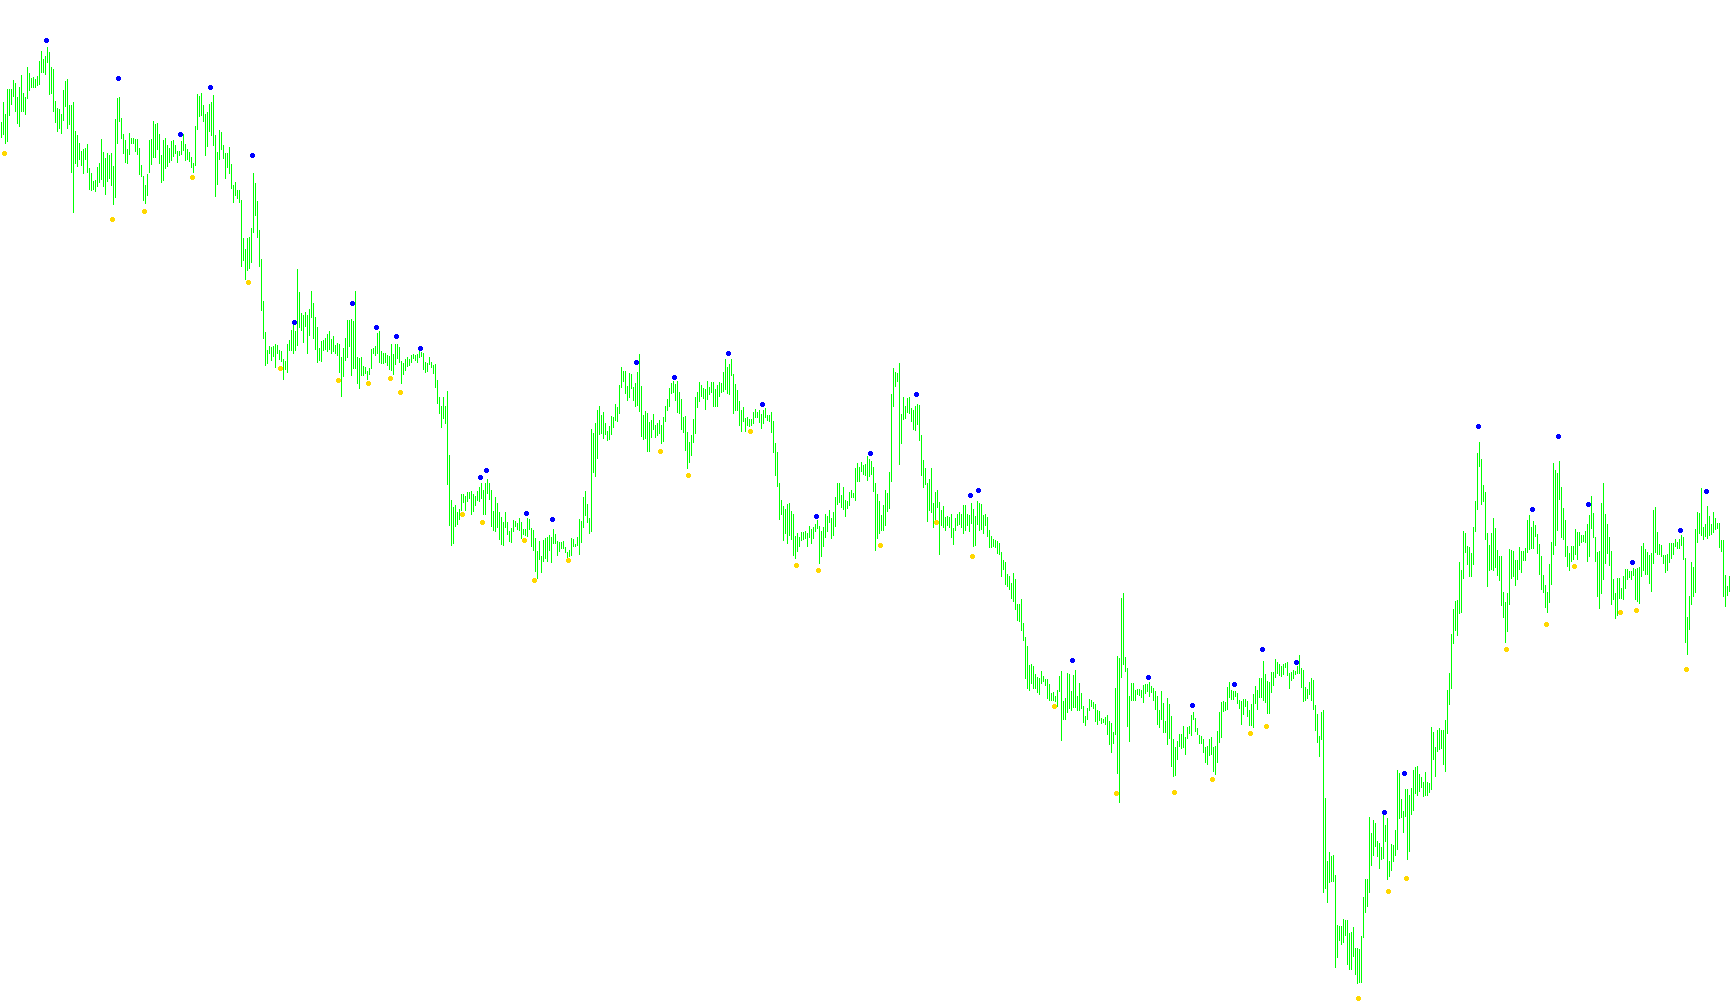
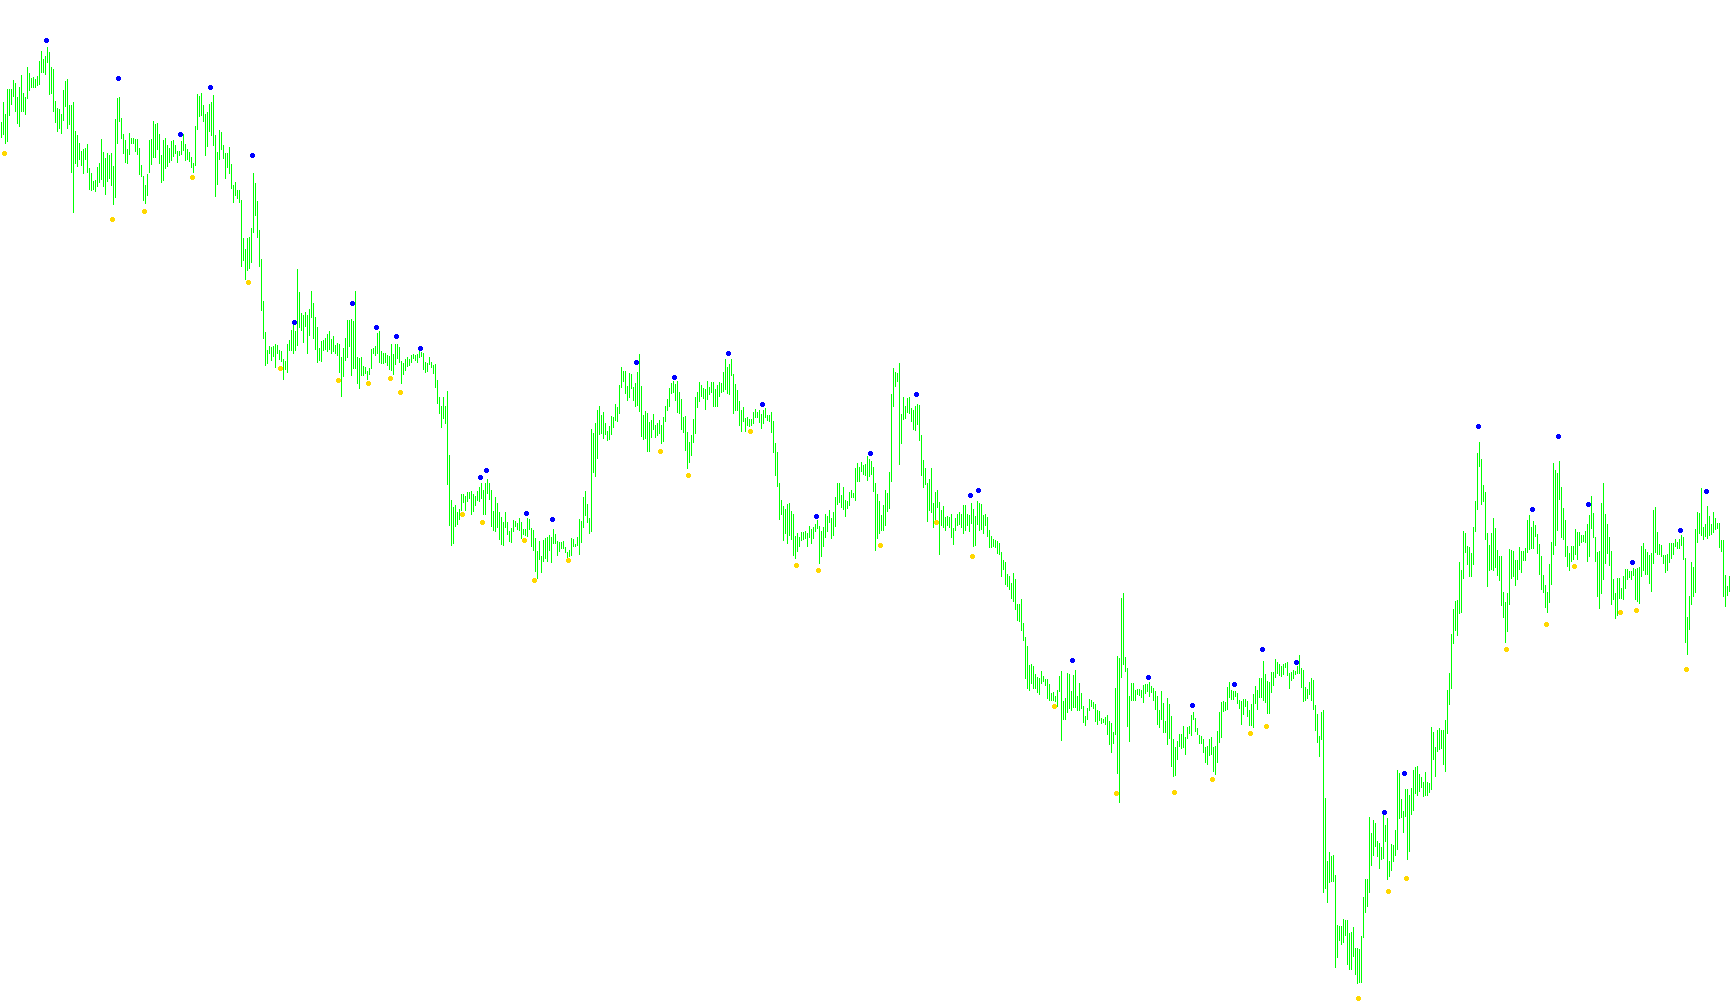
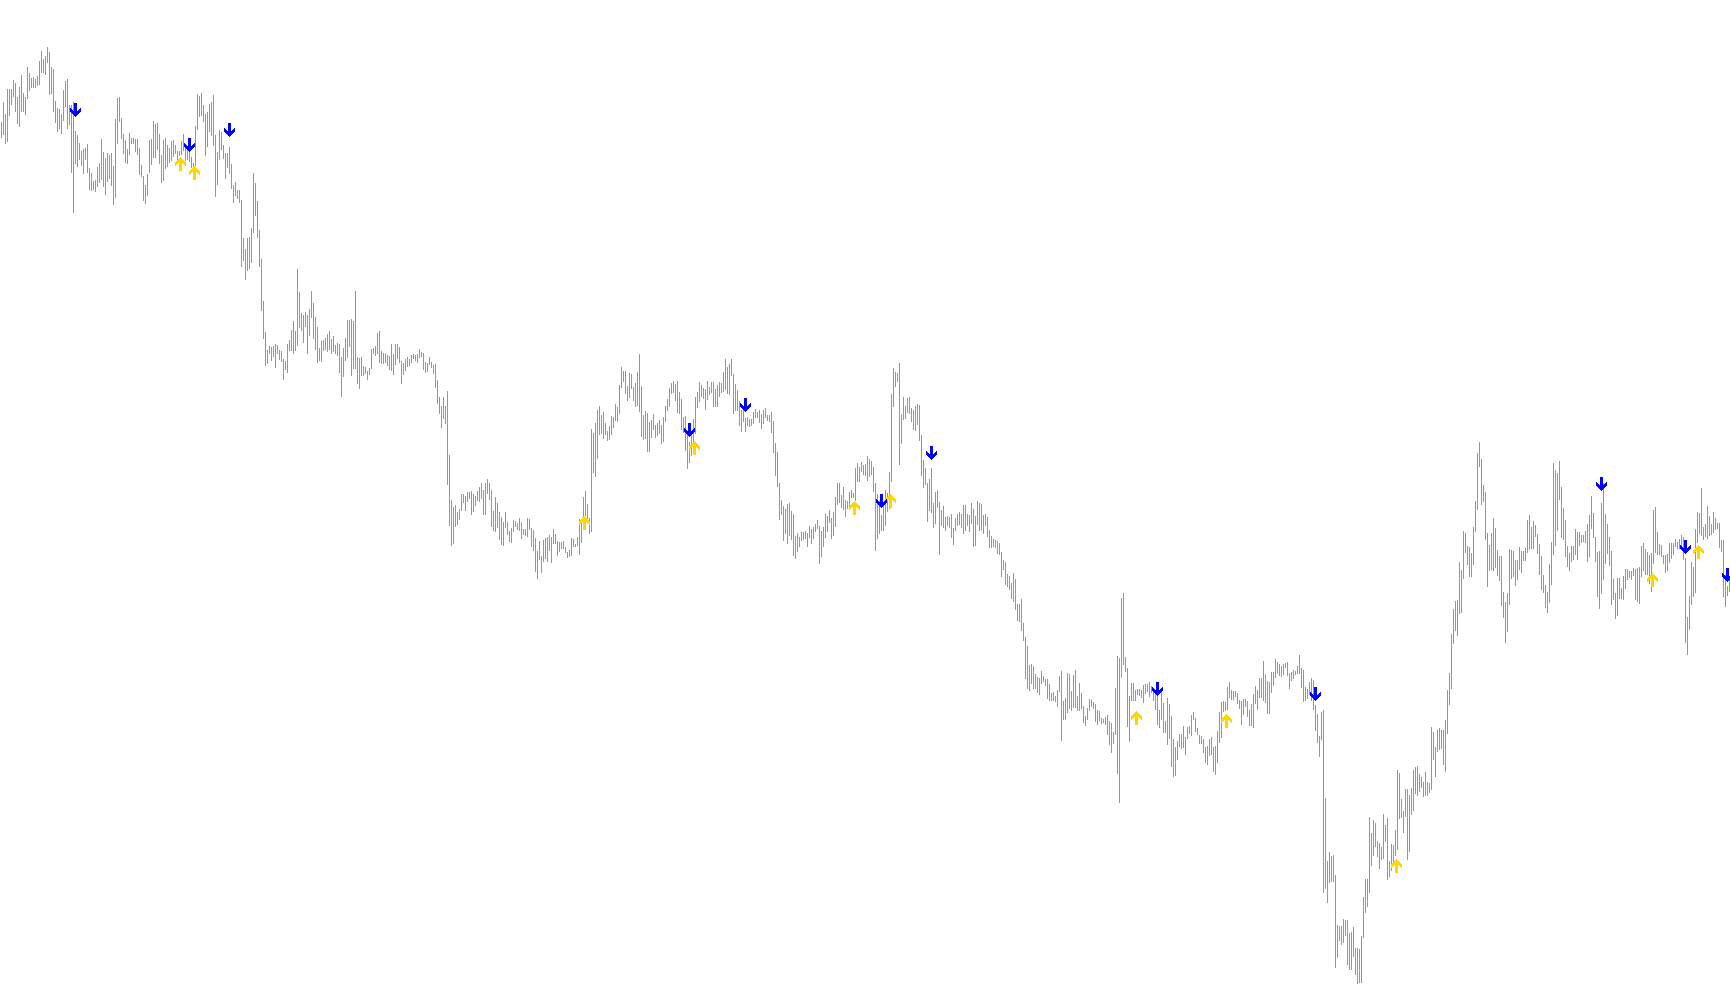
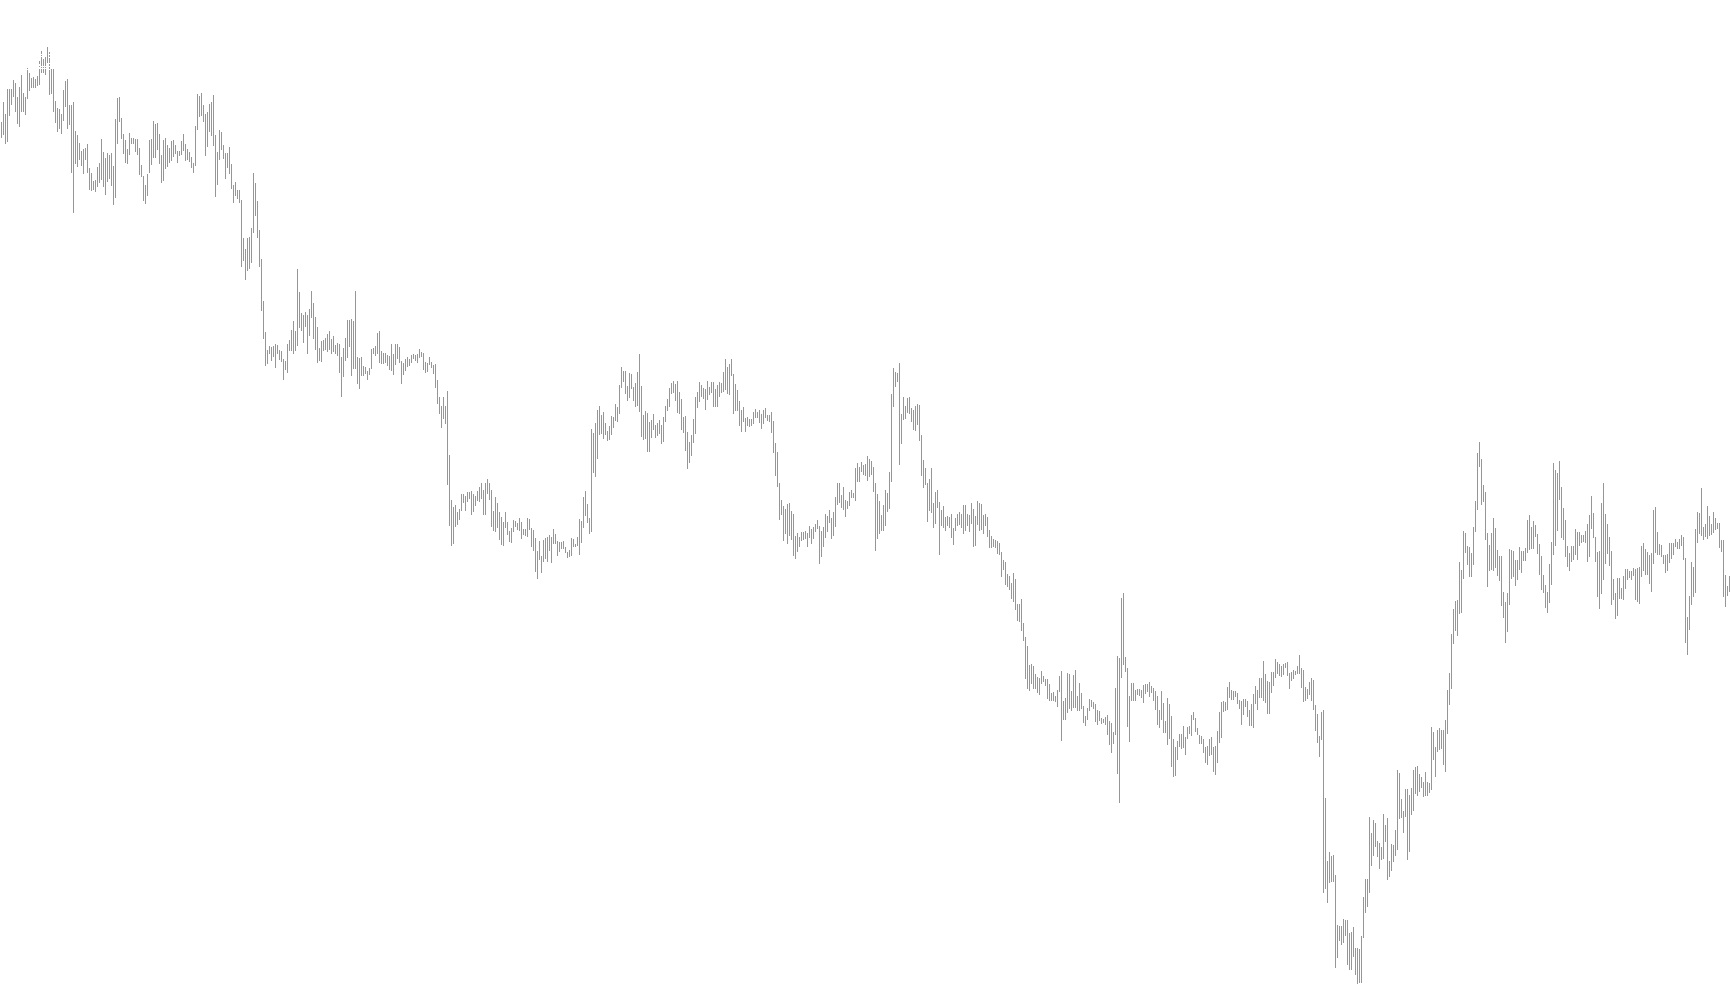
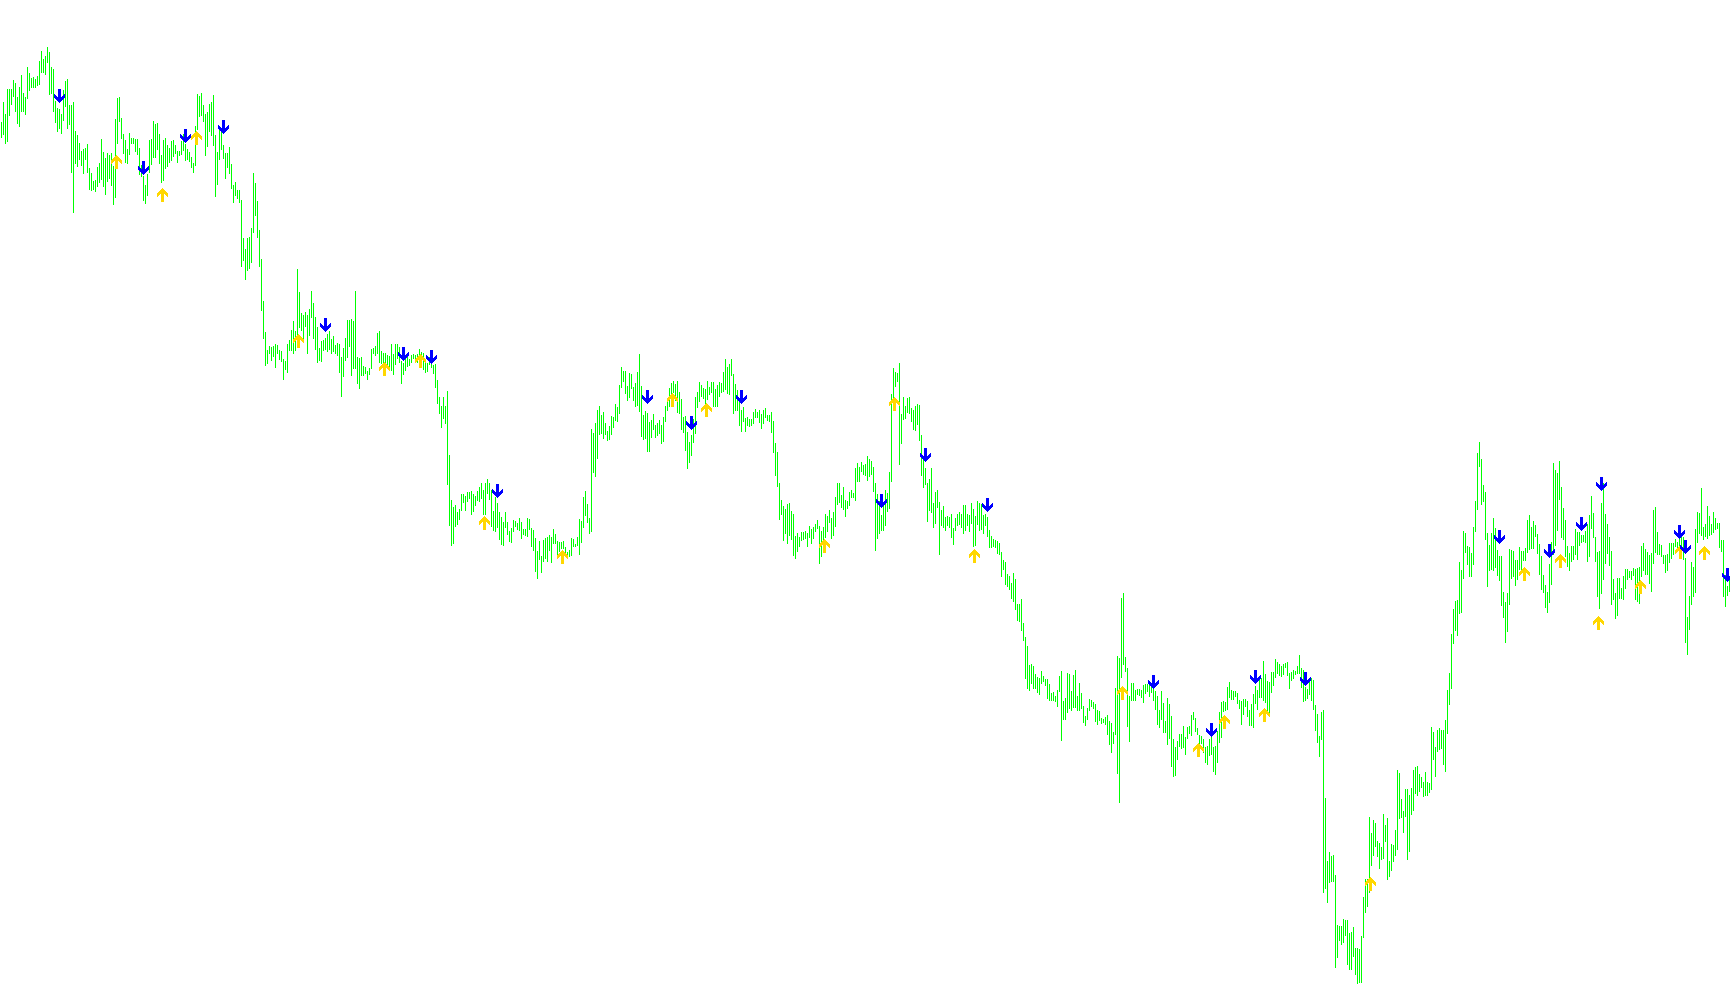
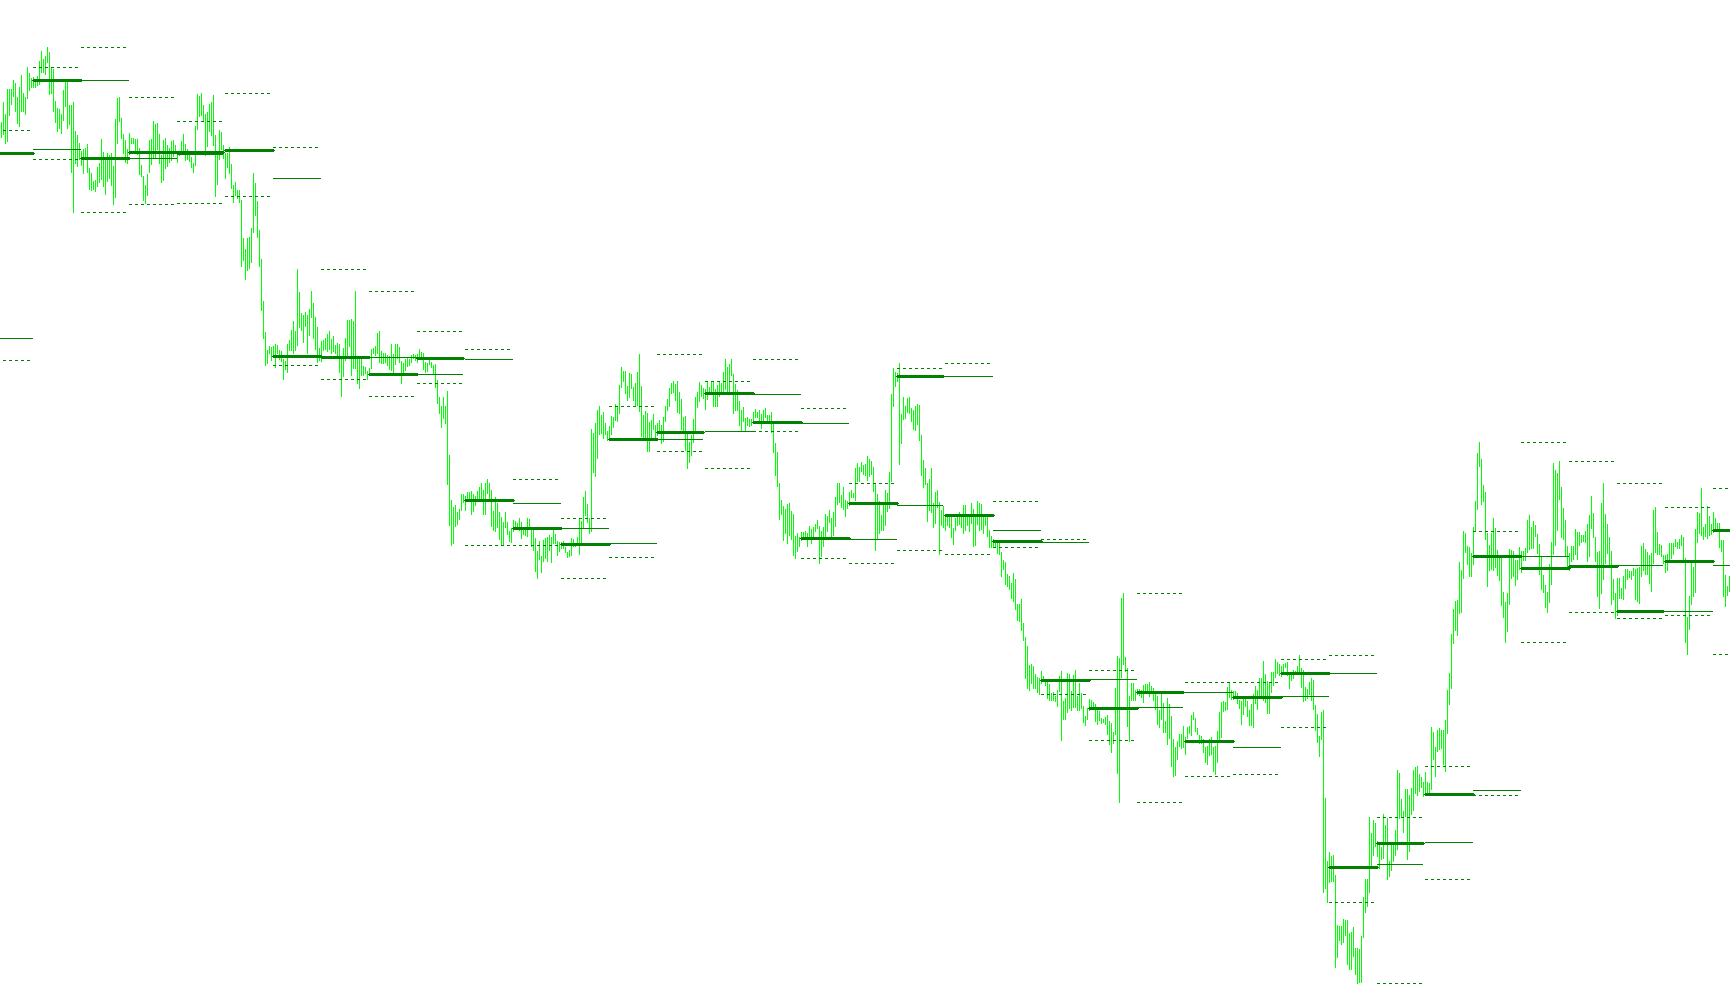
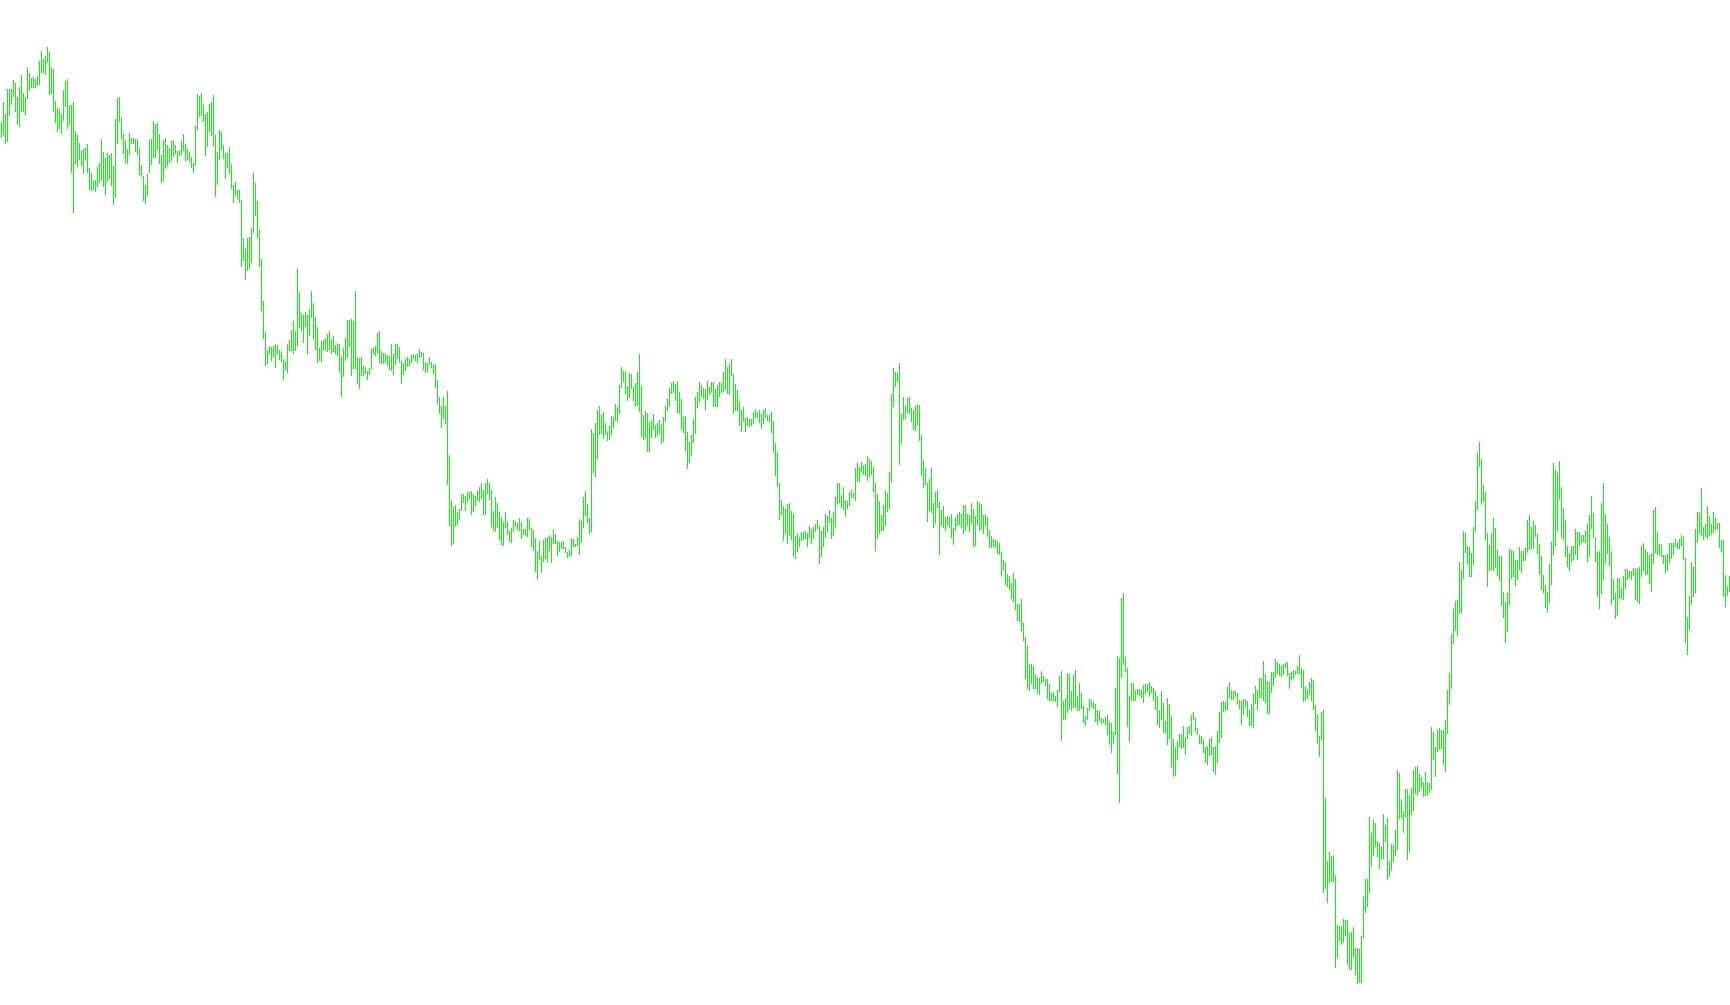
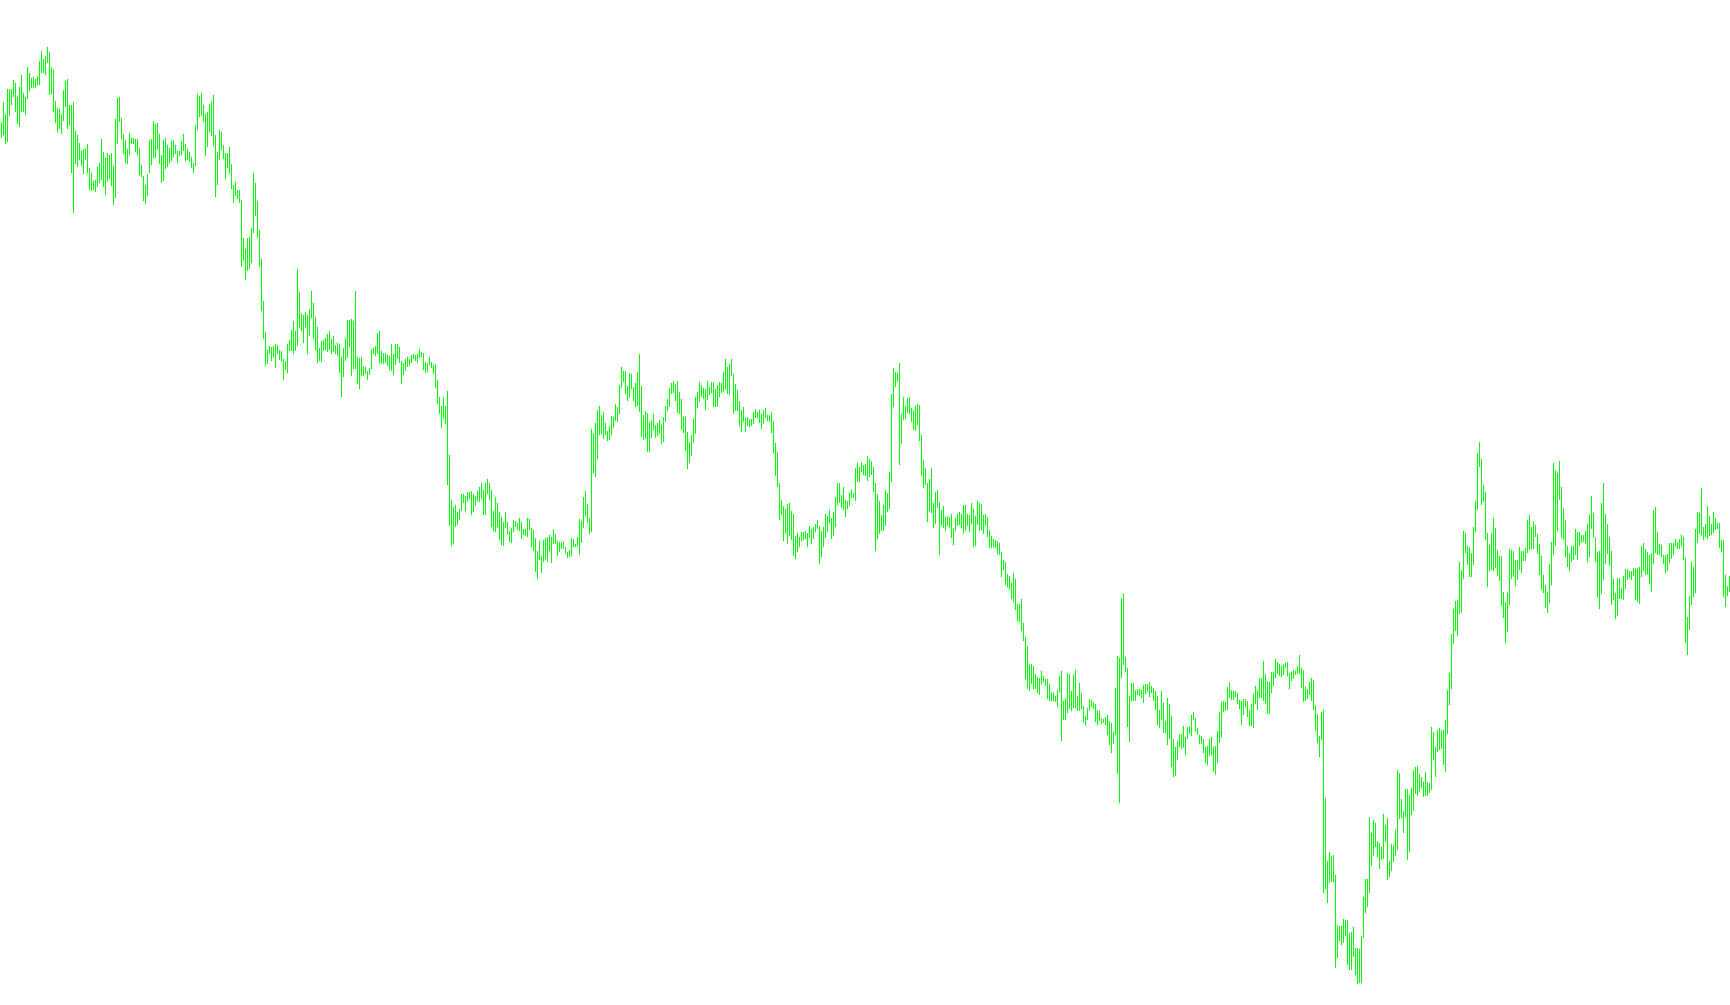
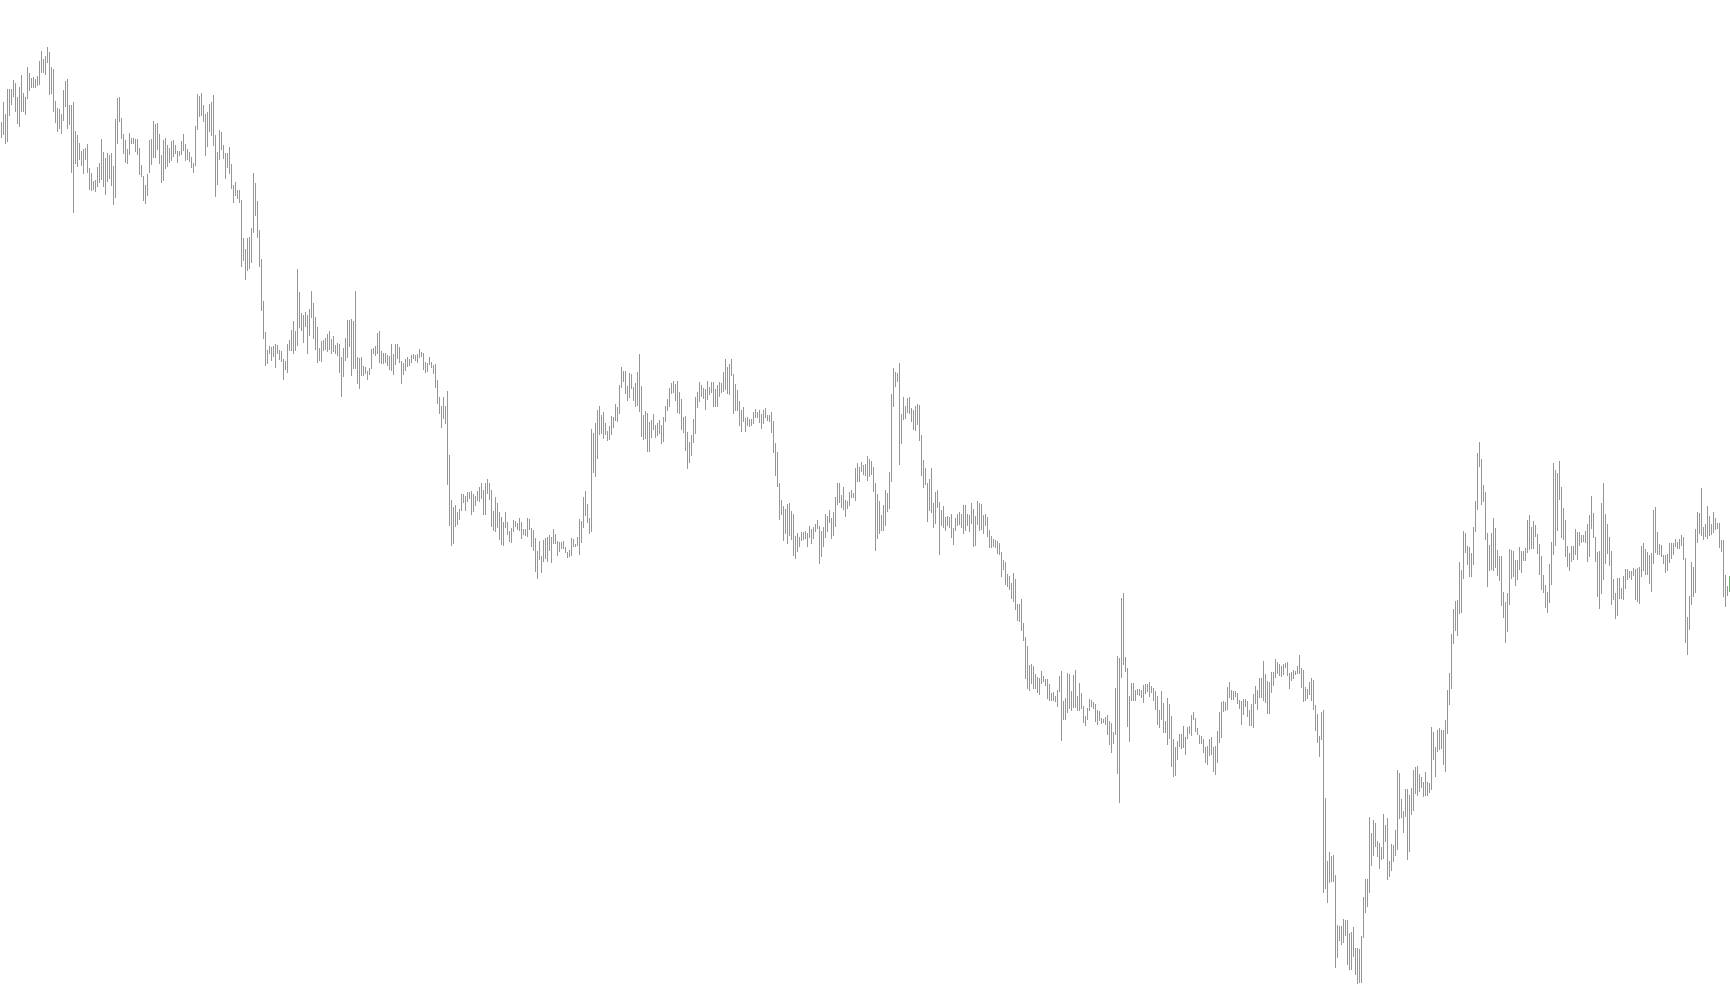
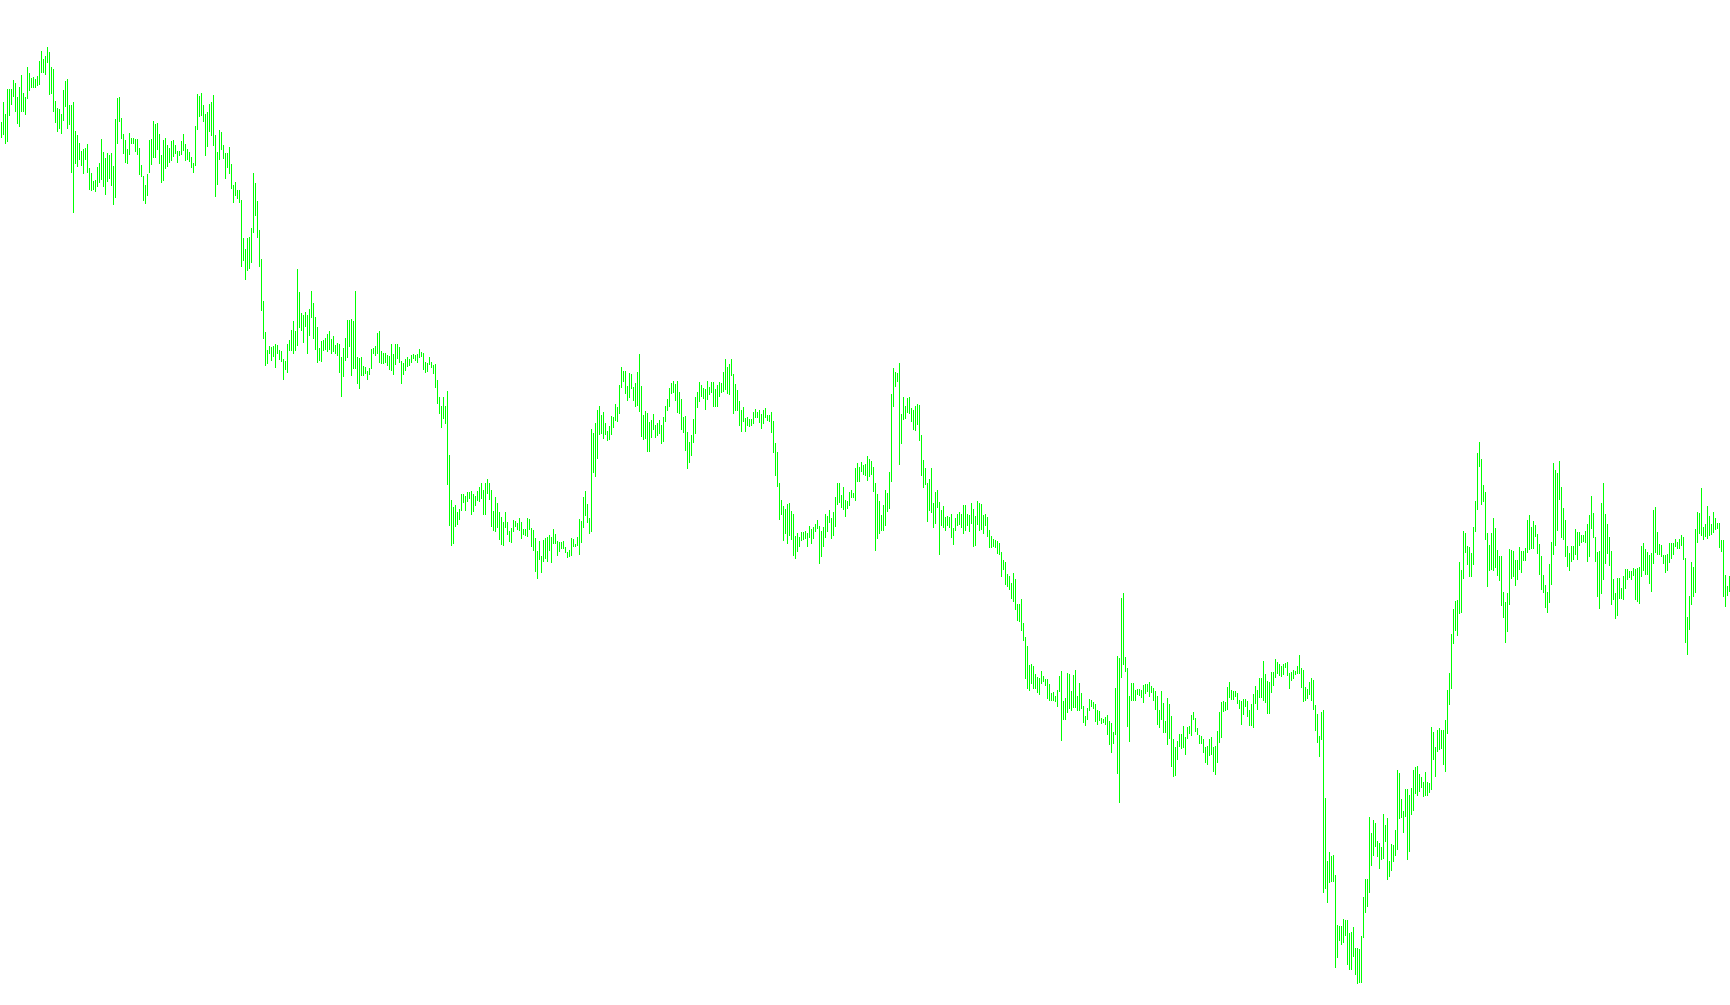
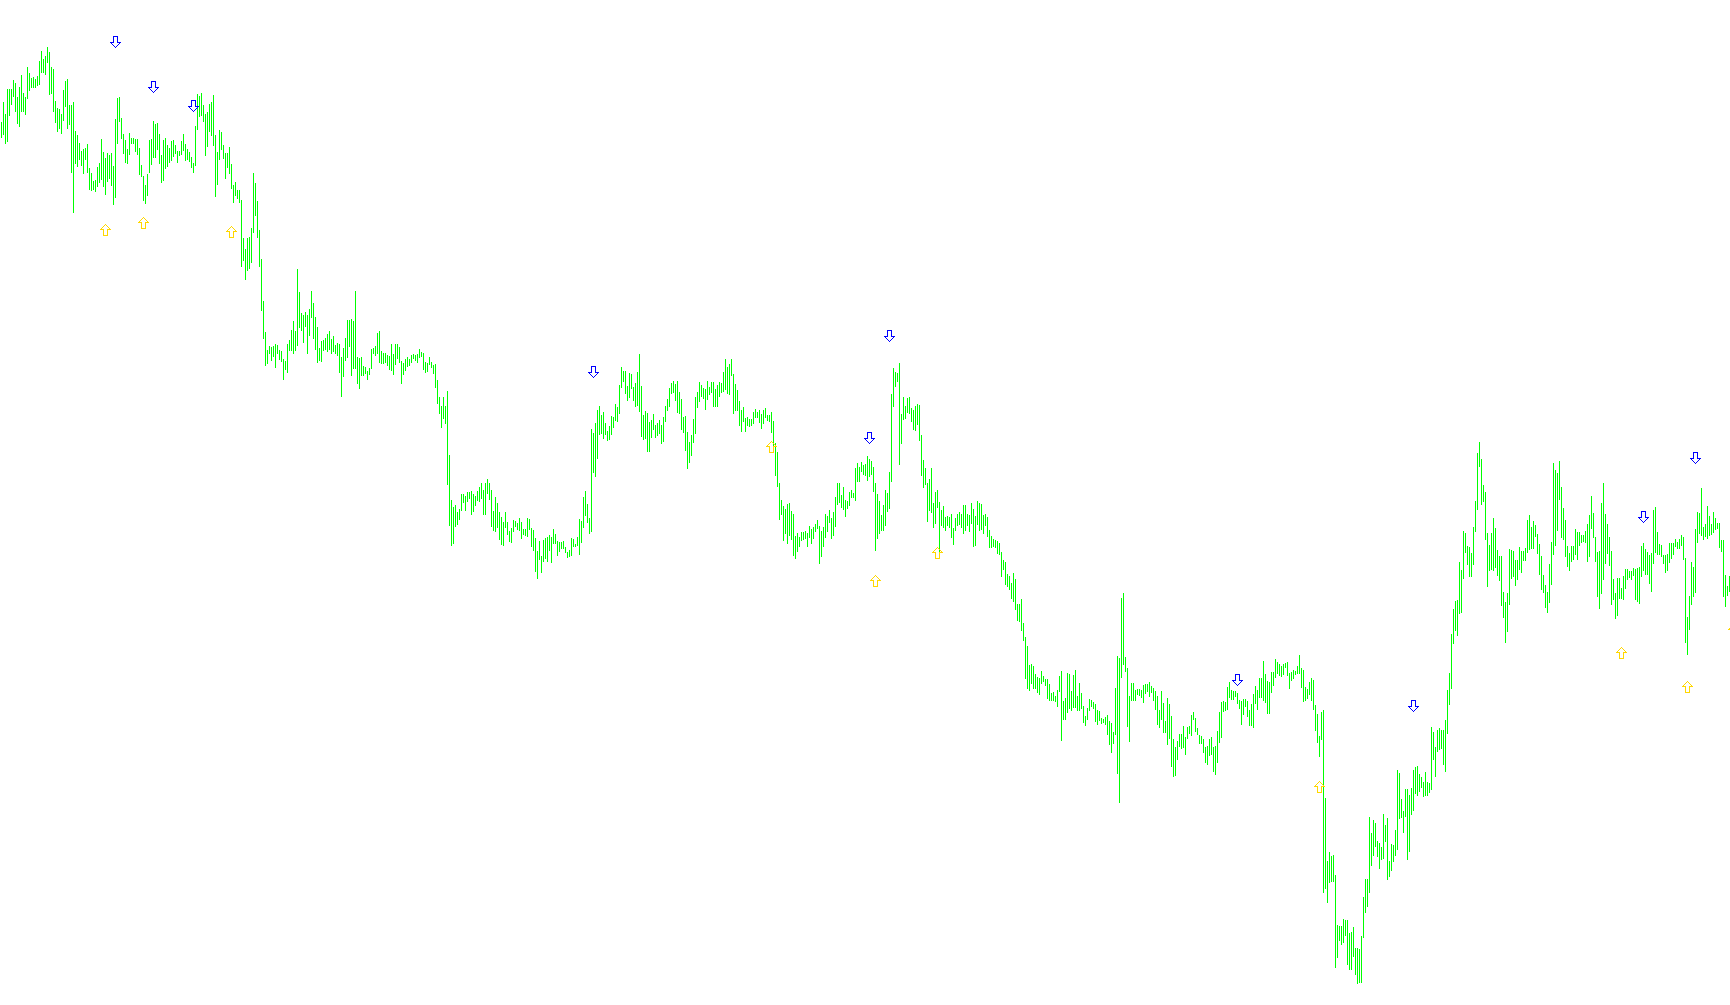
This indicator identifies bullish and bearish entries by synchronizing moving average crossovers with RSI volatility thresholds, Stochastic momentum spreads, and MACD signal polarity.

10Min_011a_v2
Indicator

10Min_011a_v2

iMACDiMAiRSIiStochastic

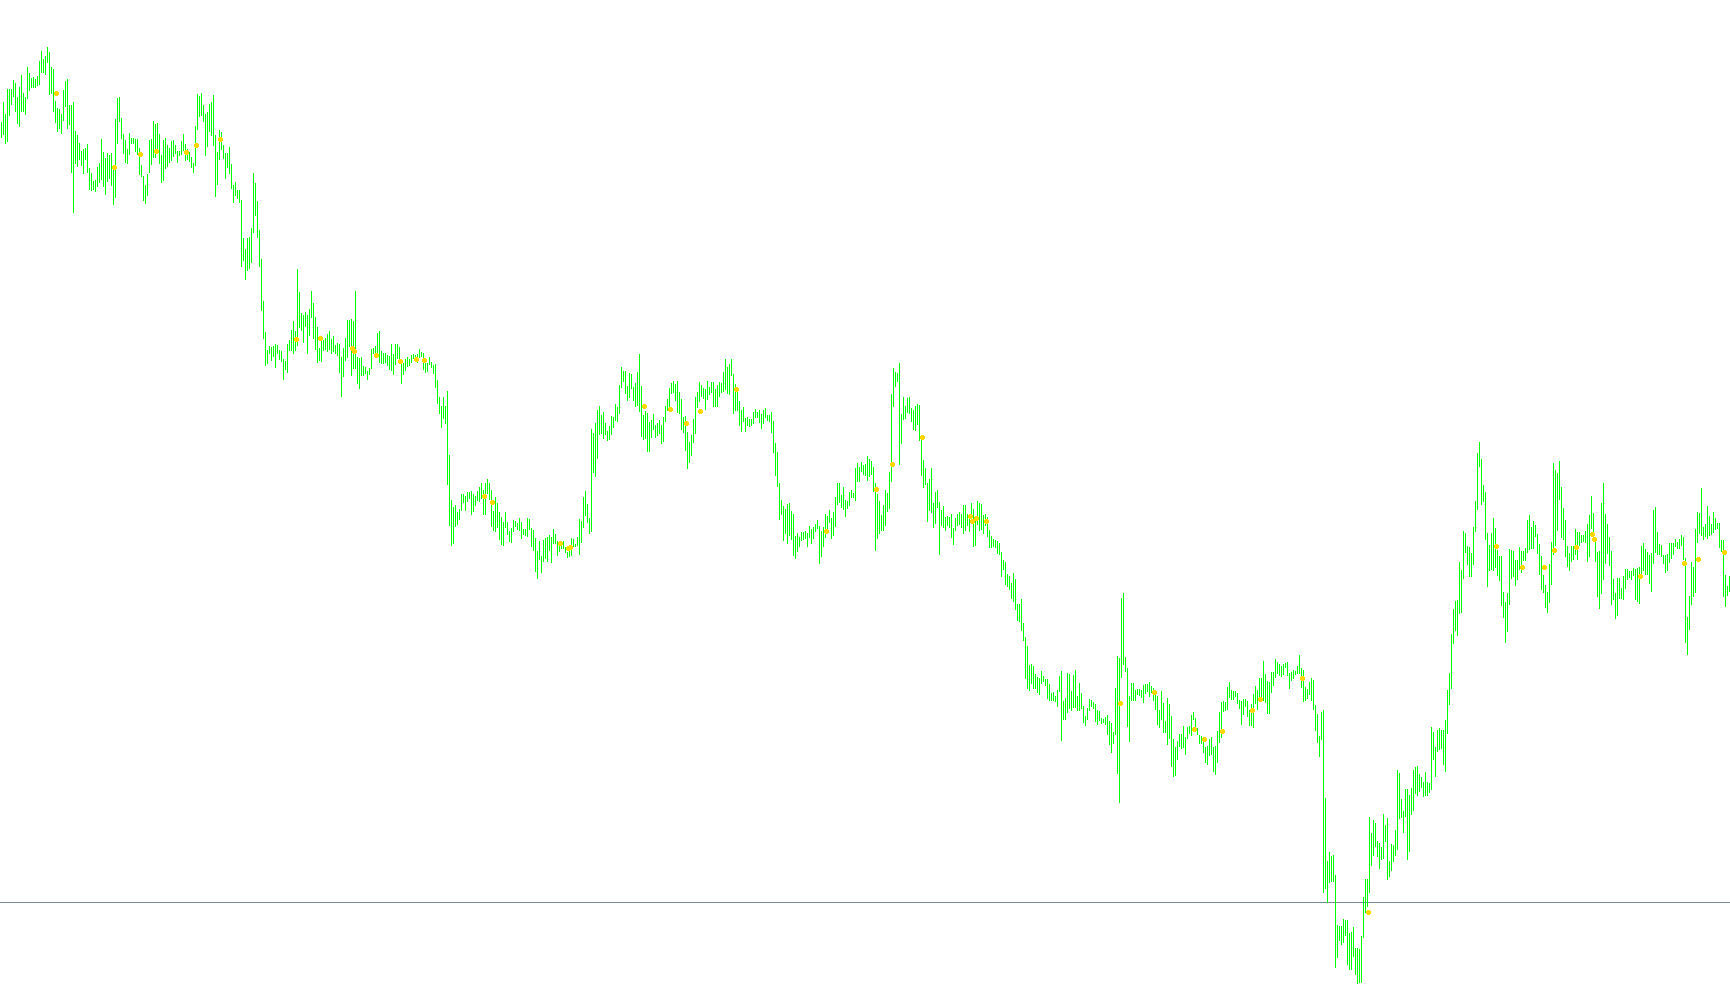
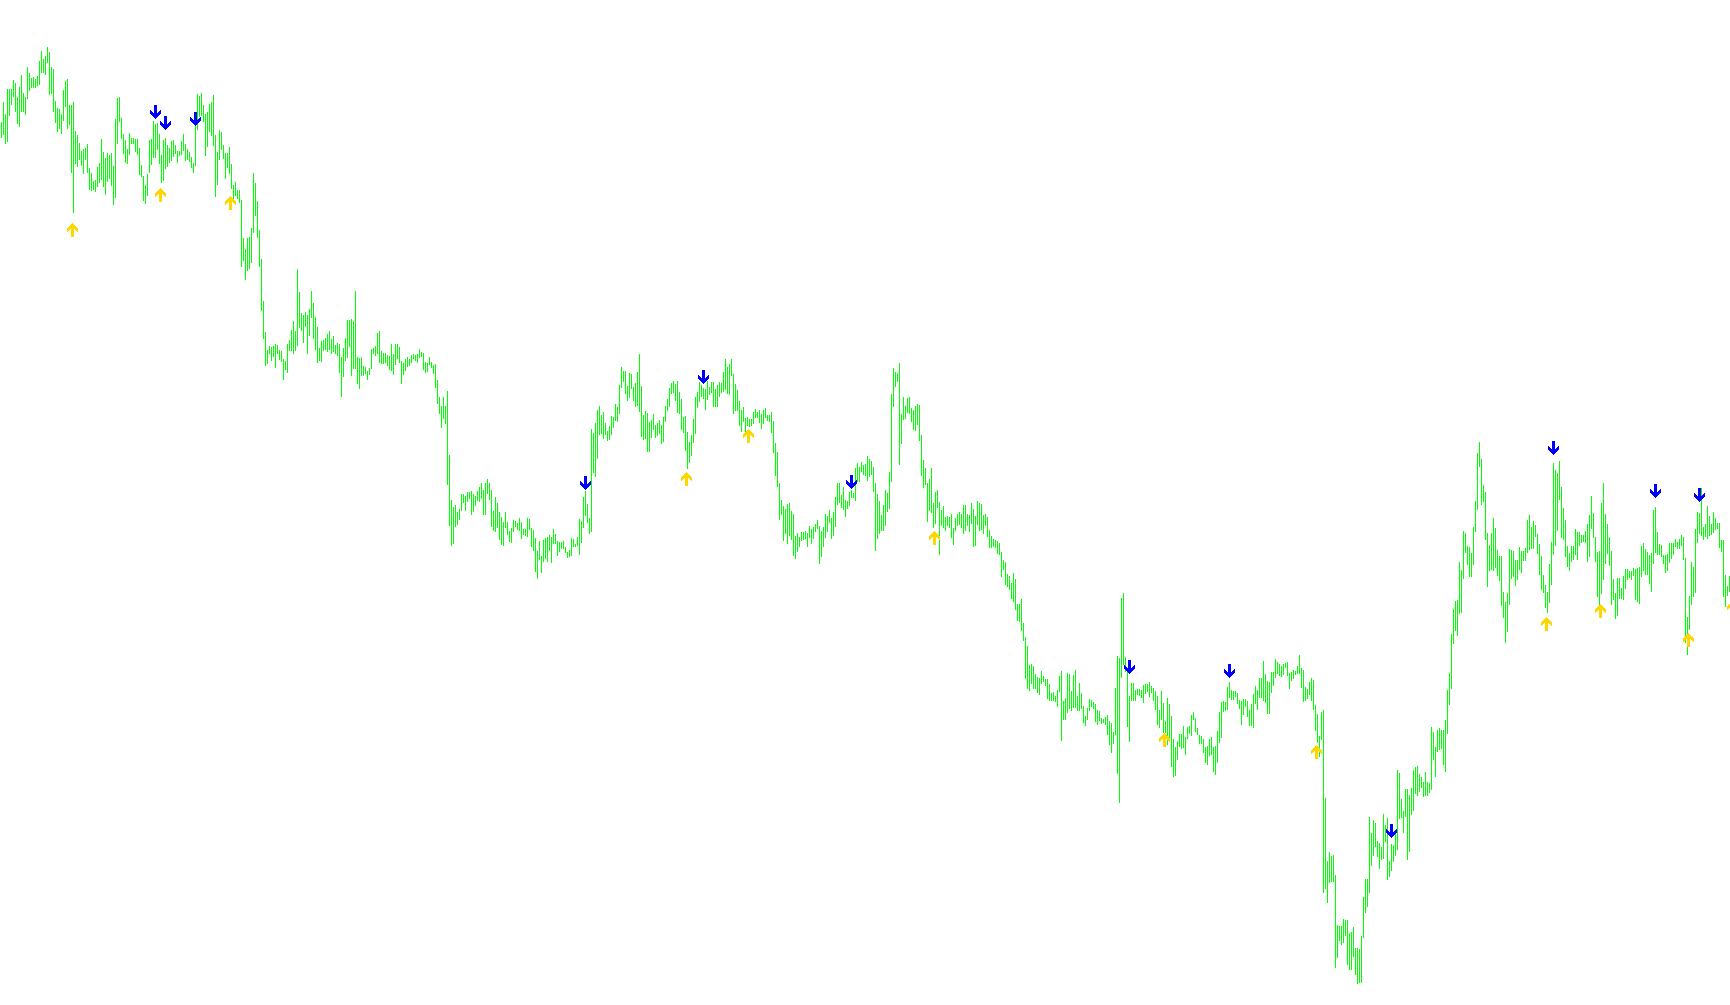
This indicator identifies high-probability entry points by synchronizing Weighted/Simple Moving Average crossovers with RSI momentum shifts, MACD trend positioning, and Stochastic oscillator extremes.

10Min_011_v1
Indicator

10Min_011_v1

iMACDiMAiRSIiStochastic

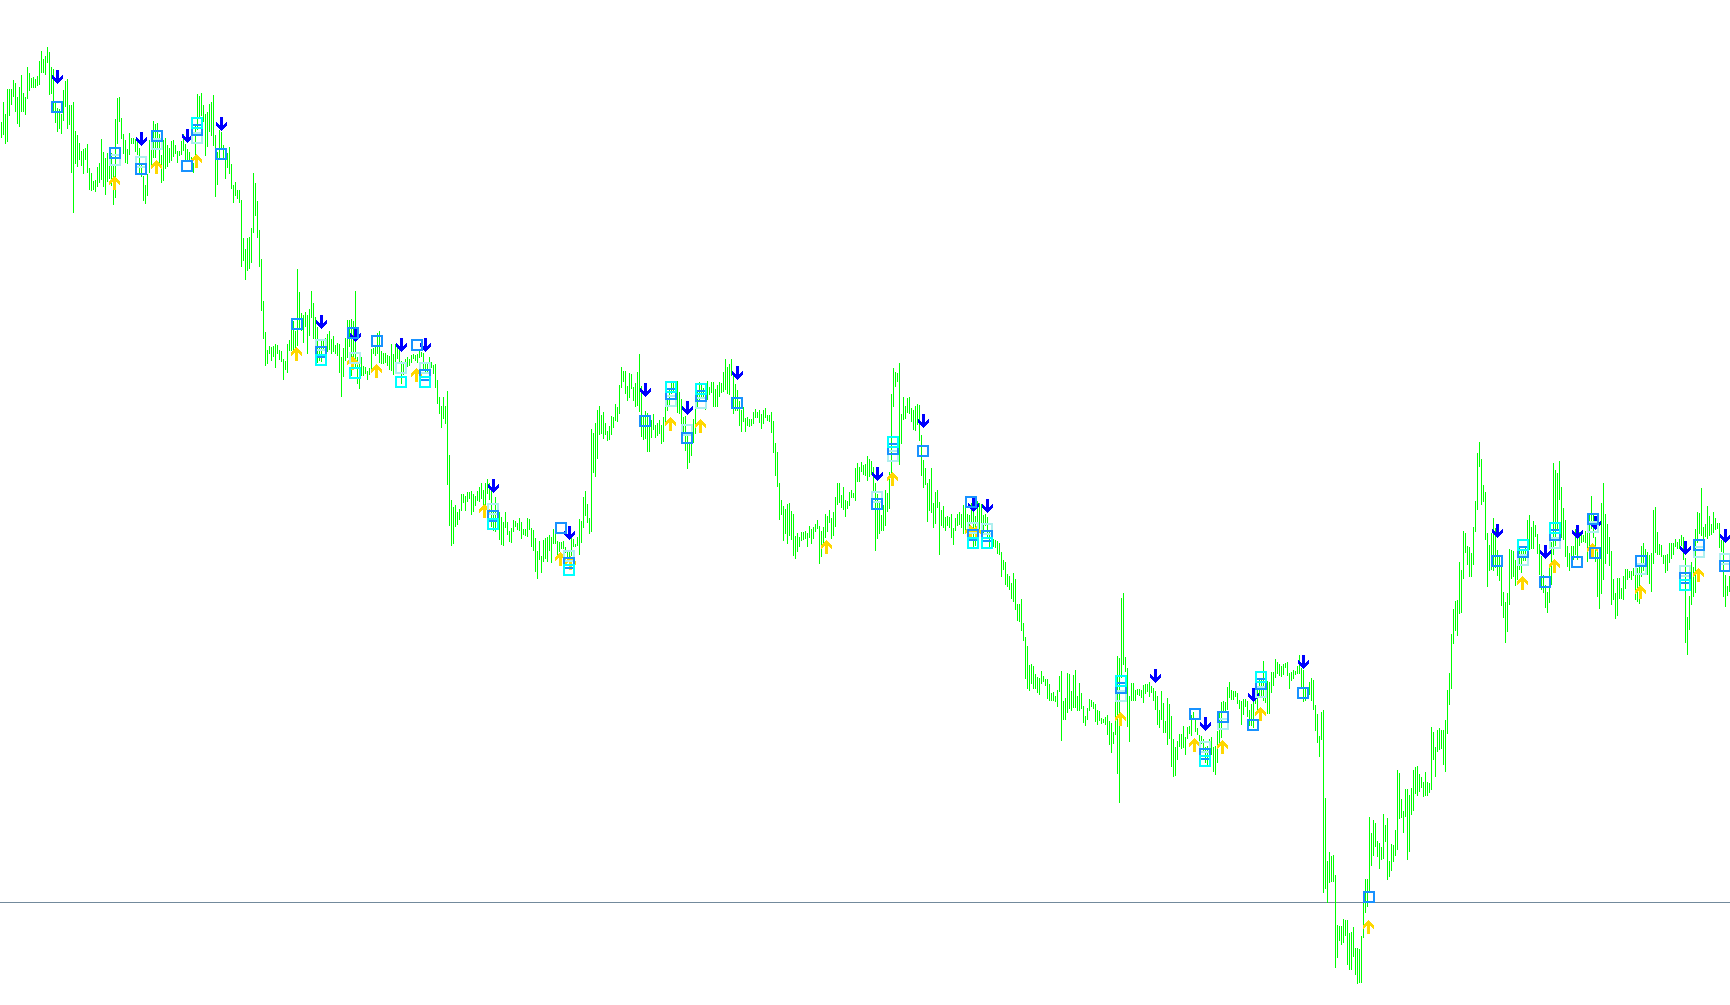
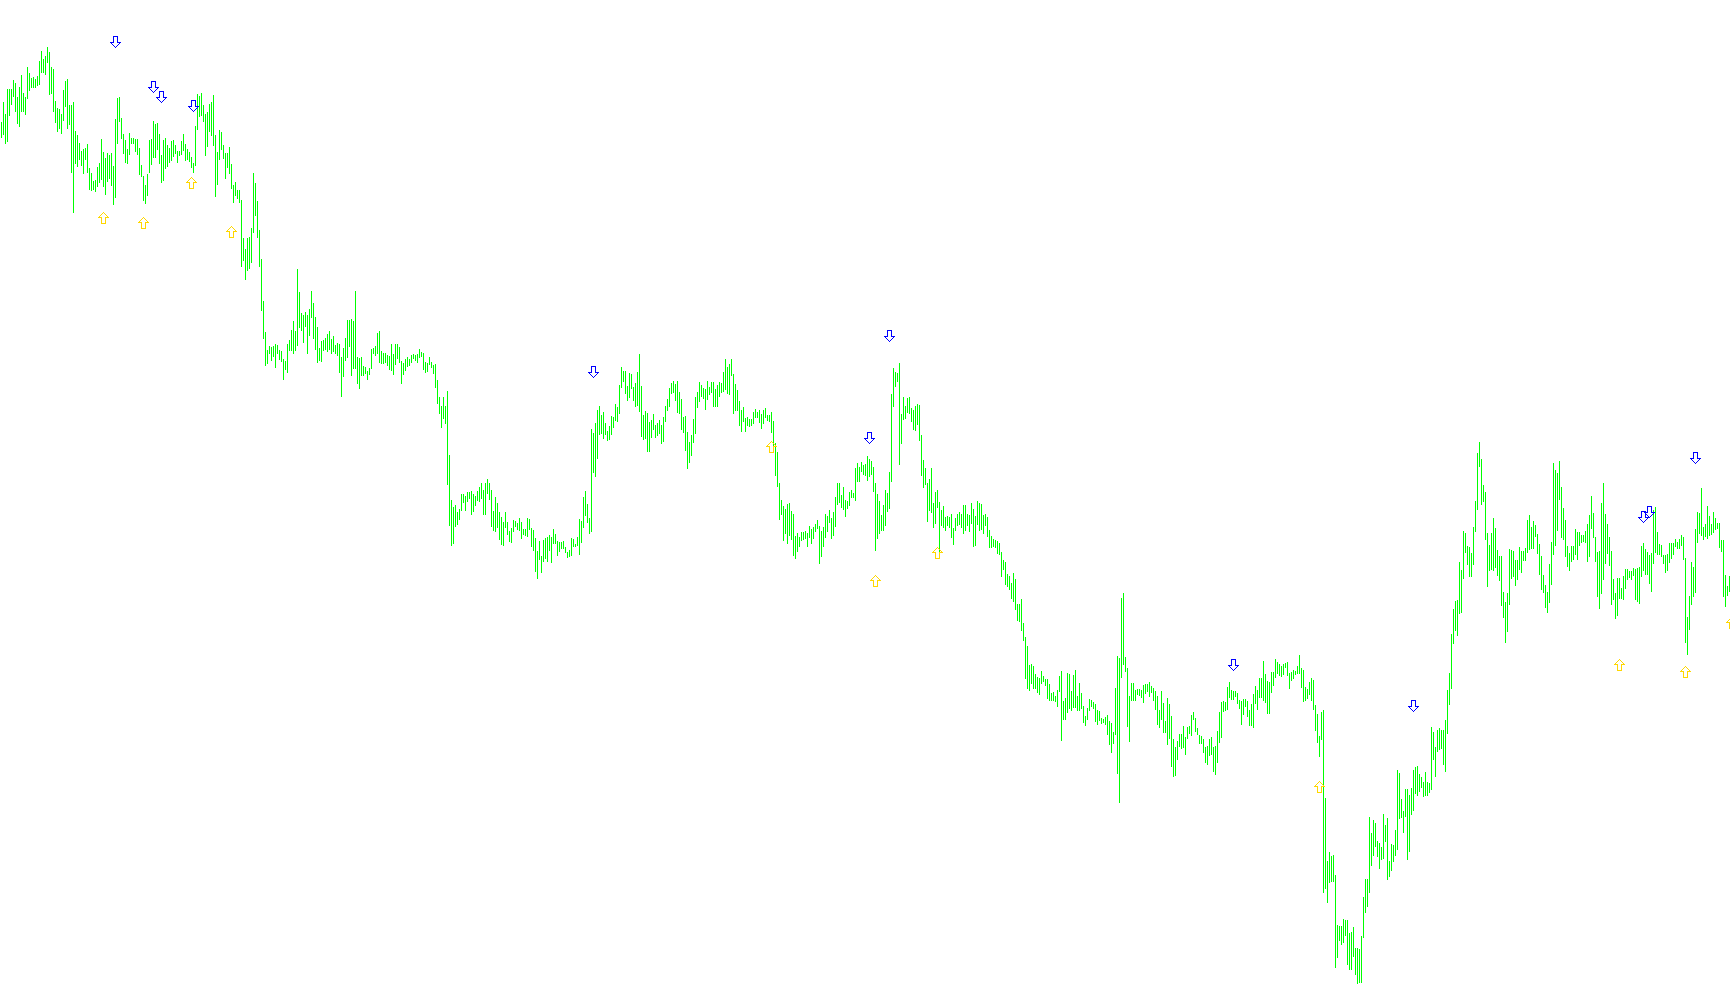
This indicator identifies high-probability trend reversals by synchronizing weighted moving average crossovers with momentum shifts from Stochastic, RSI, and MACD oscillators.

10Min_012
Indicator

10Min_012

iMACDiMAiRSIiStochastic

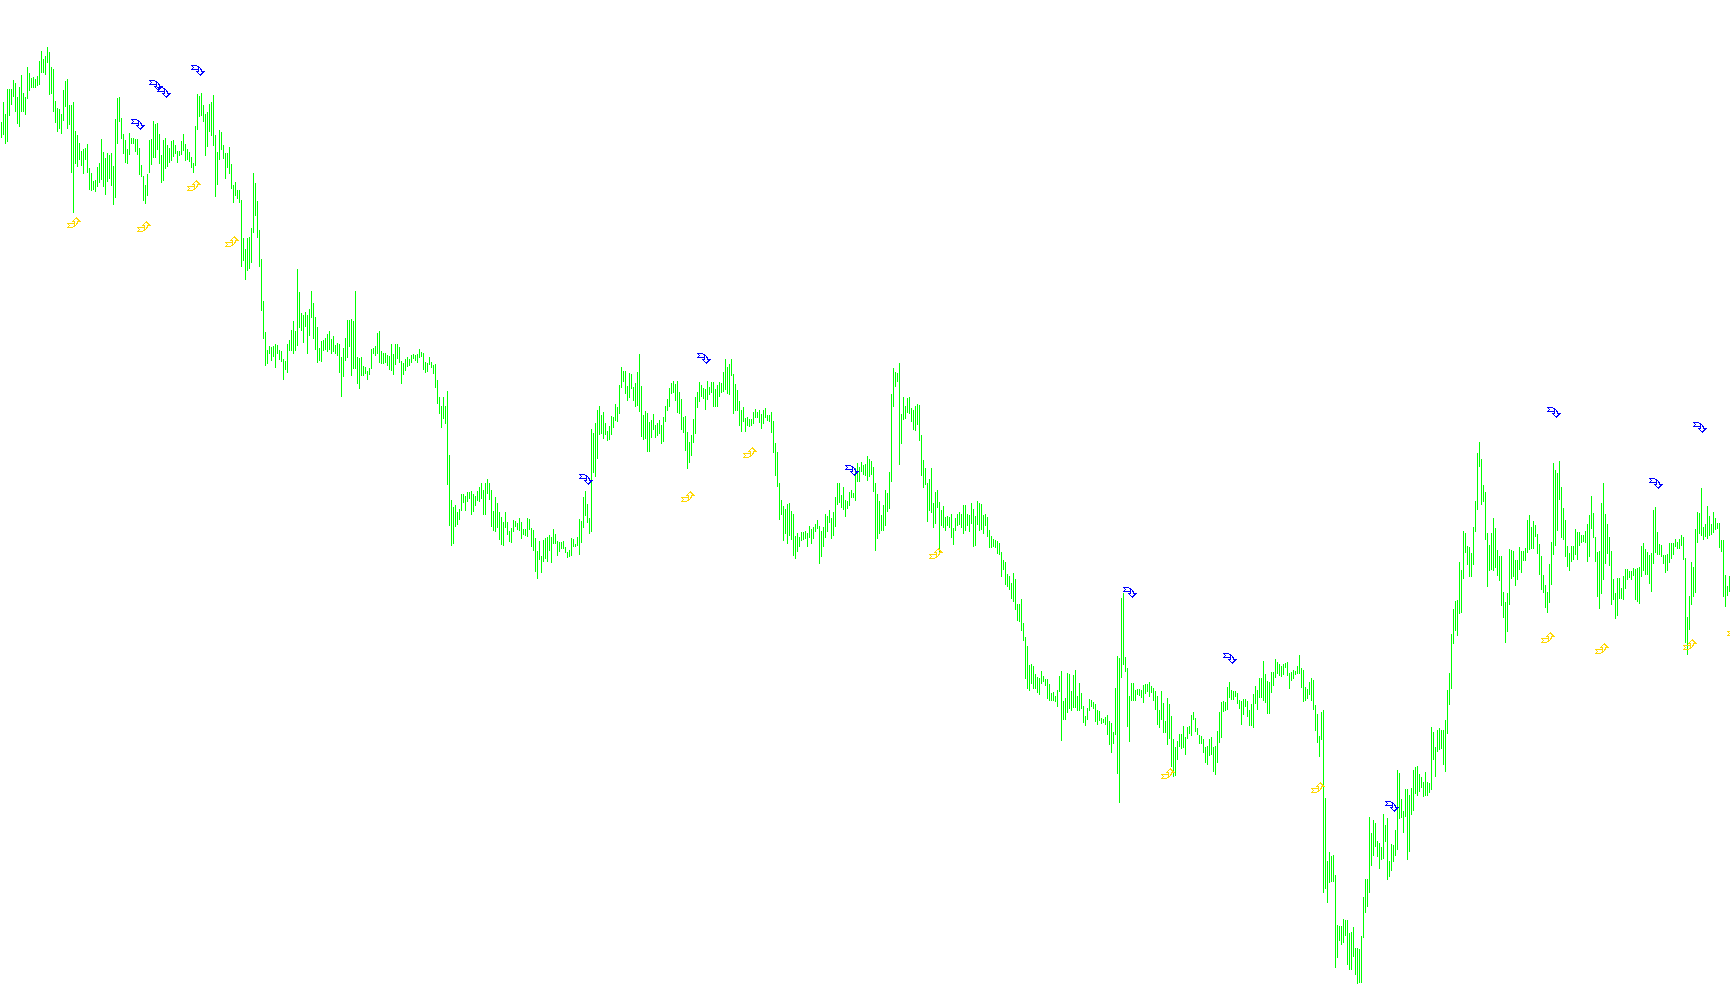
This indicator identifies trend reversal points by synchronizing Weighted Moving Average crossovers with RSI threshold shifts, Stochastic main/signal positioning, and MACD signal line polarity.

10Min_012_v1
Indicator

10Min_012_v1

iMACDiMAiRSIiStochastic

This indicator identifies high-probability trend reversals by synchronizing Weighted Moving Average crossovers with RSI momentum shifts, Stochastic oscillator alignment, and MACD signal position.

10Min_01_v1
Indicator

10Min_01_v1

iMACDiMAiRSIiStochastic

Identifies high-probability momentum shifts by detecting the precise intersection of Linear Weighted and Simple Moving Averages.

10Min_2ind
Indicator

10Min_2ind

iMAiRSIiStochastic

This indicator identifies trend reversals by detecting Weighted Moving Average crossovers relative to Simple Moving Averages, filtered through Stochastic momentum shifts and RSI strength thresholds.

10Min_2ind_v1
Indicator

10Min_2ind_v1

iMAiRSIiStochastic

This indicator identifies momentum shifts by detecting Weighted Moving Average crossovers against Simple Moving Averages, filtered through RSI threshold breaches and Stochastic Main/Signal polarity.

10Min_RsiSto_01
Indicator

10Min_RsiSto_01

iMACDiMAiRSIiStochastic

This indicator identifies high-probability reversals by detecting simultaneous extreme overbought and oversold conditions across consecutive RSI and Stochastic oscillators.

10Min_RsiSto_01_v1
Indicator

10Min_RsiSto_01_v1

iMACDiMAiRSIiStochastic

This indicator identifies high-probability reversal zones by detecting sustained RSI overbought/oversold conditions synchronized with extreme Stochastic oscillator thresholds.

10nonlag
Indicator

10nonlag

iMA

This indicator calculates a low-latency moving average by applying a cosine-based weighting coefficient combined with a standard deviation threshold to filter out noise and visualize momentum shifts.

10pippricebar
Indicator

10pippricebar

This script reconstructs and exports synthetic Renko price action data by calculating fixed-range movements from high-frequency M1 price ticks into a structured binary history file.

10piprenko
Indicator

10piprenko

This script reconstructs and exports synthetic Renko chart data by processing M1 price action into fixed-price movement blocks and saving them to a binary history file.

1111111
Indicator

1111111

The algorithm utilizes a recursive smoothing process to calculate a relative strength index based on cumulative directional deviations of four layered price components.

12RV
Indicator

12RV

This indicator identifies price extremes by calculating rolling local minima and maxima over specific periods to generate visual signals for potential trend reversals.

13008d1155015516-indicators-alert-signal-shi_silvertrendsigalert
Indicator

13008d1155015516-indicators-alert-signal-shi_silvertrendsigalert

This indicator identifies potential trend reversals by detecting price breaches of dynamic high-low boundaries weighted by localized volatility expansion.

13008d1155015516-indicators-alert-signal-shi_silvertrendsigalert_001
Indicator

13008d1155015516-indicators-alert-signal-shi_silvertrendsigalert_001

This indicator identifies potential trend reversal points by detecting price breaches of high-low boundaries relative to a dynamic volatility-weighted offset.
1420
Indicator

1420

This indicator identifies and plots historical high-low boundaries for specific trading windows to highlight price breakout opportunities based on session volatility.

16191-system
Indicator

16191-system

This indicator identifies trend shifts by calculating a risk-adjusted price envelope based on high/low extremes and plots dynamic trailing stop levels.

172_GRFLeadingEdge
Indicator

172_GRFLeadingEdge

This indicator employs Least Squares Line fitting on geometric mean price samples to project a leading trendline and asymmetrical standard deviation bands.

1820
Indicator

1820

This indicator dynamically renders historical price boundaries and breakout bands based on specific market session timeframes to identify volatility corridors.

18_28Cross
Indicator

18_28Cross

iMA

This indicator identifies trend reversals by detecting simultaneous bullish or bearish crossovers between two customizable moving averages using a price-range offset for signal visualization.

1MINSCALP
Indicator

1MINSCALP

Identifies bullish and bearish entry points by detecting precise directional breaches of the MTF_TrendEnvelopes threshold values.

1MINSCALP_v1
Indicator

1MINSCALP_v1

The indicator identifies reversal opportunities by detecting downward price breaches of the TrendEnvelopes upper and lower boundaries.

1_Fish
Indicator

1_Fish

This indicator calculates a normalized price range velocity transformed through a logarithmic function to identify trend extremes and momentum shifts.

1_Fish_v1
Indicator

1_Fish_v1

This indicator calculates a smoothed logarithmic price action derivative to identify momentum shifts and trend reversals through histogram color coding.

1_Min_MicroTrading
Indicator

1_Min_MicroTrading

iMACDiADXiMA

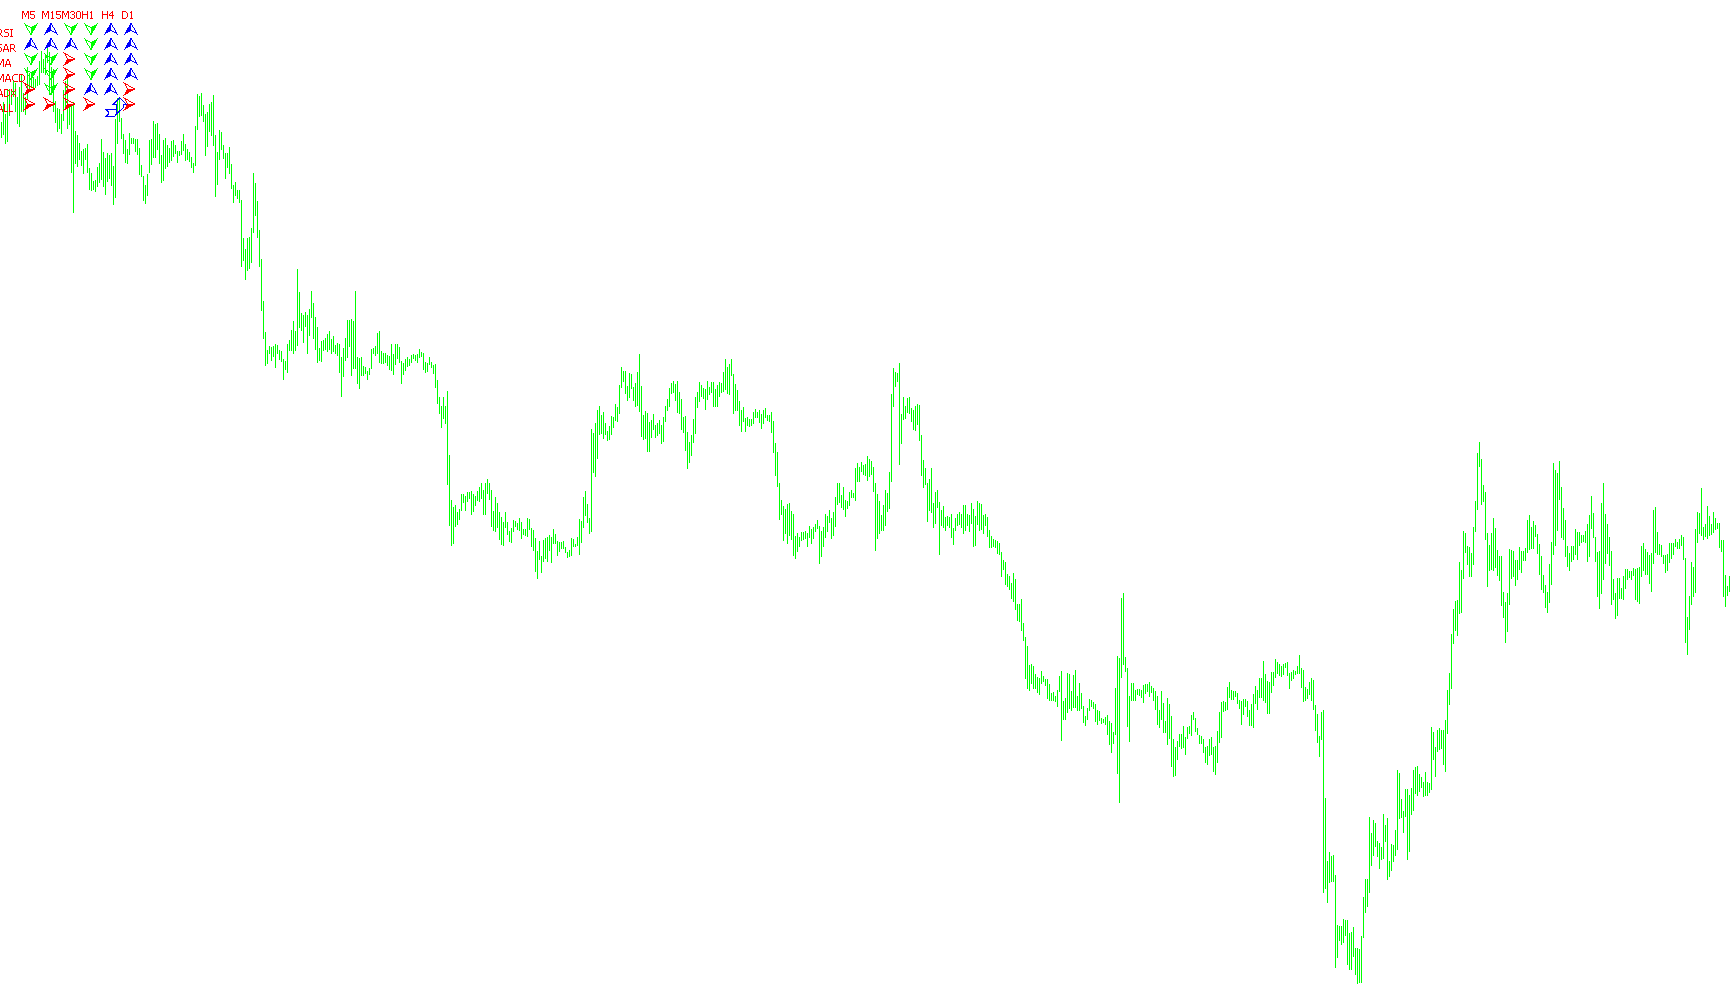
This indicator aggregates real-time signals from RSI, Parabolic SAR, Moving Averages, MACD, and ADX across six distinct timeframes to identify synchronized trend confirmations.

1_v1
Indicator

1_v1

This indicator calculates four concurrent triple-smoothed moving averages using recursive weight distribution to identify directional shifts and momentum trends.

1_v3
Indicator

1_v3

This indicator calculates four concurrent Triple Exponential Moving Average (T3) curves with varying smoothing coefficients to identify trend direction and momentum shifts across multiple time scales.

2
Indicator

2

iMA

Identifies specific price points where moving average trajectories flip positions using visual arrow signals placed above or below the candle range.

20090717_SupportEX_v.3
Indicator

20090717_SupportEX_v.3

This indicator projects historical open, close, high, and low levels from daily, weekly, and monthly periods onto the current chart as visual horizontal references.

20piprenko
Indicator

20piprenko

This script processes minute-by-minute price action to reconstruct and export synthetic Renko bars into a custom history file based on specified price movement thresholds.

Indicator

20s_Indicator_ts_mtf

22-FIBTunnel
Indicator

22-FIBTunnel

iMA

This indicator projects dynamic support and resistance zones by offsetting a 233-period Exponential Moving Average with specific Fibonacci sequence intervals.

25piprenko
Indicator

25piprenko

This script converts standard M1 candlestick data into a custom Renko-style historical file by calculating price fluctuations based on fixed point ranges and recording real-time structural transitions.

2CCI alerts
Indicator

2CCI alerts

iCCI

This indicator triggers audio and visual alerts when two distinct CCI periods simultaneously breach a defined zero-level threshold, confirming synchronized momentum shifts.

2CCI_ZeroCross_alert
Indicator

2CCI_ZeroCross_alert

iCCI

This indicator triggers alerts when a long-term trend CCI and a short-term entry CCI simultaneously breach the zero line in the same direction.

2CCI_ZeroCross_Alert_001
Indicator

2CCI_ZeroCross_Alert_001

iCCI

This indicator triggers alerts when a fast entry Commodity Channel Index signal aligns with a structural trend crossing of the zero midline.

2CCI_ZeroCross_Alert_v1
Indicator

2CCI_ZeroCross_Alert_v1

iCCI

Triggers notifications when both a long-term trend CCI and a short-term entry CCI simultaneously transition across the zero boundary.

2Graphs
Indicator

2Graphs

This indicator renders a normalized, side-by-side visual representation of two different financial instruments on a single chart to facilitate comparative price action analysis.

2MA Crossover
Indicator

2MA Crossover

iMA

Detects precise bullish and bearish momentum shifts by identifying the crossover of two customizable moving average types with integrated visual markers and push notifications.

2MA Crossover2-mtf
Indicator

2MA Crossover2-mtf

iMA

This indicator identifies trend reversals by detecting the precise intersection of two customizable moving averages and plots directional arrows with real-time visual and electronic alerts.

2MA CrossoverWithPrice
Indicator

2MA CrossoverWithPrice

iMA

This indicator identifies precise trend reversals by detecting the intersection of two customizable moving averages and projects visual markers based on local price volatility.

2MA CrossoverWithPrice_002
Indicator

2MA CrossoverWithPrice_002

iMA

This indicator detects and visually marks precise crossovers between two customizable moving averages while triggering real-time push notifications.

2MA Crossover_003
Indicator

2MA Crossover_003

iMA

This indicator identifies momentum shifts by detecting precise intersection points between two customizable moving average types and triggers visual signals with real-time alerts.

2MA Crossover_004
Indicator

2MA Crossover_004

iMA

This indicator identifies bullish and bearish reversals by detecting the specific moment two user-defined moving averages intersect, providing visual arrows and real-time notifications.

Indicator

2MA_Lib_Sample

iMA
Indicator

2MA_Lib_Sample2

iMA
2MA_RSI
Indicator

2MA_RSI

iMAOnArrayiRSI

This indicator identifies momentum shifts by applying two distinct moving average crossovers directly onto a multi-timeframe Relative Strength Index base.

2nd Order Gaussian High Pass Filter
Indicator

2nd Order Gaussian High Pass Filter

This indicator implements a high-order recursive filtering algorithm that calculates momentum by balancing current price acceleration against historical volatility weights.