Indicator

CatFX50_v1

iATRiMA
Indicator

CatFX50_v2

iATRiMA
CC
Indicator

CC

iMA

This indicator calculates and visualizes the real-time price dynamics between multiple major currency pairs by synthesizing weighted moving average differentials into a unified correlation overview.

CCFp
Indicator

CCFp

iMA

This indicator visualizes the relative strength and dynamic interaction between major forex pairs by calculating differential ratios of fast and slow moving averages.

CCFp_v1
Indicator

CCFp_v1

iMA

This indicator calculates the relative divergence between multiple currency pairs using smoothed moving average ratios to visualize cross-asset momentum and lead-lag relationships.

CCFp_v1[1].0.2
Indicator

CCFp_v1[1].0.2

iMA

This indicator calculates and visualizes the relative price velocity of major forex pairs by comparing weighted moving average deviations across a diversified currency basket.

CCFp_v1[1].0.2a
Indicator

CCFp_v1[1].0.2a

iMA

This indicator calculates the relative momentum of major fiat currencies by synthesizing moving average deviations across multiple currency pairs to visualize instantaneous directional strength.
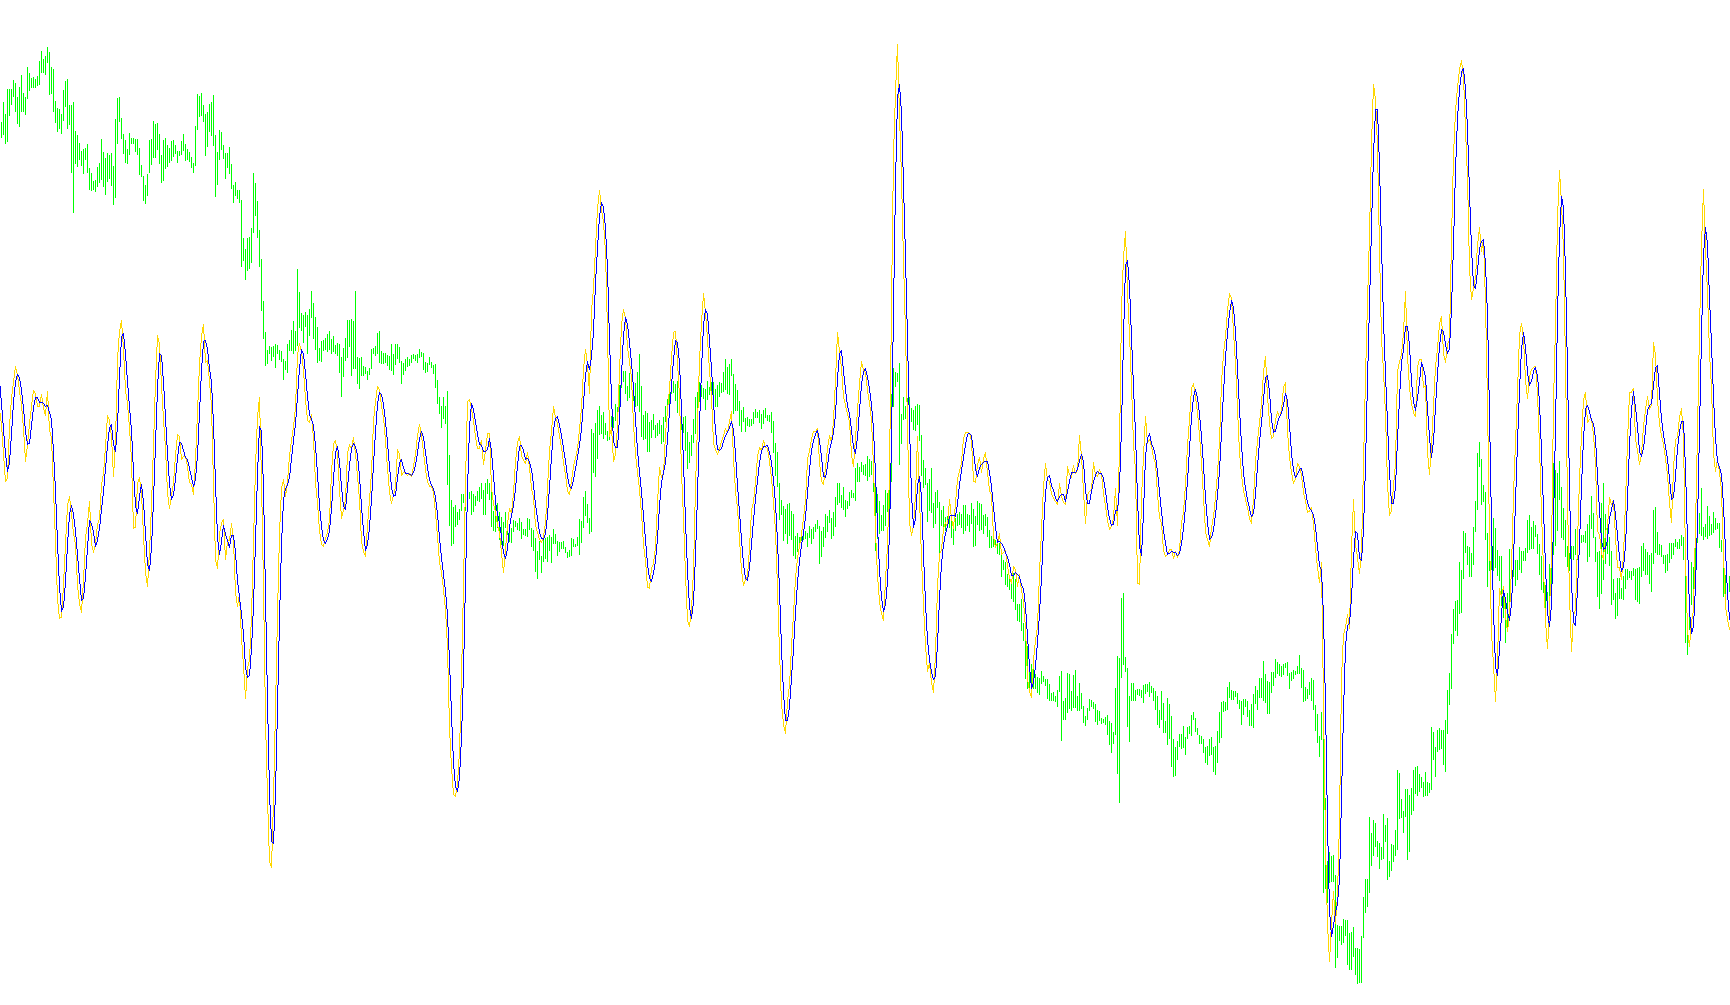
CCFp_v1[1].0.2b
Indicator

CCFp_v1[1].0.2b

iMA

This indicator quantifies the interdependency of major forex pairs by calculating weighted relative strength movements across a diverse basket of currencies simultaneously.

CCFp_v1[1].0.2bvert
Indicator

CCFp_v1[1].0.2bvert

iMA

This indicator calculates the relative strength and momentum of major global currencies by analyzing price velocity differentials across multiple currency pairs simultaneously.

CCFp_v1[1].0.2cvert
Indicator

CCFp_v1[1].0.2cvert

iMA

This indicator calculates and visualizes the relative strength differentials between major global currencies by comparing moving average ratios across a multi-pair synthetic matrix.

CCFp_v1[1].0.3cvert
Indicator

CCFp_v1[1].0.3cvert

iMA

This indicator calculates and visualizes the relative strength and moving average deviations of major currency pairs to identify cross-market correlations.

CCFp_v1[1].0.3dvert
Indicator

CCFp_v1[1].0.3dvert

iMA

This indicator calculates and visualizes the relative price velocity of major currencies by aggregating the percentage change between specific currency pairs to identify leading market strengths.

CCI
Indicator

CCI

iMA

Quantifies the current price's distance from a rolling average relative to the mean absolute deviation of the typical price.

CCIAverage
Indicator

CCIAverage

iMA

This indicator calculates the Commodity Channel Index and applies a Simple Moving Average to its values to filter out high-frequency noise and identify trend momentum.

CCISqueeze
Indicator

CCISqueeze

iATRiMAiStdDev

This indicator identifies market compression by measuring the ratio between Bollinger Band width and Keltner Channel range, overlaid with a Commodity Channel Index (CCI) momentum histogram.

CCI_MA
Indicator

CCI_MA

iMA

This indicator quantifies price deviation from a customizable moving average—including SMA, EMA, SMMA, LWMA, and LSMA variants—by normalizing the relative distance against standard deviation units.

CCI_MA_Smoothed
Indicator

CCI_MA_Smoothed

iMAiMAOnArray

This indicator calculates the Commodity Channel Index by computing the price deviation from a customizable moving average—including Linear Regression—and applies an additional smoothing layer to filter noise.

CCI_onMA
Indicator

CCI_onMA

iCCIiMA

This indicator synthesizes a smoothed Commodity Channel Index value with a Moving Average to create a proprietary price trend signal.

CCI_onMA_MAs
Indicator

CCI_onMA_MAs

iCCIiMA

This indicator synthesizes the Commodity Channel Index with Moving Average values to create a weighted trend overlay and offset price lines based on momentum deviations.

CCI_onMA_MAs_v1
Indicator

CCI_onMA_MAs_v1

iCCIiMA

This indicator overlays a scaled Commodity Channel Index onto specific Moving Average types to visualize momentum deviation relative to trend-based price averages.

CCI_onMA_sigMA
Indicator

CCI_onMA_sigMA

iCCIiMAiMAOnArray

This indicator synthesizes price momentum by scaling the Commodity Channel Index (CCI) as a dynamic offset to a standard moving average, followed by a secondary smoothing signal.

CCI_onMA_SmzSigMA
Indicator

CCI_onMA_SmzSigMA

iCCIiMAiMAOnArray

This indicator calculates a secondary moving average sequence derived from the product of the CCI values and a primary MA buffer to identify momentum smoothing.

CCI_onMA_v1
Indicator

CCI_onMA_v1

iCCIiMA

This indicator synthesizes a smoothed Commodity Channel Index with a Moving Average by applying a specific multiplier to the CCI value and adding it to the base MA trendline.

CCI_Sound_Email
Indicator

CCI_Sound_Email

iMA

This indicator calculates the Commodity Channel Index to identify price extremes relative to standard deviation, triggering real-time auditory and electronic notifications when values breach predefined high or low boundaries.

CCI_v1
Indicator

CCI_v1

iMA

This indicator quantifies the relative deviation of the typical price from its simple moving average by normalizing the distance against the mean absolute deviation.

CCI_v2
Indicator

CCI_v2

iMA

This indicator quantifies market overextension by calculating the ratio of the current typical price deviation relative to its moving average standard deviation.

Indicator

cci_wcci_iGentorLSMAEMAm4L_overlay_mtf

iMA
CCI_Woodies_Lnx_Sky
Indicator

CCI_Woodies_Lnx_Sky

iCCIiMA

This indicator identifies multi-timeframe market regimes by blending smoothed Commodity Channel Index (CCI) calculations with a Linear Weighted Moving Average (LSMA) to highlight trend transitions and momentum shifts.

CCI_Woodies_Lnx_v1_1
Indicator

CCI_Woodies_Lnx_v1_1

iCCIiMA

This indicator synthesizes Woodie-style momentum logic by integrating dual-period Commodity Channel Index (CCI) histograms with a Linear Scatting Moving Average (LSMA) to identify trend confirmation and price action equilibrium.

CCI_Woodies_Lnx_v1_1_v1
Indicator

CCI_Woodies_Lnx_v1_1_v1

iCCIiMA

This indicator synthesizes Woodie-style multi-color CCI histograms with a center-weighted LSMA to visualize trend momentum transitions and price-relative positioning.

CCI_Woodies_Lnx_v2
Indicator

CCI_Woodies_Lnx_v2

iCCIiMA

This indicator identifies multi-stage market trends by combining Commodity Channel Index (CCI) histogram shifts with an integrated Linear Scoped Moving Average (LSMA) for dynamic price action filtering.

CCI_Woodies_Lnx_v3
Indicator

CCI_Woodies_Lnx_v3

iCCIiMA

This indicator integrates dual Commodity Channel Index (CCI) periods with a custom Linear Scanned Moving Average (LSMA) to visualize trend velocity, transition phases, and momentum shifts through multi-colored histogram layers.

CCI_Woodies_Lnx_v3_1
Indicator

CCI_Woodies_Lnx_v3_1

iCCIiMA

This indicator synthesizes multi-period Commodity Channel Index (CCI) values with a Linear Weighted Moving Average (LSMA) to dynamically visualize trend transitions, exhaustion zones, and momentum shifts through color-coded histograms.

CCI_Woodies_Lnx_v3_1_002
Indicator

CCI_Woodies_Lnx_v3_1_002

iCCIiMA

This indicator synthesizes multi-period Commodity Channel Index (CCI) values with a Linear Scanned Moving Average (LSMA) to visualize trend exhaustion, transition phases, and momentum polarity.

CCI_Woodies_Lnx_v3_1_v1
Indicator

CCI_Woodies_Lnx_v3_1_v1

iCCIiMA

This indicator visualizes multi-layered momentum by categorizing Commodity Channel Index data into directional trend states using a period-based confirmation logic combined with LSMA and EMA filters.

CCI_Woodies_Lnx_v3_1_v2
Indicator

CCI_Woodies_Lnx_v3_1_v2

iCCIiMA

This indicator synthesizes a dual-CCI framework with smoothed LSMA filtering to identify trend structural shifts and momentum transitions via color-coded histogram states.

CCI_Woodies_Lnx_v5
Indicator

CCI_Woodies_Lnx_v5

iCCIiMA

This indicator synchronizes multi-period Commodity Channel Index (CCI) histograms with Linear Scans and Exponential Moving Averages to identify trend shifts and price momentum extremes.

CCI_Woodies_Lnx_v6
Indicator

CCI_Woodies_Lnx_v6

iCCIiMA

This indicator synthesizes Woodie-style logic by overlaying LSMA and EMA filters onto dual CCI periods to identify trend shifts through multi-colored histogram dynamics.

CCI_Woodies_Valeo
Indicator

CCI_Woodies_Valeo

iCCIiMA

This indicator identifies trend shifts by analyzing the interaction between multiple Commodity Channel Index periods, a weighted LSMA center line, and signal-based histogram color transitions.

Indicator

CCI_Woodie_mtf

iCCIiMA
Indicator

CC_at_s_v2

iMA
Indicator

CC_at_s_v2_001

iMA
Indicator

cc_Divergence

iMA
CC_v1
Indicator

CC_v1

iMA

This indicator calculates and visualizes the relative price momentum between major currency pairs by computing the differential of dual moving averages across a multi-currency basket.

cd
Indicator

cd

iMAiMAOnArray

Identifies bullish and bearish reversal points by detecting price crossovers between a dynamic ratio of short-term to long-term EMAs and its smoothed moving average.

Center_of_Gravityind
Indicator

Center_of_Gravityind

iMAiMAOnArray

This indicator calculates the relative balance of price momentum by weighing historical price points against their moving averages to identify divergence and mean reversion.

CFP-1
Indicator

CFP-1

iMA

This indicator aggregates weighted moving average discrepancies across multiple currency pairs to derive a unified momentum flux for a specific base currency.

Indicator

CFP

iMA
chainpricersi
Indicator

chainpricersi

iMAiRSI

This indicator identifies directional entry points by correlating RSI smoothed moving averages with weighted price momentum shifts.

chanel_scalper
Indicator

chanel_scalper

iATRiMA

The logic identifies structural shifts by monitoring price breaches of mid-point ranges expanded by Average True Range volatility factors.